Abstract
Objective
To test the hypothesis that the renal medulla may reflect rejection related changes and thus have a predictive value in the assessment of acute renal allograft rejection or chronic graft damage.
Methods
75 post‐transplant biopsies from 57 patients were scored according to the Banff 1997 scheme. The biopsies with adequate cortical and medullary tissue (n = 23) were selected and medullary tissues were reviewed for rejection related lesions except intimal arteritis. Chronic damage was determined by image analysis depending on periodic acid‐methenamine silver (PAMS)‐Masson trichrome (MT) staining. Medullary and cortical changes were compared.
Results
Interstitial inflammation and tubulitis were more frequent and severe in the cortex (p<0.001). Medullary tubulitis was associated with intimal arteritis (p = 0.003, r = 0.598). Medullary interstitial inflammation (n = 8) and tubulitis (n = 4) were associated with cortical borderline changes (n = 5) or allograft rejection (n = 3). The sensitivity, specificity, and positive and negative predictive values of medullary inflammatory changes in predicting cortical allograft rejection were 43%, 69%, 37%, and 73%, respectively. A significant association was observed between medullary MT‐SAP and cortical PAMS‐SAP values (p = 0.02, R2 = 0.23).
Conclusions
Acute rejection related lesions are more common and severe in the cortex, and the renal medulla does not sufficiently reflect cortical rejection. The positive and negative predictive values of medullary changes for allograft rejection are low, and medullary inflammation is not a reliable indicator of allograft rejection. Increased medullary fibrosis is correlated with chronic cortical damage.
Keywords: renal allograft, acute rejection, image analysis
Percutaneous needle biopsy of the transplanted kidney is still the gold standard technique for the accurate diagnosis of acute renal allograft rejection, although various other methods such as magnetic resonance imaging, urine cytology, and fine needle aspiration cytology have been introduced to monitor allografts.1,2,3,4
The diagnosis of acute renal allograft rejection relies on the evaluation of a reasonable sample of cortex, which is defined as a biopsy with at least seven glomeruli and one artery by the Banff classification of renal allograft biopsies.5 However, on occasion renal pathologists encounter with a biopsy containing mostly medulla and only a small piece of cortical tissue or solely renal medulla. Unfortunately, the patterns of acute or chronic immunological injury in the renal medulla have not been well studied, and only two studies have investigated the renal medulla histologically in renal allograft biopsies.6,7 Wang et al7 have suggested that rejection grades are similar in cortex and medulla, and medullary changes have a high specificity (100%) and a low sensitivity (77%) for cortical rejection. In contrast to these results, Bonsib et al6 found that most rejection reactions took place in the cortex, the medulla being devoid of any sign of rejection in eight of 19 allograft biopsies with acute cellular rejection.
This retrospective study was designed to explore whether medullary changes can predict acute renal allograft rejection or chronic graft damage. Semiquantitative lesion scoring according to the Banff criteria and quantitative measurements using computer assisted image analysis were undertaken to compare the medullary and cortical changes in kidney transplants with impaired renal function.
Methods
Patients
The study group comprised 40 male patients (70%) and 17 female (30%). Their mean (SD) age was 33.2 (12.2) years (range 9 to 58). The period following renal transplantation until biopsy ranged from 10 days to 121 months (median 4 months). The biopsies were done for impaired renal function. The median serum creatinine at the time of biopsy was 185.6 (70.7) μmol/dl (range 123.8 to 486.2). The patients were receiving prednisolone, ciclosporine A, azathioprine, or mycophenolate mofetil at the time of biopsy procedure and were treated by pulse steroid or antilymphocyte globulin if acute rejection was identified or ciclosporine A dose was decreased for cases with signs of toxicity.
Renal allograft biopsies
Seventy five non‐protocol post‐transplant biopsies from 57 renal allograft recipients were included in the study. All but two biopsies were adequate for interpretation according to the criteria set up by the Banff classification5 that the biopsy should contain at least seven glomeruli and one artery. All samples were routinely processed for paraffin embedding and sectioned at 3 μm thickness. The biopsies were evaluated by at least three haematoxylin and eosin, one periodic acid Schiff, one periodic acid‐methenamine silver (PAMS), and one Masson trichrome (MT) stained sections and were scored according to the Banff classification of renal allograft biopsies.5
Of the 75 biopsies, 23 (30.7%) contained both cortex and medulla, and medullary tissues were reviewed for rejection related lesions except intimal arteritis. Interstitial inflammation and tubulitis in the medulla were scored according to the Banff guidelines.5 Interstitial oedema was also noted. Chronic medullary changes, such as tubular atrophy (ct) and interstitial fibrosis were evaluated. Atrophy in medullary tubules was defined as tubules with thickened basement membranes and was scored semiquantitatively as in the Banff criteria.5
Image analysis
Chronic cortical damage was determined quantitatively by computerised digital histochemistry image analysis, depending on PAMS staining as described previously.8 In addition, interstitial fibrosis in medullary tissues was measured by image analysis on MT staining, which is described in details in the following section. Medullary and cortical changes were compared statistically.
Digital images were obtained from PAMS and MT stained renal allograft biopsies using a 3CCD colour video camera (Olympus DP70), connected to a light microscope (Olympus BX51) at an original magnification of ×40. Images were processed with Mediscope Image Analysis Software (Mediscope, Dokuz Eylul University, Clinical Engineering Department, Izmir, Turkey), modified from that described previously.8,9,10,11 In each case, 20 high power field images (total area, 317 560 μm2)—10 from cortical areas and 10 from medullary areas—were selected and acquisition and digitalisation undertaken.
The measurement of renal scarring in cortex was done with PAMS staining, which reflects all renal compartments. Quantification with PAMS in medullary tissue was not applicable because of an unreliable uniform dark brown staining in almost all areas. Thus MT staining was preferred for measuring interstitial fibrosis in medullary areas. To standardise the analysis and compare similar areas in different cases, we selected areas of medulla that followed a route from the outer to the inner zones. While medullary tissues in biopsies were generally scanty, the captured images represented nearly the entire medullary tissue.
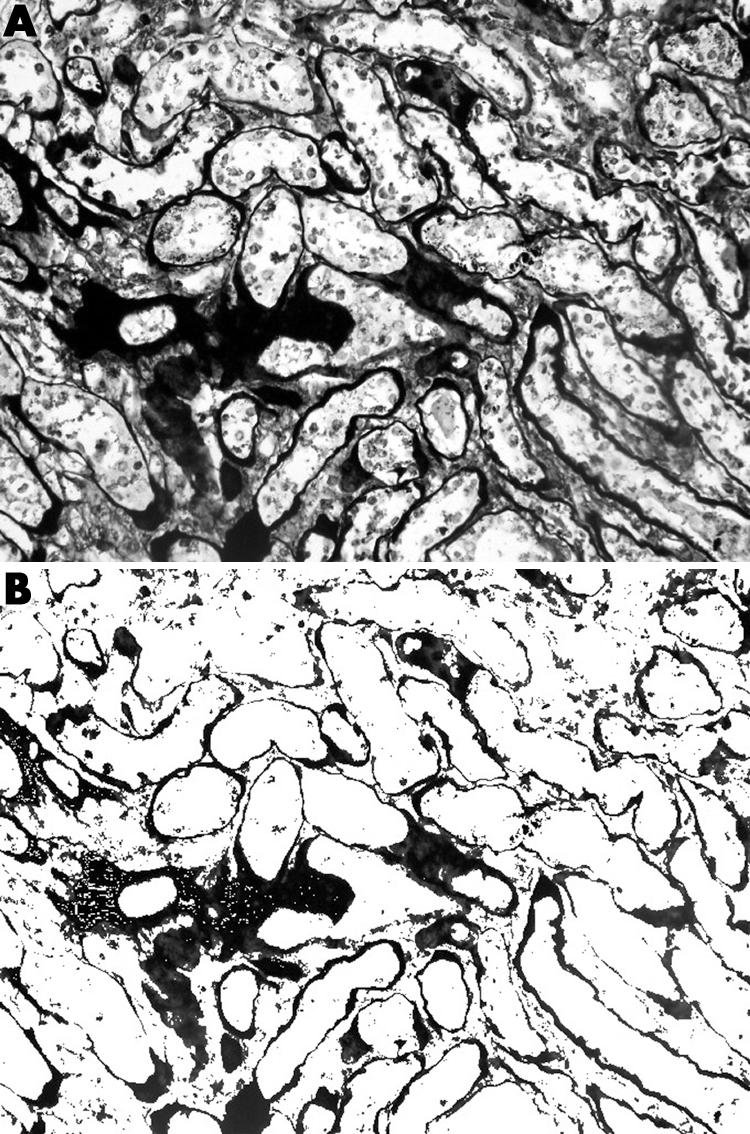
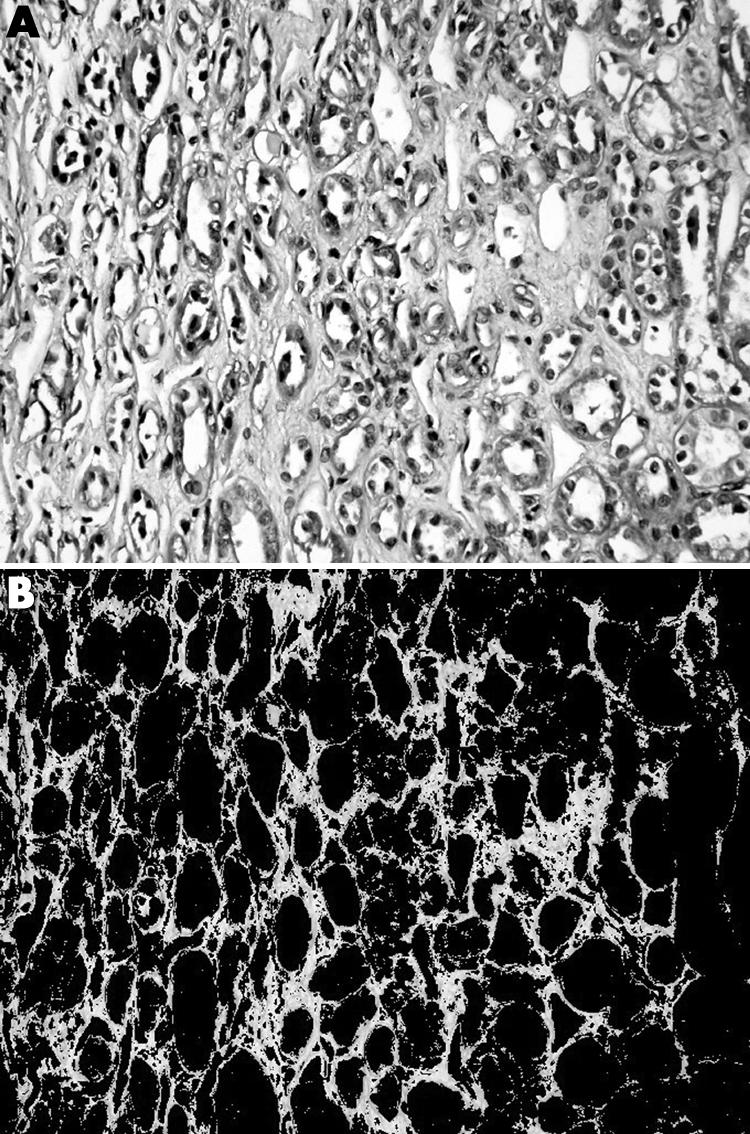
For each captured area, the percentage of area stained with a selected colour was determined semiautomatically. First the area stained green for MT and black‐dark brown for PAMS were selected by the pathologist on visual observation by multiple clicking on the image. Subsequently, the system selected the areas with the same configuration of staining, converted into pixel density units, and presented the area of selection as a percentage within each field, including any structural component, glomeruli, tubules, interstitium, or vascular structures for PAMS measurement, and only interstitium for MT measurement (figs 1 and 2). To allow the pathologist to repeat the procedure until optimum selection was achieved, each selected view could be examined. A mean of 10 fields was analysed and called “stained area percentage” (SAP) for the cortical and medullary tissue.

Figure 1 Periodic acid‐methenamine silver (PAMS) stained section of a renal allograft biopsy showing the scarred regions in cortex (A) before and (B) after the selection for image analysis measurement of the black‐brown stained area.

Figure 2 Masson trichrome stained section of a renal allograft biopsy demonstrating interstitial fibrosis (A) before and (B) after the selection for image analysis measurement of the green stained area.
Reproducibility and reliability analyses have previously shown that the measurement of SAP by computer assisted image analysis is a highly reliable method (intraclass correlation coefficient = 0.98).9
Statistical analysis
Data analyses were undertaken using SPSS 11.0 (Chicago, Illinois, USA). The Mann–Whitney U test was used to compare differences between groups. The relations between variables were investigated using Pearson's rank correlation and linear regression analysis. The level of significance was set at p<0.05. All values are given as mean (SD) unless noted otherwise.
Results
Of the 75 biopsies, 23 (30.7%) contained both cortex and medulla. The Banff scores—mean PAMS‐SAP in cortex, and MT‐SAP in medulla—are summarised in table 1. Of the 23 biopsies, seven (30.4%) had acute renal allograft rejection (allograft rejection), 12 (52.2%) had borderline changes, five (21.7%) had chronic allograft nephropathy, and seven (31.8%) had calcineurin inhibitor toxicity.
Table 1 Comparison of acute and chronic changes in 23 renal allograft biopsies containing both cortex and medulla.
| Change* | Cortex (n = 23) | Medulla (n = 23) | p Value |
|---|---|---|---|
| I | 1.0 (0.5) | 0.4 (0.5) | <0.001† |
| T | 1.2 (0.7) | 0.2 (0.5) | <0.001† |
| V | 0.26 (0.6) | – | |
| G | 0.3 (0.5) | – | |
| CT | 1.17 (0.7) | 0.48 (0.7) | 0.002† |
| CI | 1.17 (0.7) | – | |
| CV | 0.78 (0.8) | – | |
| AH | 0.55 (0.9) | – | |
| CG | 0.2 (0.5) | – | |
| SAP | 12.7 (5.9) (PAMS) | 19.2 (10.6) (MT) | 0.02‡ |
Values are mean (SD).
*Based on the Banff classification for renal allograft pathology.5
†Mann–Whitney U test.
‡Linear regression test.
AH, arteriolar hyaline thickening; CG, allograft glomerulopathy; CI, interstitial fibrosis; CT, tubular atrophy; CV, vascular fibrous intimal thickening; G, glomerulitis; I, interstitial inflammation; SAP, stained area percentage obtained by computed image analysis using PAMS (periodic acid‐methenamine silver) or MT (Masson trichrome staining); T, tubulitis; V, vasculitis.
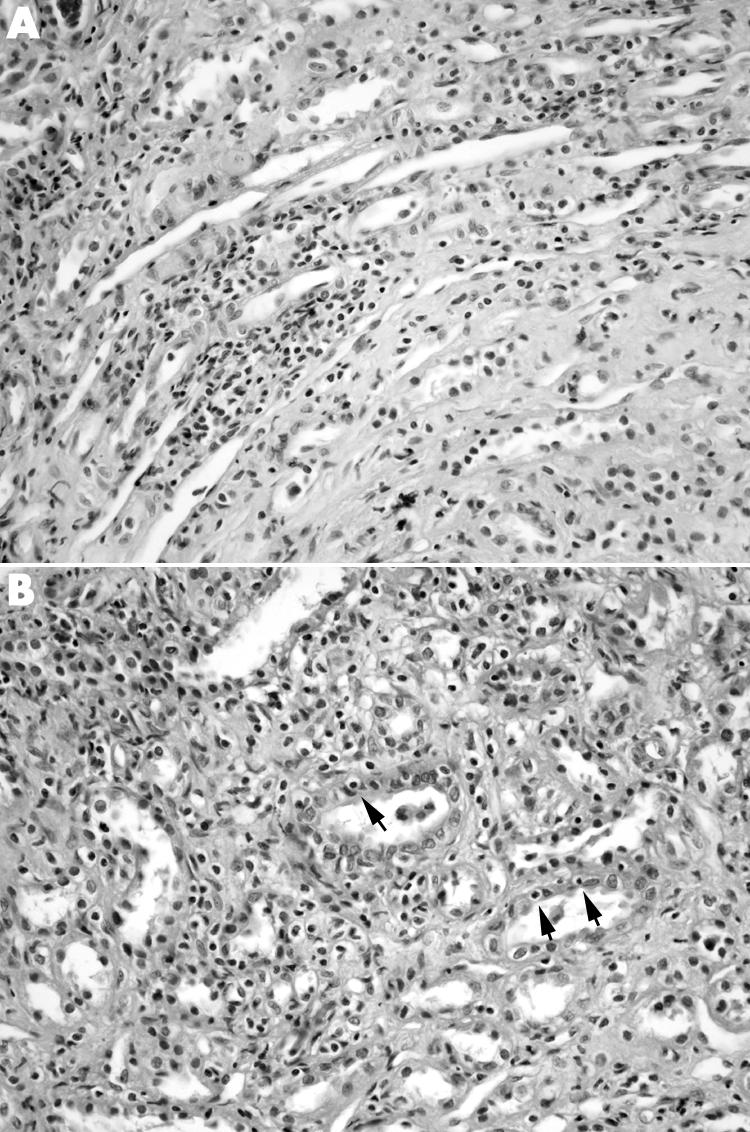
Acute medullary lesions were as follows: eight biopsies (34.7%) showed mild to moderate interstitial mononuclear cell infiltration (fig 3A), five (21.7%) showed interstitial oedema, and four (17.3%) showed focal tubulitis (fig 3B) (three mild and one moderate). The interstitial inflammation and tubulitis were more common and severe in cortex than in medulla (p<0.001). Medullary tubulitis was significantly associated with intimal arteritis (p = 0.003, r = 0.598). However, no significant association was found between medullary tubulitis scores and other acute cortical lesions such as glomerulitis, cortical tubulitis, and interstitial inflammation (p>0.05). Similarly, no significant correlation was found between cortical acute Banff scores and medullary intersititial inflammation and oedema (p>0.05).

Figure 3 (A) Interstitial mononuclear cell infiltration and (B) tubulitis (arrows) in the renal medulla from a renal allograft recipient with cortical borderline changes. (Haematoxylin and eosin, original magnification ×400.)
The biopsies with medullary interstitial inflammation (n = 8) and tubulitis (n = 4) were associated with either cortical borderline changes or allograft rejection. Of the eight biopsies with medullary intersititial inflammation, three (37.5%) had allograft rejection, and five (62.5%) had borderline changes in the cortex. Of four biopsies with medullary tubulitis, one had allograft rejection and three had borderline changes in the cortex. Sensitivity and specificity of renal medullary changes for acute renal allograft rejection in 23 biopsies containing both cortex and medulla are given in table 2. The sensitivity, specificity, and positive and negative predictive values of medullary interstitial inflammation and tubulitis in predicting cortical allograft rejection were 43%, 69%, 37%, and 73%, respectively. Medullary tubulitis alone had similar specificity (81%) and negative predictive value (68%), but had lower sensitivity (14%) and lower positive predictive value (25%) for cortical allograft rejection. However, if allograft rejection and borderline category are collapsed, medullary tubulitis and interstitial inflammation had 100% specificity and positive predictive value for cortical allograft rejection and borderline changes, but had lower sensitivity (21% and 42%, respectively) and lower negative predictive value (21% and 27%, respectively).
Table 2 Sensitivity and specificity of renal medullary changes for acute renal allograft rejection in 23 biopsies containing both cortex and medulla.
| Cortex (n = 23) | Medulla (n = 23) | |
|---|---|---|
| Tubulitis | Interstitial inflammation | |
| Acute rejection (n = 7) | 0.3 (0.7) | 0.43 (0.53) |
| Borderline changes (n = 12) | 0.25 (0.45) | 0.5 (0.67) |
| No evidence of rejection (n = 4) | 0 | 0 |
| Tubulitis in medulla | Interstitial inflammation in medulla | |
|---|---|---|
| Sensitivity | 14% | 43% |
| Specificity | 81% | 69% |
| Positive predictive value | 25% | 37% |
| Negative predictive value | 68% | 73% |
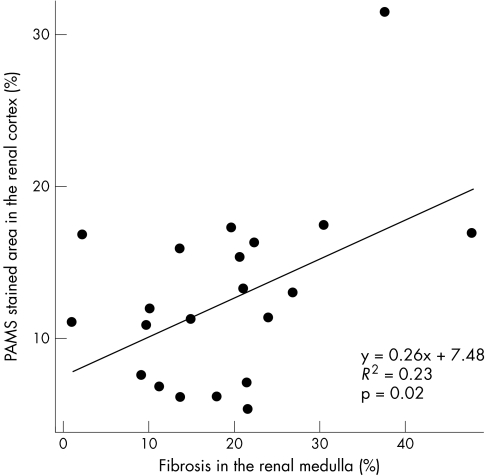
Of the 23 biopsies, eight (34.7%) showed mild to moderate tubular atrophy in the medulla. Not surprisingly, cortical tubular atrophy was significantly greater than medullary tubular atrophy (p = 0.002). In 23 cases containing both cortex and medulla, the mean PAMS‐SAP in the cortex was 12.7 (5.9) (range 4.94 to 31.12), and the mean MT‐SAP in medullary areas was 19.2 (10.6) (range 1.43 to 47.58). There was a significant correlation between medullary MT‐SAP and cortical PAMS‐SAP values (p = 0.02, R2 = 0.23; fig 4). Cortical PAMS‐SAP was correlated with cortical tubulitis (p = 0.03, r = 0.451), interstitial inflammation (p = 0.02, r = 0.476), and the time between transplantation and biopsy (p = 0.003, r = 0.599). Medullary MT‐SAP values were not correlated with cortical Banff scores or the time from transplantation to biopsy (p>0.05). In addition, no significant association was found between serum creatinine at time of biopsy and cortical PAMS‐SAP or MT‐SAP values (p>0.05), which was not surprising as the majority of cases had impaired renal function (serum creatinine at time of biopsy, 194.5 (61.9) μmol/l).
Figure 4 The relation between periodic acid‐methenamine silver (PAMS) stained area percentage in the renal cortex and Masson trichrome stained area percentage in the renal medulla. The increase in the severity of medullary fibrosis was significantly correlated to cortical scarring.
Discussion
The present study shows that medullary inflammatory changes accompany either cortical acute rejection or at least cortical borderline changes, and none of the biopsies with a medullary infiltrate had normal corresponding cortical tissue, which justifies the statement that medullary inflammatory lesions provide evidence for acute renal allograft rejection. On the other hand, the absence of rejection related changes in the medulla does not rule out allograft rejection, which limits the diagnostic value of renal medulla for allograft rejection, and necessitates repeating the biopsy procedure to obtain adequate cortical tissue.
The intensity of rejection infiltrate and tubulitis is greater in the cortex, which could be related to anatomical, metabolic, or antigenic differences between the renal cortex and the renal medulla. It is known that in acute rejection, class II MHC antigens are induced in different parts of the nephron including the proximal and distal tubules, as well as in the collecting ducts.12,13 Additionally, both proximal and distal tubules can be induced to express adhesion molecules for inflammatory cells such as intercellular adhesion molecule‐1 during rejection.14 The proximal tubular cells have been suggested as the main targets for lymphocyte invasion owing to their ability to function as antigen presenting cells and to the relative length of the proximal segments.15,16 In contrast to these considerations, morphometric ultrastructural studies have shown that the distal tubules and cortical collecting ducts are the most common sites of tubulitis.17,18 There are no data comparing the quantitative characteristics of cortical and medullary tubulitis. Wang et al7 have reported that semiquantitative intensities of rejection related lesions are similar in cortex and medulla. This is in contrast to our results that cortical tubulitis and interstitial inflammation are more common and intense than in medulla, which is similar to the gradient of rejection intensity reported by Bonsib et al.6 However, these results do not explain the mechanisms operating the different histological manifestations of rejection in medulla and cortex, and it would be interesting to learn whether expression patterns of HLA class II antigens or adhesion molecules are different in cortical and medullary tubules and vascular endothelium.
The renal medulla has not been well studied in many forms renal disease including allograft biopsies. In the current study, we measured the chronic graft damage in both medulla and cortex in renal transplant biopsies on the basis of quantitative MT and PAMS histochemistry. PAMS staining includes thickened basement membranes of atrophic tubules, sclerosed glomeruli, and glomeruli with double contours, arteries with intimal thickening and increased layers of lamina elastica, and also interstitial fibrotic areas probably containing remnants of atrophic tubular basement membranes. We have previously shown that quantification with PAMS by image analysis in transplant biopsies with chronic allograft nephropathy reflects the renal scarring in more than one compartment and correlates with renal function.8 In the current study, cortical quantitative PAMS values in renal transplants with impaired function are significantly correlated with the time from transplantation to biopsy and cortical tubulitis inflammation scores, and this correlation may reflect the burden of injury from immune or non‐immune mechanisms, including aging of the allograft. Herein, we also measured the medullary interstitium by image analysis, depending on quantification with MT staining, and found that medullary fibrosis develops in kidney transplants with impaired renal function and that it correlates with chronic cortical damage. However, no correlation could be found between medullary quantitative MT values and rejection related lesions, renal function, or time from transplantation to biopsy. At present, it is not clear whether the medullary fibrosis is secondary to the cortical scarring or medullary injury and inflammation induced by immune or non‐immune stresses which may deplete the ability of medullary tissue to repair and promote fibrosis.
In conclusion, rejection related changes in the renal medulla do not correlate with the severity of cortical rejection, and a normal medullary biopsy does not exclude acute renal allograft rejection. Given that the sensitivity and specificity of medullary inflammation for predicting cortical acute rejection are 43% and 69%, medullary inflammation is an unreliable indicator of acute renal allograft rejection and should not be used a diagnostic clinical tool.
Abbreviations
MT - Masson trichrome
PAMS - periodic acid‐methenamine silver
SAP - stained area percentage
References
- 1.Jennerholm S, Backman U, Bohman S O.et al Magnetic resonance imaging of the transplanted kidney. Correlation to function and histopathology. Acta Radiol 199031499–503. [PubMed] [Google Scholar]
- 2.Eggensperger D, Schweitzer S, Ferriol E.et al The utility of cytodiagnosis urinalysis for monitoring renal allograft injury. A clinicopathological analysis of 87 patients and over 1000 urine specimens. Am J Nephrol 1988827–34. [DOI] [PubMed] [Google Scholar]
- 3.Hammerer P, Arndt R, Kramer‐Hansen H.et al Consecutive selective aspiration cytology of renal cortex and renal medulla in kidney transplants. Transplant Proc 198820577–578. [PubMed] [Google Scholar]
- 4.Gupta R, Om A, Ghose T.et al Distinction between cortex and medulla in kidney transplant aspiration cytology and relevance to interpretation of results. Transplant Proc 1987191641–1643. [PubMed] [Google Scholar]
- 5.Racusen L C, Solez K, Colvin R B.et al The Banff 97 working classification of renal allograft pathology. Kidney Int 199955713–723. [DOI] [PubMed] [Google Scholar]
- 6.Bonsib S M, Reznicek M J, Wright F H. Renal medulla in the diagnosis of acute cellular rejection. Transplantation 198948690–692. [PubMed] [Google Scholar]
- 7.Wang H, Nanra R S, Carney S L.et al The renal medulla in acute renal allograft rejection: comparison with renal cortex. Nephrol Dial Transplant 1995101428–1431. [PubMed] [Google Scholar]
- 8.Sarioglu S, Celik A, Sakar M.et al Methenamine silver staining quantitative digital histochemistry in chronic allograft nephropathy. Transplant Proc 2004362991–2992. [DOI] [PubMed] [Google Scholar]
- 9.Sis B, Sarioglu S, Sokmen S.et al Desmoplasia measured by computer assisted image analysis: an independent prognostic marker in colorectal carcinoma. J Clin Pathol 20055832–38. [DOI] [PMC free article] [PubMed] [Google Scholar]
- 10.Demiral A N, Sarioglu S, Birlik B.et al Prognostic significance of EGF receptor expression in early glottic cancer. Auris Nasus Larynx 200431417–424. [DOI] [PubMed] [Google Scholar]
- 11.Kavukcu S, Soylu A, Turkmen M.et al Unilateral ureteroperitoneostomy in the management of hypoproteinemia in nephrotic rats with normal renal function. Tohoku J Exp Med 200320167–73. [DOI] [PubMed] [Google Scholar]
- 12.Hall B M, Bishop G A, Duggin G G.et al Increased expression of HLA_DR antigens on renal tubular cells in renal transplants: relevance to the rejection response. Lancet . 1984;ii247–251. [DOI] [PubMed]
- 13.Fuggle S V, McWhinnie D L, Morris P J. Precise specificity of induced tubular HLA‐class II antigens in renal allografts. Transplantation 198744214–220. [DOI] [PubMed] [Google Scholar]
- 14.Faull R J, Russ G R. Tubular expression of intercellular adhesion molecule‐1 during renal allograft rejection. Transplantation 198948226–230. [DOI] [PubMed] [Google Scholar]
- 15.Hagerty D T, Allen P M. Processing and presentation of self and foreign antigens by the renal proximal tubule. J Immunol 19921482324–2330. [PubMed] [Google Scholar]
- 16.Robert B. Colvin. Renal transplant pathology. In: Jennette JC, Olson JL, Schwartz MM, et al, editors, Heptinstall's pathology of the kidney. Philadelphia: Lippincott‐Raven 19981409–1540.
- 17.Ivanyi B, Hansen H E, Olsen S. Segmental localization and quantitative characteristics of tubulitis in kidney biopsies from patients undergoing acute rejection. Transplantation 199356581–585. [DOI] [PubMed] [Google Scholar]
- 18.Nadasdy T, Ormos J, Stiller D.et al Tubular ultrastructure in rejected human renal allografts. Ultrastruct Pathol 198812195–207. [DOI] [PubMed] [Google Scholar]


