Abstract
Aim
To investigate and compare topoisomerase II‐α expression in benign prostatic hyperplasia (BPH), prostate cancer of varying Gleason scores and hormone‐insensitive prostate cancer.
Methods
The immunohistochemical expression of topoisomerase II‐α antibody in the above‐mentioned diagnostic categories was investigated and compared.
Results
Increased expression of topoisomerase II‐α was seen in the prostate cancers of Gleason scores 7 and 8–10 (p = 0.000) compared with prostate cancers of Gleason score 6 and BPH (p = 0.245). Statistically significant differences were found in the topoisomerase II‐α gene expression between prostate cancers categorised by Gleason Score. Also, increased expression of topoisomerase II‐α was seen in the known hormone‐resistant prostate carcinomas compared with prostate cancers with no hormone treatment in the subgroup with Gleason scores 8–10, which approached statistical significance (p = 0.081). No statistically significant difference was observed in topoisomerase II‐α expression between the groups with BPH and prostate carcinoma of Gleason score 6 (p = 0.245).
Conclusion
Topoisomerase II‐α expression was found to increase with the known prognostic marker Gleason score and with hormone insensitivity. Objective evidence is provided for clinical trials with drugs targeting topoisomerase II‐α to be targeted to patients with prostate cancers of Gleason Score >6 and, in particular, prostate cancers of Gleason Scores 8–10.
Topoisomerase II‐α is an essential cellular enzyme that functions in the segregation of newly replicated chromosome pairs, in chromosome condensation and in altering DNA superhelicity. DNA topoisomerases participate in nearly all biological processes governing DNA and untangle intertwined DNA strands before cell division by transiently breaking and then re‐ligating duplex strands of DNA. Chemotherapeutic drugs that target topoisomerase II‐α, such as etoposide, doxorubicin and mitoxantrone, act by stabilising a normally transient DNA–topoisomerase II complex, thus increasing the concentration of double‐stranded DNA breaks. This phenomenon triggers mutagenic and cell death pathways.1,2 Topoisomerase II‐α has been reported as a prognostic marker in several tissues.3,4,5,6,7,8,9,10,11,12,13,14,15
Little information is available about the expression of topoisomerase II‐α in prostate carcinoma. To our knowledge, there are only two small studies16,17 in the literature that investigate topoisomerase II‐α expression in prostate cancer tissue. These studies do not investigate topoisomerase II‐α expression in hormone‐resistant prostate carcinoma. This is of interest as topoisomerase II‐α is the target of the drug etoposide, which is an active agent in the combined chemotherapy of hormone‐insensitive prostate carcinoma in clinical trials.18,19
In this study, we examine topoisomerase II‐α expression in benign prostatic hyperplasia (BPH) and prostate cancer tissue categorised by Gleason Score and by hormone sensitivity.
Methods
Patients and tumours
Our study included 100 patients with adenocarcinoma of the prostate and 42 patients with BPH. The adenocarcinoma cases included 59 patients who had undergone transurethral resection of the prostate and 41 who had undergone radical prostatectomy. The 42 patients with BPH had undergone transurethral resection of the prostate. These patients were diagnosed with BPH between 1999 and 2003, and were identified by performing a SNOMED code search of the Adelaide and Meath Hospital Incorporating the National Children's Hospital cellular pathology database. Formalin‐fixed blocks from these cases were retrieved from the files. Tissue microarrays were constructed as described previously.20 In all, samples from 138 cases were present in triplicate and included representative areas of tumour or glandular tissue from patients with BPH. Sufficient tissue from one patient with BPH was not represented on the tissue microarray and this case was excluded. In tissues from another two patients with BPH, abundant lymphocytic inflammation made it impossible to evaluate topoisomerase II‐α staining of epithelial cell nuclei because of positive staining of lymphocytes by the antibodies. These cores were excluded and the remaining two cores from both of these cases were used in the evaluation.
Histopathological reports which included clinical details were reviewed for all adenocarcinoma cases. We classified cases into four categories: BPH (n = 41); well‐differentiated prostate carcinoma of Gleason score 6 (n = 28); moderately differentiated prostate carcinoma of Gleason score 7 (n = 22); and poorly differentiated prostate carcinoma of Gleason scores 8–10 (n = 49). These were not selected for hormonal status. We also compared these poorly differentiated prostate carcinomas of Gleason scores 8–10 by dividing them according to hormonal status under the categories of hormone resistance after treatment (n = 15) and no hormone treatment (n = 34). The 15 cases categorised as hormone‐resistant after treatment were recurrent prostate adenocarcinomas present in patients who underwent transurethral resection of the prostate in whom clinical details indicated that the patient had received antiandrogen treatment. These carcinomas had Gleason scores of 8–10. The topoisomerase II‐α indices were compared between the categories using the Mann–Whitney U test.
Immunohistochemical staining
Immunohistochemical staining for topoisomerase II‐α was carried out by using a monoclonal anti‐topoisomerase II‐α antibody at a dilution of 1:300. Sections of 5 μm thickness were studied. Antigen retrieval was performed with dewaxed sections by using a pressure cooker and the Trilogy system for 10 min. A standard avidin–biotin–peroxidase complex technique (Dako Glostrup, Denmark) was used for visualisation with diaminobenzidine as a chromogen. Sections were counterstained with haematoxylin and mounted. Tonsil samples from our routine files were used as positive controls for topoisomerase II‐α.
Evaluation of immunohistochemistry
Immunohistochemical staining was evaluated by light microscopy using a ×40 objective and a Miller ocular. The Miller ocular gave a square field, in the corner of which was a smaller ruled square, one ninth the area of the total square. Nuclei with strong homogeneous topoisomerase II‐α staining were counted in the large square and the total number of nuclei with both positive and negative staining was counted in the small square. The number of cells in the small square was multiplied by nine to obtain the total number of cells in the large square. A mean of 240.5 epithelial cells was obtained in the prostate cancer cases and a mean of 88 epithelial cells in the cases of BPH. Five non‐overlapping square fields were counted for each tissue core, three on the y axis and two on the x axis. The percentage of positively staining nuclei within the five large squares was calculated for each core. An average result was obtained from three cores in cases with tissue microarrays in triplicate and from two cores in cases with tissue microarrays in duplicate. This served as the topoisomerase II‐α index for the case. This method was used in previous studies in the evaluation of immunohistochemical results in tissue microarrays.4,21
In addition, each topoisomerase II‐α index was obtained by image analysis that used the Ariol system for tissue microarrays. An acceptable level of concordance was taken as within +10% or −10% of the topoisomerase II‐α index obtained with the Miller ocular.
Of the 140 cases in total (138 in triplicate and 2 in duplicate), 14 (10%) cases showed discordance between the topoisomerase II‐α indices from the Ariol image analyser and the Miller ocular. In all cases the Ariol image analyser overestimated topoisomerase II‐α indices compared with the Miller ocular method.
A second observer reviewed these discordant cases. This discordant group had one case of Gleason score 7, two cases of Gleason score 8, nine of Gleason score 9 and two of Gleason score 10. These 14 cases tended to have higher topoisomerase indices (mean topoisomerase II‐α index 13%) when using the Miller ocular than the average topoisomerase index for all 99 carcinoma cases analysed (mean topoisomerase II‐α index 3.69%).
A review of these discordant cases by a second observer, using light microscopy and a Miller ocular, correlated within 10% of the original topoisomerase indices obtained by the first observer. The discrepancy between the results from the Ariol image analyser and light microscopy was due to difficulty in distinguishing topoisomerase‐negative tumour cells from stroma by using the image analyser when there was infiltration of the stroma by a less differentiated tumour. The image analyser therefore underestimated the total number of tumour cells within a field of analysis, leading to an overestimation of the percentage of cells positive for the topoisomerase II‐α antibody.
Statistics
Data were entered on to a computerised database and analysed with the SPSS statistical package and the Mann–Whitney U test.
Analysis of immunohistochemical results
The Mann–Whitney U test was used to determine whether there was a significant difference between the topoisomerase II‐α indices in each group.
Results
Immunohistochemical staining
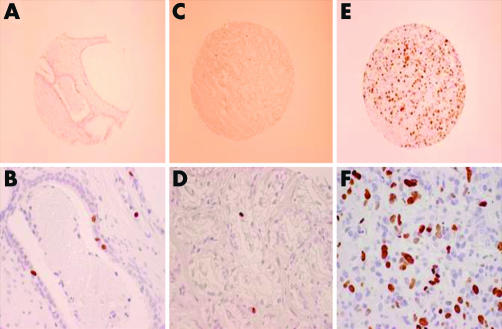
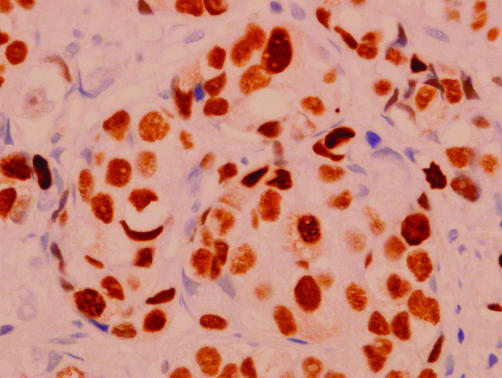
Figures 1 and 2 show the results of immunohistochemical staining.
Figure 1 Immunohistochemical staining for topoisomerase II‐α (TOPO II‐α). (A) Low‐power view of the tissue microarray (TMA) showing TOPO II‐α focal positivity in benign prostatic hyperplasia (BPH). (B) High‐power view of a benign prostatic gland showing focal TOPO II‐α nuclear positivity. (C) Low‐power view of TMA of a prostatic adenocarcinoma (Gleason Score 3+3) showing focal cell positivity for TOPO II‐α. (D) High‐power view of prostatic adenocarcinoma (Gleason Score 3+3) showing focal discrete nuclear TOPO II‐α positivity in prostatic acini. (E) Low‐power view of TMA of prostatic adenocarcinoma (Gleason Score 9) showing multiple cells positive for TOPO II‐α. (F) High‐power view of prostatic adenocarcinoma (Gleason Score 9), showing discrete nuclear TOPO II‐α positivity in many tumour cells within the lesion.
Figure 2 Immunohistochemical staining for topoisomerase II‐α (TOPO II‐α) in a high‐power view of a hormone‐insensitive prostatic adenocarcinoma (Gleason Score 9) showing discrete nuclear TOPO II‐α positivity in many tumour cells within the lesion.
Statistical analysis
Table 1 shows the median and range of topoisomerase II‐α indices for each Gleason score. Tables 2 and 3 show median and range for the categories statistically analysed.
Table 1 Median and range of topoisomerase indices according to Gleason Score.
| Gleason Score 6 | Gleason Score 7 | Gleason Score 8 | Gleason Score 9 | Gleason Score 10 | |
|---|---|---|---|---|---|
| Number of cases | 28 | 22 | 12 | 29 | 8 |
| Median | 0.3 | 0.9 | 1.65 | 2.6 | 12.55 |
| Range | 0–3.6 | 0–5.9 | 0.3–8.8 | 0–54.8 | 0.7–48.6 |
Table 2 Median and range of topoisomerase indices according to categories analysed.
| Benign prostatic hyperplasia | Gleason Score 6 | Gleason Score 7 | Gleason Scores 8–10 | |
|---|---|---|---|---|
| Number of cases | 41 | 28 | 22 | 49 |
| Median | 0 | 0.7 | 0.9 | 15.1 |
| Range | 0–3.3 | 0–3.6 | 0–5.9 | 0–48.6 |
Table 3 Median and range of topoisomerase indices according to categories analysed.
| Gleason Scores 8–10, hormone resistant, post‐hormone deprivation | Gleason Scores 8–10, no hormone treatment | |
|---|---|---|
| Number of cases | 15 | 34 |
| Median | 5.5 | 2.2 |
| Range | 0–48.6 | 0.3–36.3 |
We found no significant difference between the groups with BPH and with prostate carcinoma of Gleason score 6 (p = 0.245). The difference between the groups with prostate carcinoma of Gleason scores 6 and 7 was significant (p<0.008). In addition, the groups with prostate carcinoma of Gleason score 7 and Gleason scores 8–10 (not selected for hormonal status) differed significantly (p = 0).
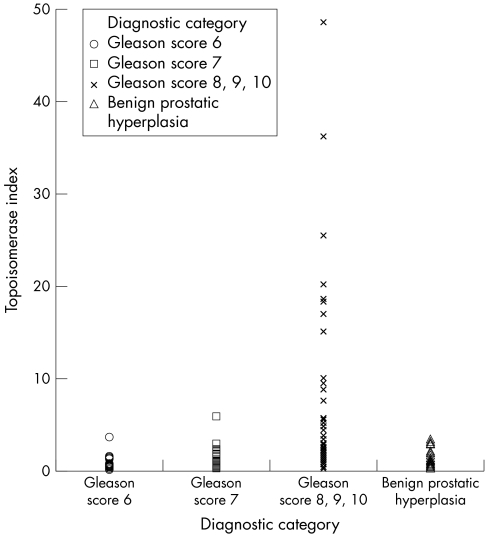
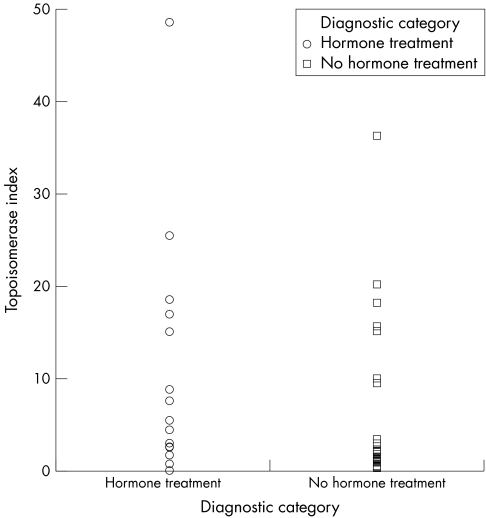
When the category of cases with Gleason Scores 8–10 was analysed with regard to hormone treatment and insensitivity (n = 15) and cases with no hormone treatment (n = 34), the difference in topoisomerase indices approached significance (p = 0.081). Table 4 shows the results of analysis by the Mann–Whitney U test. Figures 3 and 4 show scatter plots generated from the data.
Table 4 Statistical analysis of topoisomerase II‐α indices.
| Categories analysed for significance between topoisomerase II‐α indices | Z test statistic | p Value |
|---|---|---|
| Benign prostatic hyperplasia and prostate carcinoma of Gleason Score 6 | −1.163 | 0.245 |
| Prostate carcinoma of Gleason Score 6 and prostate carcinoma of Gleason Score 7 | −2.636 | 0.008 |
| Prostate carcinoma of Gleason Score 7 and prostate carcinoma of Gleason Scores 8–10 | −3.601 | 0.000 |
| Hormone‐resistant prostate carcinoma of Gleason Scores 8–10 and prostate carcinoma with Gleason Scores 8–10 with no hormone treatment | −1.747 | 0.081 |
Figure 3 Scatterplot for topoisomerase II‐α indices as determined by diagnostic category.
Figure 4 Scatter plot for topoisomerase II‐α indices comparing the group with hormone‐resistant prostate cancer and the group with prostate cancer with no hormone treatment.
Discussion
Little information is available on the expression of topoisomerase II‐α in prostate carcinoma tissue or, in particular, in identifying whether its expression is increased in comparison with BPH. To our knowledge, only two papers in the literature investigated topoisomerase II‐α expression in prostate carcinoma tissue16,17 and one paper attempted to compare topoisomerase II‐α expression in prostate cancer and BPH.17 That study, which investigated only 10 cases, reported little expression of topoisomerase II‐α in BPH. In contrast with this study, we identified topoisomerase II‐α expression in BPH (range 0–3.3). In addition, our study showed no statistically significant difference in topoisomerase II‐α expression between prostate carcinoma of Gleason Score 6 and BPH.
The previous two studies conclude that topoisomerase II‐α expression correlates with Gleason score, which is supported also by our larger study. We also identified a statistically significant difference in topoisomerase II‐α expression between prostate cancers classified with respect to Gleason score.
To our knowledge, our study is the first of its kind that examined topoisomerase II‐α expression in hormone‐resistant prostate carcinoma. This is of particular interest as topoisomerase II‐α is the target of the drug etoposide, which is an active agent in the combined chemotherapy of hormone‐insensitive prostate carcinoma in clinical trials. We identified increased topoisomerase II‐α expression in the hormone‐resistant prostate carcinomas compared with prostate carcinomas with no hormone treatment, which approached statistical significance. The number of cases of hormone‐resistant prostate cancer of Gleason scores 8–10 was limited (n = 15) compared with that of prostate carcinoma of Gleason scores 8–10 with no hormone treatment (n = 34). Further studies with increased statistical power and increased numbers of hormone‐resistant prostate carcinoma are required to show conclusively that this hormone‐resistant subgroup of prostate carcinoma shows increased topoisomerase II‐α expression compared with prostate carcinoma with no hormone treatment. The importance of this finding would be in providing clinicopathological correlation for the fact that this clinical subgroup of hormone‐resistant prostate carcinomas has shown the best response to the drug etoposide that targets the topoisomerase II‐α gene.18,19
Our study showed with statistical significance that higher topoisomerase II‐α immunoexpression was associated with poorly differentiated prostate carcinomas (Gleason scores 8–10) compared with moderately differentiated prostate carcinoma (Gleason score 7), and between moderately differentiated prostate carcinoma (Gleason score 7) and well‐differentiated prostate carcinoma (Gleason score 6).
Several studies have correlated the level of topoisomerase II‐α expression with a response to anti‐topoisomerase II‐α drugs in cancer cell lines.22,23,24
As treatment options for advanced prostate carcinoma are limited, and advanced prostate carcinomas are more likely to be of higher Gleason score, it is important to attempt to identify potential targets for chemotherapy agents in this patient group.
In conclusion, we believe that the topoisomerase II‐α gene is a potential target for chemotherapy in this group of patients, particularly in patients with prostate carcinomas of Gleason scores 8–10.
Take‐home messages
Topoisomerase II‐α is an essential cellular enzyme that functions in the segregation of newly replicated chromosome pairs, in chromosome condensation and in changing superhelicity of the DNA.
The topoisomerase II‐α gene is expressed in benign prostatic hyperplasia (BPH) and no statistically significant difference was found between its expression in BPH and prostate carcinoma with Gleason Score 6.
Topoisomerase II‐α gene expression increases with increasing Gleason Score and with hormone insensitivity.
These findings have potential clinical relevance in advanced prostate cancer as the chemotherapeutic agent etoposide targets the topoisomerase II‐α gene.
Abbreviations
BPH - benign prostatic hyperplasia
References
- 1.Meresse P, Dechaux E, Monneret C.et al Etoposide: discovery and medicinal chemistry. Curr Med Chem 2004182443–2466. [DOI] [PubMed] [Google Scholar]
- 2.Chowdhury A R, Majumder H K. DNA topoisomerases in life and death: implications in kinetoplastid protozoa. Curr Mol Med 20046711–722. [DOI] [PubMed] [Google Scholar]
- 3.Bildrici K, Tel N, Ozalp S S.et al Prognostic significance of DNA topoisomerase II‐alpha (Ki‐S1) immunoexpression in endometrial carcinoma. Eur J Gynaecol Oncol 20026540–544. [PubMed] [Google Scholar]
- 4.Callagy G, Pharoah P, Chin S F.et al Identification and validation of prognostic markers in breast cancer with the complementary use of array‐CGH and tissue microarrays. J Pathol 20053388–396. [DOI] [PubMed] [Google Scholar]
- 5.Brustmann H. Vascular endothelial growth factor expression in serous ovarian carcinoma: relationship with topoisomerase II alpha and prognosis. Gynecol Oncol 2004116–22. [DOI] [PubMed] [Google Scholar]
- 6.Schrader C, Meusers P, Brittinger G.et al Topoisomerase II alpha expression in mantle cell lymphoma: a marker of cell proliferation and a prognostic factor for clinical outcome. Leukemia 200471200–1206. [DOI] [PubMed] [Google Scholar]
- 7.Grandgirard N, Ly‐Sunnaram B, Ferrant D.et al Impact of topoisomerase II alpha and spermine on the clinical outcome of children with acute lymphoblastic leukemia. Leuk Res 20045479–486. [DOI] [PubMed] [Google Scholar]
- 8.Diaz‐Rubio J L, Duarte‐Rojo A, Saqui‐Salces M.et al Cellular proliferative fraction measured with topoisomerase II‐alpha predicts malignancy in endocrine pancreatic tumors. Arch Pathol Lab Med 20044426–429. [DOI] [PubMed] [Google Scholar]
- 9.Mano M S, Awada A, Di Leo A.et al Rates of topoisomerase II‐alpha and HER‐2 gene amplification and expression in epithelial ovarian carcinoma. Gynecol Oncol 20043887–895. [DOI] [PubMed] [Google Scholar]
- 10.MacGrogan G, Rudolph P, Mascarel Id.et al DNA topoisomerase II‐alpha expression and the response to primary chemotherapy in breast cancer. Br J Cancer 20034666–671. [DOI] [PMC free article] [PubMed] [Google Scholar]
- 11.Ho D M, Hsu C Y, Ting L T.et al MIB‐1 and DNA topoisomerase II alpha could be helpful for predicting long‐term survival of patients with glioblastoma. Am J Clin Pathol 20035715–722. [DOI] [PubMed] [Google Scholar]
- 12.Oda Y, Ohishi Y, Saito T.et al Nuclear expression of Y‐box‐binding protein‐1 correlates with P‐glycoprotein and topoisomerase II alpha expression, and with poor prognosis in synovial sarcoma. J Pathol 20032251–258. [DOI] [PubMed] [Google Scholar]
- 13.Vidal S, Kovacs K, Horvath E.et al Topoisomerase II alpha expression in pituitary adenomas and carcinomas: relationship to tumor behavior. Mod Pathol 2002111205–1212. [DOI] [PubMed] [Google Scholar]
- 14.Watanuki A, Ohwada S, Fukusato T.et al Prognostic significance of DNA topoisomerase II‐alpha expression in human hepatocellular carcinoma. Anticancer Res 2002221113–1119. [PubMed] [Google Scholar]
- 15.Korshunov A, Shishkina L, Golanov A. DNA topoisomerase II‐alpha and cyclin A immunoexpression in meningiomas and its prognostic significance: an analysis of 263 cases. Arch Pathol Lab Med 200291079–1086. [DOI] [PubMed] [Google Scholar]
- 16.Sullivan G F, Amenta P S, Villanueva J D.et al The expression of drug resistance gene products during the progression of human prostate cancer. Clin Cancer Res 199861393–1403. [PubMed] [Google Scholar]
- 17.Willman J H, Holden J A. Immunohistochemical staining for DNA topoisomerase II‐alpha in benign, premalignant, and malignant lesions of the prostate. Prostate 20004280–286. [DOI] [PubMed] [Google Scholar]
- 18.Pienta K J, Redman B, Hussain M.et al Phase II evaluation of oral estramustine and oral etoposide in hormone‐refractory adenocarcinoma of the prostate. J Clin Oncol 1994102005–2012. [DOI] [PubMed] [Google Scholar]
- 19.Dimopoulos M A, Panopoulos C, Bamia C.et al Oral estramustine and oral etoposide for hormone‐refractory prostate cancer. Urology 19975754–758. [DOI] [PubMed] [Google Scholar]
- 20.Kononen J, Bubendorf L, Maria Tinner E.et al Tissue profiling for high‐throughput molecular profiling of tumor specimens. Nat Med 19984844–847. [DOI] [PubMed] [Google Scholar]
- 21.Hoos A, Urist M J, Stojadinovic A.et al Validation of tissue microarrays for immunohistochemical profiling of cancer specimens using the example of human fibroblastic tumors. Am J Pathol 200141245–1251. [DOI] [PMC free article] [PubMed] [Google Scholar]
- 22.Binaschi M, Capranico G, De Isabella P.et al Comparison of DNA cleavage induced by etoposide and doxorubicin in two human small‐cell lung cancer lines with different sensitivities to topoisomerase II inhibitors. Int J Cancer 19902347–352. [DOI] [PubMed] [Google Scholar]
- 23.Giaccone G, Gazdar A F, Beck H.et al Multidrug sensitivity phenotype of human lung cancer cells associated with topoisomerase II expression. Cancer Res 199271666–1674. [PubMed] [Google Scholar]
- 24.Van der Zee A, Hollema H, de Jong S.et al P‐glycoprotein expression and DNA topoisomerase I and II activity in benign tumours of the ovary and in malignant tumours of the ovary, before and after platinum/cyclophosphamide chemotherapy. Cancer Res 1991515915–5920. [PubMed] [Google Scholar]


