Abstract
Background
An investigation on copper metabolism usually includes the measurement of serum levels of copper and caeruloplasmin. Using these levels, some laboratories derive levels of non‐caeruloplasmin‐bound copper (NCC); however, a considerable number of patients may show negative values, which is not physiologically possible.
Aim
To derive an equation for adjusted copper in a manner similar to that widely accepted for adjusted calcium.
Methods
A linear regression equation for the relationship between caeruloplasmin and copper was used: [copper] (μmol/l) = 0.052×[caeruloplasmin] (mg/l). An equation for copper adjusted for caeruloplasmin was derived using this equation and the reference interval of 10–25 μmol/l for copper.
Results
The derived equation was [adjusted copper] (μmol/l) = [total copper] (μmol/l)+0.052×[caeruloplasmin] (mg/l)+17.5 (μmol/l). The adjusted copper concentrations on the 2.5th and 97.5th centiles were 12.7 and 21.5 μmol/l, respectively, with the population having a gaussian distribution. The relationship between NCC and the adjusted copper concentrations is linear and independent of caeruloplasmin concentration.
Conclusion
Calculation of copper adjusted for caeruloplasmin uses the same variables as those for NCC. Accordingly, the problems that are caused by the lack of specificity of caeruloplasmin immunoassays are the same as those identified for NCC. This calculation, however, overcomes the negative values that are found in a considerable minority of patients with NCC, as well as age and sex differences in the caeruloplasmin reference interval. As the concept is already familiar to non‐laboratory healthcare professionals in the form of calcium adjusted for albumin, this method is potentially less confusing than that for NCC.
Researchers carrying out studies on copper are often requested to investigate the potential for excess or deficiency states of copper. Primary copper excess or Wilson's disease is an autosomal recessive condition1,2 that results in copper deposition in the hepatic parenchymal cells, the brain, the periphery of the iris and the kidney. In the absence of obvious neurological changes or Kayser–Fleisher rings, the diagnosis of Wilson's disease can be a challenge.3,4 Secondary copper excess is also possible, especially in people in the developing countries. Primary copper deficiency presenting in childhood is often caused by Menke's disease, an inherited defect in copper absorption, and has a poor prognosis.5 Primary copper deficiency can also occur in adults as a neurological condition mimicking the extrapyramidal signs of Wilson's disease.6 Secondary or acquired copper deficiency is reported in patients who are supported with long‐term enteral nutrition7 and with overuse of zinc supplementation.8 Investigators are often requested to diagnose copper deficiency because early recognition and copper supplementation can prevent neurological deterioration.9
Most of the copper in the serum is transported bound to caeruloplasmin; the rest is bound to albumin, transcuprein and copper–amino acid complexes.10 Serum levels of copper and caeruloplasmin may be influenced by age and sex, as well as by other conditions,11,12 but laboratories often do not take these into account when reporting reference intervals. Furthermore, caeruloplasmin has 6–8 (not 6) copper atoms per molecule, with most being tightly bound.13,14,15,16 As a result, serum caeruloplasmin may show considerable heterogeneity in the number of copper atoms per molecule. Thus, any formula that is used to calculate caeruloplasmin‐bound copper assuming that six copper atoms bind per molecule of caeruloplasmin may be valid only in certain situations and also be subject to definite limitations.
As the serum level of copper is largely determined by that of caeruloplasmin,17,18 this should be taken into account when presenting and interpreting copper levels. Some patients with Wilson's disease have serum levels of copper and caeruloplasmin within their respective reference range2,4,13,19,20,21; furthermore, about 2% of the population is heterozygotic for P‐type adenosine triphosphatase mutations2 and often has caeruloplasmin levels around the lower reference interval. To try to overcome such issues, the measurement of NCC has been advocated as a superior diagnostic tool for Wilson's disease.13,17,18 Problems associated with the current use of NCC18 include physiologically impossible negative results in many patients.18 Furthermore, any index for the study on copper status should ideally have the potential to be used in the investigation on excess and deficiency states of copper. It is also important that healthcare professionals can understand the results provided by the index in both excess and deficiency states of copper. Although NCC is used in the investigation on copper excess, to our knowledge it is not used in the investigation on copper deficiency. Therefore, we hypothesised that a corrected copper, analogous to adjusted calcium, would prove to be more useful in presenting the results of copper analysis and in maintaining credence among non‐clinical and clinical healthcare professionals. To this end, we used the data from our previous publication18 to derive an equation to adjust the serum concentration of copper for that of caeruloplasmin.
Methods
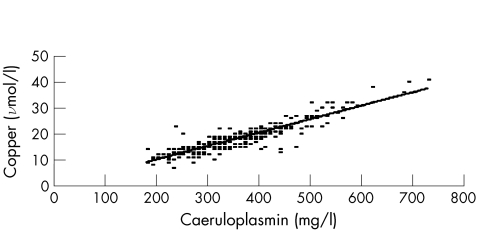
We previously reviewed the copper, caeruloplasmin and NCC results for 338 patients without Wilson's disease or copper deficiency.18 The copper was analysed by flame atomic absorption on a Varian Spectra 20 (Palo Alto, USA) (interassay coefficient of variance (CV) 5.3% at 18 μmol/l) and the caeruloplasmin with the Roche Tintaquant Kit (Lewes, UK) on a Hitachi 912 (interassay CV 8.9% at 300 mg/l)18. When copper concentrations were plotted against those of caeruloplasmin (fig 1), we derived a slope of 0.052 (0.049 to 0.055) and an intercept of −0.1 (−1.1 to –0.9), where copper concentration is measured in μmol/l and that of caeruloplasmin in mg/l. An intercept of 0.0 was used, as it was not statistically different from zero. Thus, we used the same principle as that used by Barth et al22 for the adjustment of serum calcium for albumin, at a reference interval of 10–25 μmol/l for copper, and obtained
Figure 1 Relationship between copper and caeruloplasmin in 338 patients.
[adjusted copper] (μmol/l)=[total copper] (μmol/l) −0.052×[caeruloplasmin] (mg/l)+17.5 (μmol/l)
With this equation, we derived the adjusted copper concentrations on the 2.5th and 97.5th centiles for the 338 patients. We subsequently classified each patient as being high or low for adjusted copper and for NCC.
Results
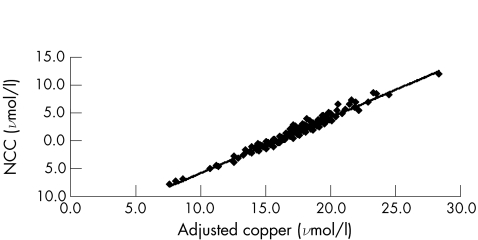
The concentrations of caeruloplasmin and copper were in the range (median) 180–730 (335) mg/l and 7–41 (18) μmol/l, respectively.18 The adjusted copper concentrations on the 2.5th and 97.5th centiles were 12.7 and 21.5 μmol/l, respectively. The relationship between the adjusted copper and NCC concentrations is linear (fig 2), with
Figure 2 Relationship between concentrations of adjusted copper and non‐caeruloplasmin‐bound (NCC) copper for 338 patients.
NCC=0.998×adjusted copper for caeruloplasmin−15.76
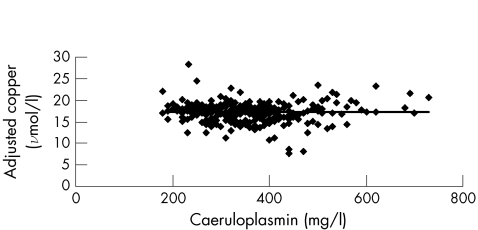
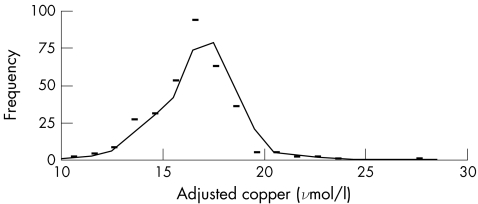
when ordinary linear regression is used with a correlation coefficient of 0.977. The copper adjusted for caeruloplasmin is independent of caeruloplasmin concentration (fig 3). The cumulative copper distribution plot for this population approximates to a gaussian distribution (fig 4). With the use of the reference intervals for adjusted copper and NCC, all but six results were in agreement: low NCC with a normal adjusted copper (n = 1); low adjusted copper with a normal NCC (n = 1); high NCC with normal adjusted copper (n = 2); and high adjusted copper with normal NCC (n = 2). With the 95% confidence interval (CI) for the slope (0.049 to 0.055) used in the calculation of the adjusted copper for caeruloplasmin, five of the six discordant results mathematically agreed and were included in the 95% CI for one of the reference limits for copper adjusted for caeruloplasmin. The remaining result had a normal but low adjusted copper of 11.7 (95% CI 11.7 to 11.8) μmol/l with an NCC of −3.1 μmol/l. Although both indices are based on serum levels of copper and caeruloplasmin, the mathematical manipulations seem to be notably different. Our results, however, suggest that the copper adjusted for caeruloplasmin is clinically equivalent to the NCC. Accordingly, different mathematical approaches that use serum levels of copper and caeruloplasmin as variables can deliver equivalent answers from the viewpoint of a clinical interpretation.
Figure 3 Relationship between concentrations of caeruloplasmin and adjusted copper for 338 patients.
Figure 4 Distribution plot for caeruloplasmin‐adjusted copper in 338 patients.
Discussion
In a previous study,18 the 95% CI for NCC was found to be −2.9 to 6.3 μmol/l.18 Clearly, a negative NCC is not possible in reality, but this was found in 20.1% of our patient population. The implication is that the NCC, as reported by laboratories using copper and caeruloplasmin analysed from the same specimen, is probably confusing for non‐laboratory healthcare professionals. As laboratories have reported calcium adjusted for albumin for many years,22 we suggest that the concept of copper adjusted for caeruloplasmin will be better understood as it will not experience the defect of negative values.
Adjusted copper for caeruloplasmin is quite different from adjusted calcium for albumin. Unlike unbound calcium, which is under hormonal control, it is far from clear what controls the unbound copper level. Furthermore, whereas roughly half the serum calcium is bound to albumin, most of the serum copper is bound to caeruloplasmin. Thus, the adjustment model that works with calcium may not be appropriate for copper. Accordingly, this model needs to be evaluated with specimens from patients with Wilson's disease. The relationship between levels of adjusted copper and NCC in fig 2 is linear. Whereas such a relationship may not seem intuitive, NCC and copper adjusted for caeruloplasmin both depend on levels of total copper and caeruloplasmin and only differ in the factors applied to the caeruloplasmin level and the applied intercepts. Therefore, we are not surprised by the linear relationship; it supports our belief that they are probably equivalent indicators of copper status.
The copper adjusted for caeruloplasmin is not just a way of making copper better understood. By enabling adjustment, especially for relatively high levels of caeruloplasmin without recourse to producing ranges derived from age and sex,11,12,13 it will thus stop questions on why copper level is slightly raised when the caeruloplasmin is at the upper end of the reference interval. Furthermore, it overcomes the problem of how many copper atoms are carried on each caeruloplasmin molecule.
The methodological weaknesses of copper adjusted for caeruloplasmin are similar to those identified for NCC.18 Immunological methods used for caeruloplasmin cross react with apocaeruloplasmin and there is no standardised method for caeruloplasmin.13 Caeruloplasmin assays are fraught with uncertainty from specificity, bias and precision.23 Thus, method‐related differences may have a large effect on the copper adjusted for caeruloplasmin in a manner similar to NCC. Irrespective of which caeruloplasmin assay is used, we recommend that laboratories determine their own equation before implementing adjusted copper for caeruloplasmin, as the equations may be dependent on the method.
No patients with either copper deficiency or excess were included in this study and thus the results need to be validated in these groups. Direct measurement of free copper is now possible,24 but is not currently available in routine laboratories. In due course, this may be an alternative solution for patients who are being investigated for abnormalities of copper metabolism.
Conclusion
We believe that copper adjusted for caeruloplasmin offers a clearer method of presenting standardised copper concentrations to clinicians when investigating copper metabolism, and it also has the added advantage of overcoming reference interval differences due to age and sex. Further evaluation with specimens from patients with metabolic copper problems such as Wilson's disease and copper deficiency is required to validate this concept.
Abbreviations
NCC - non‐caeruloplasmin‐bound copper
Footnotes
Competing interests: None declared.
References
- 1.Gollan J L, Gollan T J. Wilson disease in 1998: genetic, diagnostic and therapeutic aspects. J Hepatol 199828(Suppl 1)28–36. [DOI] [PubMed] [Google Scholar]
- 2.Anon Wilson disease. OMIM 277900. On‐line mendelian inheritance in man. http://www.ncbi.nlm.nih.gov/omim (accessed 6 Sep 2005)
- 3.Ferenci P. Review article: diagnosis and current therapy of Wilson's disease. Aliment Pharmacol Ther 200419157–165. [DOI] [PubMed] [Google Scholar]
- 4.Steindl P, Ferenci P, Dienes H P.et al Wilson's disease in patients presenting with liver disease: a diagnostic challenge. Gastroenterology 1997113212–218. [DOI] [PubMed] [Google Scholar]
- 5.Anon Menke's disease. OMIM 309400. On‐line mendelian inheritance in man. http://www.ncbi.nlm.nih.gov/omim (accessed 16 May 2006)
- 6.Wierzbicki A S, Patel N, Evans K.et al Copper‐64 metabolism in two patients with non‐Wilsonian movement disorders and copper deficiency. J Neurol Sci 199311985–90. [DOI] [PubMed] [Google Scholar]
- 7.Ito S, Fujita H, Narita T.et al Urinary copper excretion in type 2 diabetic patients with nephropathy. Nephron 200188307–312. [DOI] [PubMed] [Google Scholar]
- 8.Rowin J, Lewis S L. Copper deficiency myeloneuropathy and pancytopenia secondary to overuse of zinc supplementation. J Neurol Neurosurg Psychiatry 200576750–751. [DOI] [PMC free article] [PubMed] [Google Scholar]
- 9.Kumar N, Gross J B, Jr, Ahlskog J E. Copper deficiency myelopathy produces a clinical picture like subacute combined degeneration. Neurology 20046333–39. [DOI] [PubMed] [Google Scholar]
- 10.Shenkin A, Baines M, Fell G S.et al Vitamins and trace elements. In: Burtis CA, Ashwood ER, Bruns DE, eds. Tietz textbook of clinical chemistry and molecular diagnostics. 4th edn. St Louis, MI: Elsevier Saunders, 20061075–1164.
- 11.Johnson P E, Milne D B, Lykken G I. Effects of age and sex on copper absorption, biological half‐life, and status in humans. Am J Clin Nutr 199256917–925. [DOI] [PubMed] [Google Scholar]
- 12.Mendez M A, Araya M, Olivares M.et al Sex and ceruloplasmin modulate the response to copper exposure in healthy individuals. Environ Health Perspect 20041121654–1657. [DOI] [PMC free article] [PubMed] [Google Scholar]
- 13.Walshe J M. Wilson's disease: the importance of measuring serum caeruloplasmin non‐immunologically. Ann Clin Biochem 200340(Pt 2)115–121. [DOI] [PubMed] [Google Scholar]
- 14.Holmberg C G, Laurell C B. Investigations in serum copper: (II). Isolation of the copper‐containing protein and the description of some of its properties. Acta Chem Scand 19482550–556. [Google Scholar]
- 15.Bielli P, Calabrese L. Structure to function relationships in ceruloplasmin: a ‘moonlighting' protein. Cell Mol Life Sci 2002591413–1427. [DOI] [PMC free article] [PubMed] [Google Scholar]
- 16.Johnson A M. Other proteins: ceruloplasmin. In: Ritchie RF, Navolotskaia O, eds. Serum proteins in clinical medicine. 1st edn. Scarborough, MA: Foundation for Blood Research, 1996
- 17.Gaffney D, Fell G S, O'Reilly D S. ACP best practice no 163. Wilson's disease: acute and presymptomatic laboratory diagnosis and monitoring, J Clin Pathol 200053807–812. [DOI] [PMC free article] [PubMed] [Google Scholar]
- 18.Twomey P J, Viljoen A, House I M.et al Relationship between serum copper, ceruloplasmin, and non‐ceruloplasmin‐bound copper in routine clinical practice. Clin Chem 2005511558–1559. [DOI] [PubMed] [Google Scholar]
- 19.Walshe J M, Yealland M. Not Wilson's disease: a review of misdiagnosed cases. Q J Med 19958855–59. [PubMed] [Google Scholar]
- 20.Cauza E, Maier‐Dobersberger T, Polli C.et al Screening for Wilson's disease in patients with liver diseases by serum ceruloplasmin. J Hepatol 199727358–362. [DOI] [PubMed] [Google Scholar]
- 21.Gibbs K, Walshe J M. A study of the caeruloplasmin concentrations found in 75 patients with Wilson's disease, their kinships and various control groups. Q J Med 197948447–463. [PubMed] [Google Scholar]
- 22.Barth J H, Fiddy J B, Payne R B. Adjustment of serum total calcium for albumin concentration: effects of non‐linearity and of regression differences between laboratories. Ann Clin Biochem 199633(Pt 1)55–58. [DOI] [PubMed] [Google Scholar]
- 23.Beetham R, White P, Riches P.et al Use of CRM 470/RPPHS has not achieved true consensus for ceruloplasmin measurement. Clin Chem 2002482293–2294. [PubMed] [Google Scholar]
- 24.Bohrer D, do Nascimento P C, Ramirez A G.et al Comparison of ultrafiltration and solid phase extraction for the separation of free and protein‐bound serum copper for the Wilson's disease diagnosis. Clin Chim Acta 2004345113–121. [DOI] [PubMed] [Google Scholar]


