Abstract
Background
The cadherin–catenin complex is the key component of the adherens junction in epithelial cells, and changes in this complex are implicated in gastric adenocarcinoma. Germline mutations in E‐cadherin have been described in diffuse‐type gastric adenocarcinoma. Helicobacter pylori infection is the first stage in gastric carcinogenesis.
Aims
To determine whether H pylori was associated with changes in the complex, and whether this was affected by virulence of the strain.
Methods
Epithelial cell lines were cultured with H pylori using the wild‐type pathogenic and non‐pathogenic strains and CagE null and VacA null isogenic mutants. Gastric biopsy specimens at endoscopy were obtained from patients with (n = 17) and without (n = 15) H pylori infection, and E‐cadherin and β–catenin expression was assessed by immunohistochemistry. H pylori was typed by polymerase chain reaction from these patients for CagE and VacA.
Results
In vitro studies showed that coculture with a pathogenic strain of H pylori led to disruption of epithelial junctional β‐catenin expression, but without evidence of nuclear translocation or signalling. This effect was independent of a functional Cag pathogenicity island and vacuolating activity, but dependent on live bacteria. No marked differences in β‐catenin or E‐cadherin expression were seen in gastric biopsy specimens in patients with and without H pylori infection.
Conclusion
Acute H pylori infection disrupts junctional β‐catenin in vitro, but chronic infection by H pylori has no effect on E‐cadherin and β‐catenin expression, as seen in gastric biopsy specimens at the initial gastritis stage of the proposed Correa pathway of gastric carcinogenesis. A later effect at the later stages of atrophy or intestinal metaplasia cannot be ruled out.
Helicobacter pylori is the main cause of peptic ulceration and gastric mucosa‐associated lymphoid tissue lymphoma,1,2 and the strongest risk factor for the development of distal gastric adenocarcinoma.3 The outcome of H pylori infection is dependent on the host4 and environmental5 and bacterial factors.6,7 Strains possessing the Cag pathogenicity island, encoding a type IV bacterial protein secretion system,8,9,10,11 are more strongly associated with increased levels of inflammation and disease6 as are those producing an active form of VacA, a pore‐forming toxin that induces cytoplasmic vacuolation in vitro.12,13,14,15
The cadherin–catenin complex is the key component of the adherens junction between epithelial cells. It is important in providing structural support to cells by linkage with the actin cytoskeleton, and also in promoting epithelial cross‐talk. Changes in expression of proteins in this complex are implicated in several epithelial cancers including gastric adenocarcinoma,16,17,18,19,20,21 and germline mutations in E‐cadherin have been described in diffuse‐type gastric adenocarcinoma.22,23 β‐catenin is also an important cell signalling molecule (part of the wnt pathway) and has an important role in cell proliferation and oncogenesis.
Few data are available at present on expression of the cadherins and catenins in normal and inflamed gastric epithelial cells. A few reports suggest that H pylori disrupts E‐cadherin24,25,26 and stimulates β‐catenin signalling,27 and also that these mechanisms underlie gastric carcinogenesis. We assessed whether H pylori disrupted E‐cadherin and β‐catenin localisation in relevant cell lines, whether this resulted in β‐catenin‐mediated cell signalling and whether H pylori infection was associated with changes in E‐cadherin and β‐catenin immunolocalisation in vivo.
Methods
In vitro studies
H pylori strains and epithelial cells
The following strains were used:
60190 (ATCC 49503, cagPaI+, VacA s1m1 (vacuolating)13)
Tx30a (ATCC 51392, cagPaI−, VacA s2m2 (non‐vacuolating)13)
60190CagE− (cagE− insertion isogenic mutant of 6019028)
60190VacA− (disrupted VacA− insertion mutant of 6019029)
AGS, RK13, HeLa and HT29 cell lines were used for coculture28 and grown in Lab‐Tek chamber slides (Nunc, Roskilde, Denmark) and 75‐cm2 tissue culture flasks. After 48 h of incubation, H pylori was added to subconfluent HT29 cells such that the final ratio of viable bacteria to epithelial cells ranged from 100:1 to 1:1. Cells and strains were grown in a 5% carbon dioxide incubator at 37°C for 24 h.
Immunoblots
Cell lysates were obtained by scraping cells into radioimmuno precipitation buffer (7.5 ml 1 M sodium chloride, 5 ml 0.5 M Tris, 0.5 ml NP40, 0.05 g sodium dodecyl sulphate, 0.25 g sodium deoxycholate made up to 50 ml with sterile distilled water and broad‐spectrum protease inhibitor cocktail (Sigma‐Aldrich, Gillingham, UK)) after washes in phosphate‐buffered saline. Immunoblots were carried out on epithelial cell lysates28 using monoclonal antibodies to E‐cadherin (R&D systems, Abingdon, UK), α‐catenin (Transduction Laboratories, BD Biosciences, San Jose, California, USA), β‐catenin (Sigma‐Aldrich) and Cyclin D1 (Santa Cruz Biotechnology, Wembley, UK) at titres of 1:1000, 1:250, 1:1000 and 1:1000, respectively.
Cell fractionation
Epithelial cells were separated into Triton‐X soluble (cytosolic) and Triton‐X insoluble (membranous) fractions for immunoblotting by the addition of cytoskeletal extraction buffer (250 mM 2‐(N‐morpholino) ethanesulfonic acid, 125 mM ethylene glycol bis (β‐aminoethylether)‐NNN′N′‐tetra‐acetic acid, 25 mM magnesium chloride, 2.5% Triton‐X) to cells in tissue culture flasks. Fractions were microcentrifuged and pellets resuspended in sodium dodecyl sulphate running buffer before immunoblotting.
Immunohistochemical analysis
Immunohistochemical analysis was carried out29 using the following primary monoclonal antibodies: E‐cadherin (1:200), β‐catenin, 1:200). Slides were examined by confocal microscopy (Leica SP2 confocal microscope, 488‐nm laser line, Leica, Milton Keynes, UK). Assessment and scoring was described in Results.
In vivo studies
Patients and biopsy samples
Patients and biopsy samples were acquired as described previously28 with full ethical approval from the University Hospital Nottingham Ethics Committee. H pylori strains were cultured and typed by polymerase chain reaction for VacA and CagE.28
Immunohistochemical analysis was carried out on paraffin‐wax‐embedded sections of antral and corpus biopsy specimens,28 with staining using specific monoclonal antibodies to E‐cadherin and β‐catenin (Affiniti, Biomol International, Exeter, UK) at dilutions of 1:800 and 1:500, respectively. Criteria for H pylori infection were as stated previously.28
Assessment and grading of biopsy staining
Table 1 describes a validated method30 used to grade immunoreactivity for E‐cadherin and particularly for β‐catenin.
Table 1 Immunoreactivity grades.
| Grade | Immunoreactive epithelial cells (%) |
|---|---|
| 0 | 0–5 |
| 1 | 5–25 |
| 2 | 25–50 |
| 3 | 50–75 |
| 4 | 75–100 |
Scoring was carried out by two observers blinded to the patient's H pylori status (JRB and AZ), and epithelial cells were scored in three zones (superficial, proliferative and deep).28
Statistical analysis
All data were analysed using the GraphPad Prism package, San Diego, California, USA. Mann–Whitney U tests were used to compare median scores for histological grading in vivo, and t test was used to compare in vitro grading.
Results
Characterisation of cadherin–catenin expression in epithelial cell lines
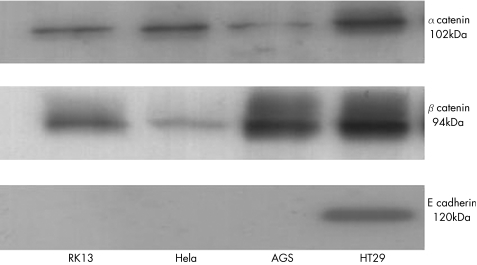
Western blot confirmed the expression of E‐cadherin, α‐catenin and β‐catenin in the positive control cell line HT29. No bands were seen for E‐cadherin in AGS, HeLa or RK13 cells (fig 1). Immunohistochemical analysis and fluorescent microscopy confirmed the absence of expression of E‐cadherin in AGS cells and diffuse cytoplasmic or junctional staining with β‐catenin. In contrast, HT29 cells stained predominantly at cell–cell contact regions for both E‐cadherin and β‐catenin.
Figure 1 Western blots of cell lysates from RK13, HeLa, AGS and HT29 cells. Cells were grown in 75‐cm2 flasks before lysis with radioimmuno precipitation buffer and protease inhibitors. Lysates were standardised for protein concentration before equal loading on sodium dodecyl sulphate–polyacrylamide gel electrophoresis and immunoblotting to monoclonal antibodies for catenins and E‐cadherin. Size in kDa is the size of the human form of catenin or E‐cadherin.
We therefore used the colon‐derived HT29 cell line as our model cell line to study the effects of H pylori, as it expressed all four proteins at the correct predicted size.
Response of HT29 cell line to coculture with two different H pylori strains
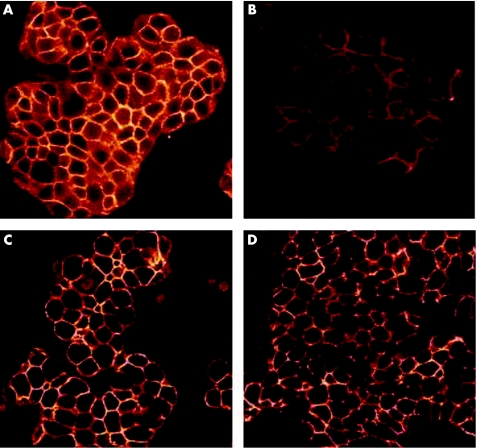
Coculture of H pylori strain 60190 with HT29 cells led to altered distribution of β‐catenin, with decreased intensity of junctional immunoreactivity and without any increase in cytoplasmic or nuclear immunostaining (fig 2).
Figure 2 Immunofluorescent images of HT29 cells on confocal microscopy. (A,B) Stained for β‐catenin. (A) Untreated cells, (B) after coculture for 24 h with Helicobacter pylori strain 60190. Decreased membranous staining intensity is seen in (B). (C,D) Stained for E‐cadherin. (C) Untreated cells, (D) after coculture with H pylori strain 60190. No changes can be seen in the staining pattern or intensity.
To quantify differences with H pylori and assess any differences between pathogenic and non‐pathogenic strains, a series of images was acquired by confocal microscopy of HT29 cells untreated or cocultured with either H pylori strain 60190 (pathogenic), or Tx30a (non‐pathogenic). In each case, five images (randomly selected fields) were acquired at least 5 μm from the bottom or top of the field of cells and at least 15 μm apart. Both microscopists (JRB and SA) were blinded to H pylori status.
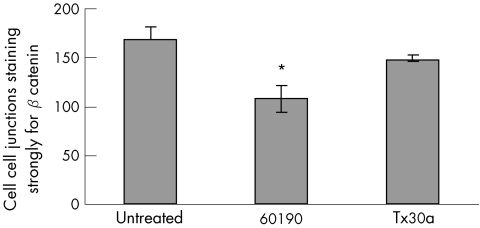
For slide analysis, 200 cell–cell junctions were counted and the intensity of immunostaining was graded as strong, absent or weak. For each field, the strongest immunoreactivity pattern was scored, in case sections had been taken from too near the top or bottom of the monolayer. This was carried out five times for each treatment and results were expressed as number of junctions per 200 counted sections expressing strong, weak or no immunoreactivity (fig 3).
Figure 3 Number of cell–cell junctions staining strongly for β‐catenin (out of 200 counted), for HT29 cells untreated and cocultured with Helicobacter pylori strains 60190 (pathogenic) and Tx30a (non‐pathogenic). Coculture was carried out for 24 h with a bacteria:cell ratio of 100:1. Bar shows mean (SEM) of 5 experiment. *60190 versus untreated, p<0.05, t test.
Untreated HT29 cells stained predominantly in a junctional fashion, and most cell–cell junctions showed strong immunoreactivity for β‐catenin (mean (standard error (SEM)), 168 (SEM13)). Cells treated with the pathogenic strain 60190 stained less strongly (mean 108 (SEM 13); p<0.05 v untreated) as did those treated with the non‐pathogenic strain Tx30a, (mean 149 (SEM 3) cells).
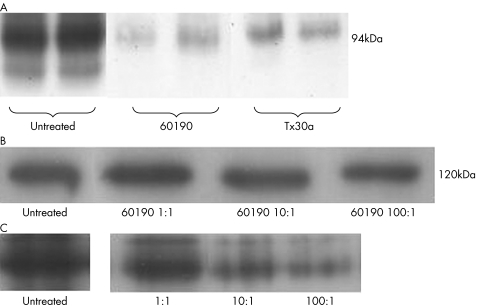
Western immunoblots showed that 60190‐treated cells showed less intense bands for β‐catenin, whereas no changes were seen for E‐cadherin (fig 4A,B).
Figure 4 (A) Cell lysates or untreated cocultured with Helicobacter pylori strains 60190 or Tx30a, blotted to β‐catenin. Bands are fainter with coculture, particularly for 60190. Duplicate experiments were run in parallel are shown. (B) HT29 lysates blotted to E‐cadherin. Three different ratios of bacteria:cell have no effect on the amount of total E‐cadherin. (C) HT29 lysates blotted to β‐catenin. The total amount of β‐catenin is seen to reduce as bacterial density increases. Total protein loading was equal in each lane in (A), (B) and (C).
Coculture experiments using serial 10‐fold dilutions of bacteria showed that increased bacterial dilution led to abrogation of the effect on β‐catenin levels (fig 4C).
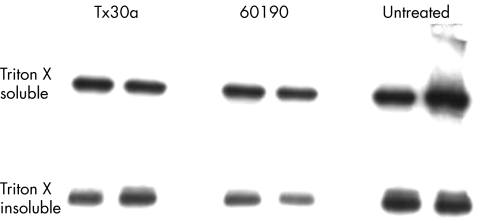
Cell fractionation studies confirmed that in the Triton‐insoluble fraction (membrane‐bound), there was less total β‐catenin (fig 5), whereas there was no change in the Triton‐soluble (cytoplasmic) fraction.
Figure 5 Immunoblots for β‐catenin on Triton‐soluble and Triton‐insoluble fractions of HT29 cells cocultured with Helicobacter pylori. A reduction in band intensity is seen for the Triton‐insoluble (membrane‐bound) fraction for H pylori strain 60190. This is consistent with the findings of immunohistochemical analysis. Duplicate experiments were run in parallel.
Role of bacterial factors in inducing β‐catenin changes
We analysed the role of bacterial factors using VacA and CagE insertion mutants of 60190 that we have previously shown do not express VacA or a type IV secretion system, respectively.29
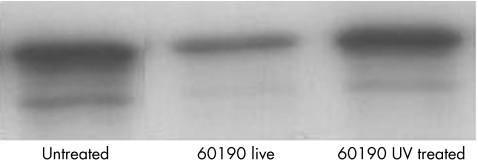
Coculture experiments and subsequent immunoblots showed similar decreases with both VacA null and CagE null mutant strains, implying that neither VacA nor the CagPaI‐encoded T4SS contributed to the effect (fig 6); however, live bacteria were required (fig 7).
Figure 6 Immunoblots to β‐catenin for cell lysates treated with Helicobacter pylori wild‐type strain 60190, and its isogenic cagE− and vacA− mutant strains. No differences were seen in β‐catenin band intensity (checked by densitometry). Cocultures were carried out in triplicate.
Figure 7 A representative immunoblot of HT29 cell lysates after coculture with Helicobacter pylori, which had either been pretreated with ultraviolet (UV) irradiation for 2 min (thereby killing the bacteria, confirmed by viable count) or not pretreated with UV light. HT29 cells not treated with H pylori are shown for comparison. Intensity bands are decreased for “live” bacteria compared with UV‐treated H pylori. This suggests that the changes seen in levels of β‐catenin are due to a bacteria‐specific effect and that live bacteria are required for the effect.
Functional significance of in vitro changes
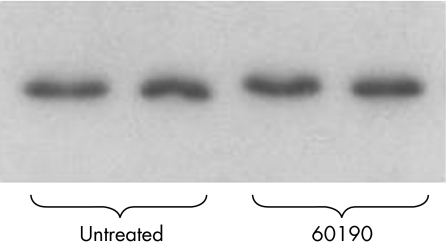
We examined whether a known β‐catenin target gene product, cyclin D1, was up regulated as we had not observed nuclear immunolocalisation (with presumed β‐catenin‐induced transcription of genes), but no differences were observed (fig 8).
Figure 8 Immunoblot of fresh HT29 cell lysates to cyclin D1 monoclonal antibody. No differences were seen between untreated cells and cells treated with Helicobacter pylori strain 60190. Equal protein concentrations were loaded in each well. Representative blot, n = 4 per treatment.
H pylori and the cadherin–catenin complex in vivo
To examine whether changes in vitro applied in vivo, we used immunohistochemical analysis to examine gastric biopsy specimens obtained from patients with and without H. pylori infection. We stained biopsy specimens (antrum and corpus) from 32 patients (17 with and 15 without H pylori infection) for E‐cadherin and β‐catenin, and conventionally assessed for the presence of gastritis, atrophy, intestinal metaplasia and malignancy. H pylori strains were cultured and typed by polymerase chain reaction for CagE and VacA genotypes. Of the 17 strains cultured, 11 were CagE+, 6 were VacA s1m1 and 7 were VacA s1m2.
Slides were examined and graded for the amount and pattern (junctional, cytoplasmic or nuclear) of staining. As we were interested in proliferation and β‐catenin‐mediated oncogenesis, we focused on the proliferative zone containing pluripotent stem cells. Thus we divided gastric pits into three zones: superficial, proliferative and deep.
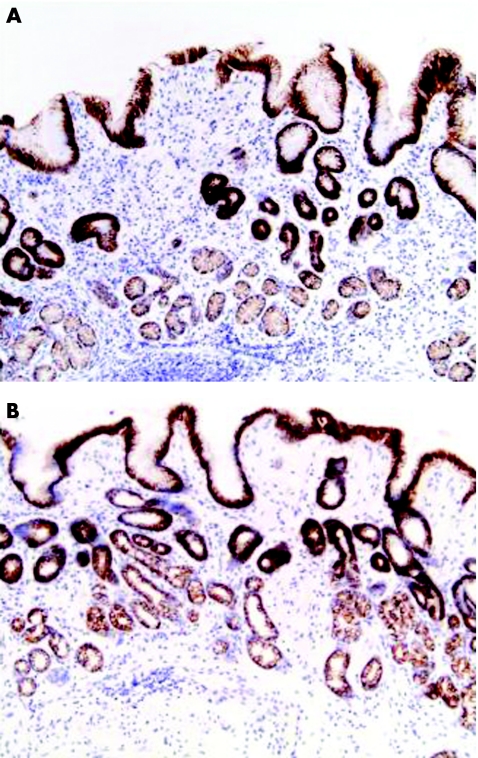
Gastric epithelial cells stained clearly for E‐cadherin in a predominantly junctional pattern (fig 9). Staining was present in most cells in the epithelial cell layer. Quantification of staining showed no differences between biopsy specimens of patients with and without H pylori infection, or any differences associated with gastric atrophy or intestinal metaplasia. We found no association between bacterial strain type (Cag status, VacA genotype) and E‐cadherin staining intensity.
Figure 9 Gastric antral biopsy specimens stained for E‐cadherin from a patient (A) with and (B) with out Helicobacter pylori‐infection. Almost all epithelial cells are stained in both biopsy specimens, independent of H pylori status and inflammation (inflammatory infiltrate seen in (A)).
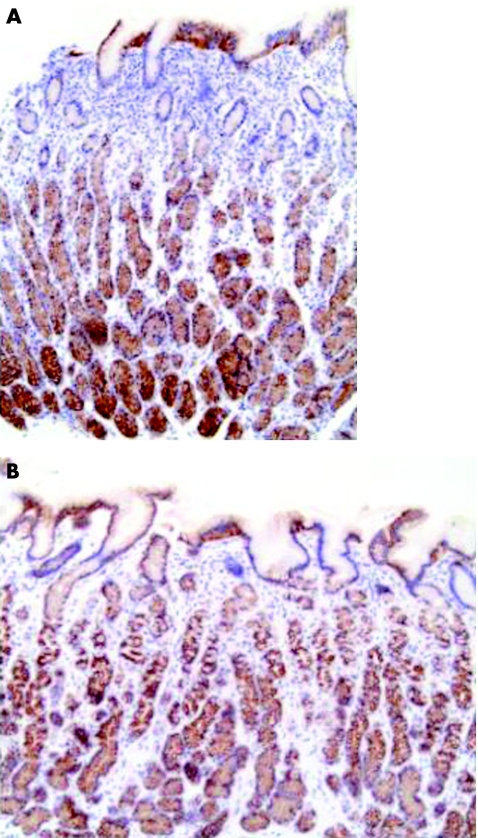
Similar staining patterns were seen for β‐catenin as for E‐cadherin, with predominantly junctional staining (fig 10). Differences in staining were seen between the different zones of epithelial cells, with stronger staining patterns in deeper zones. Neither marked differences nor any relationship between staining patterns and bacterial strain type was seen between biopsy specimens of patients with and without H pyrori infection.
Figure 10 Gastric corpus biopsy specimens stained for β‐catenin (A) with Helicobacter pylori infection; (B) without Helicobacter pylori infection.
Discussion
Our study shows that H pylori infection leads to a reduction in junctional expression of β‐catenin, and this effect is induced more markedly by a candidate pathogenic than a non‐pathogenic strain and is mediated by live bacteria. Experiments using cell‐free extracts and isogenic mutants suggest that the effect was not dependent on secreted proteins such as the toxin VacA or the Cag‐encoded type IV secretion system. Immunohistochemistry showed that in vivo β‐catenin distribution was not different between gastric biopsy specimens of patients with and without H pyrori infection.
The functional relevance of the changes we observed in β‐catenin distribution is not clear; we saw no effect on cyclin D1, which is induced by β‐catenin, and no nuclear translocation of β‐catenin in vitro or in vivo. Previous work31 showing that H pylori transactivates cyclin D1 in AGS cells in a manner dependent on time, dose and partly CagPaI was not conducted on a biologically relevant cell line.
The other important cell adhesion molecule we examined in this study was E‐cadherin, for which both germline22,23 and somatic mutations18 with prognostic implications19 have been described in gastric cancer.22,23H pylori has been associated with changes in E‐cadherin expression,24,32 although in the first study24 no images were shown and their grading system was not as rigorous as ours. Another study32 has shown promoter E‐cadherin methylation to be strongly associated with H pylori infection and also to be increasingly common in the Correa progression to gastric cancer. Our study showed no changes in E‐cadherin expression with H pylori infection either in vitro or in vivo.
One limitation of this study relates to the choice of the HT29 cell line, which our preliminary characterisation suggested to be suitable. However, the HT29 cell line possesses a truncated Adenomatosis polyposis coli gene product,33 and another study has shown β‐catenin phosphorylation patterns34 leading to accumulation of non‐phosphorylated β‐catenin. However, β‐catenin trafficking is clearly under multiple and complex control,35 and changes in antigen‐presenting cell cannot explain the differences we showed in membranous localisation and are unlikely to explain our observed lack of nuclear translocation. Besides this, we showed a lack of nuclear translocation in vivo, supporting our cell line data.
We carried out a careful and rigorous analysis of the effects of H pylori infection on the cadherin–catenin complex. The effects seen in cell lines may be due to acute H pylori infection, but once infection is chronically established (in vivo), no differences are observed between biopsy specimens of patients with and without infection. Therefore, we conclude that there is no effect of chronic H pylori infection on β‐catenin, although of course we cannot exclude an effect later in the Correa model of gastric cancer at the level of intestinal metaplasia or atrophy.
Acknowledgements
We thank Dr Susan Anderson for assistance with confocal microscopy.
Footnotes
Funding: JRB was supported by Fellowships from The Wellcome Trust (Entry Level) and the Medical Research Council (Clinical Training Fellowship). JCA holds a Senior Clinical Fellowship from the Medical Research Council.
Competing interests: None declared.
References
- 1.Nomura A, Stemmermann G N, Chyou P H.et al Helicobacter pylori infection and gastric carcinoma among Japanese Americans in Hawaii [see comments]. N Engl J Med 19913251132–1136. [DOI] [PubMed] [Google Scholar]
- 2.Parsonnet J, Friedman G D, Vandersteen D P.et al Helicobacter pylori infection and the risk of gastric carcinoma [see comments]. NEngl J Med 19913251127–1131. [DOI] [PubMed] [Google Scholar]
- 3.Nomura A, Stemmermann G N, Chyou P H.et al Helicobacter pylori infection and the risk for duodenal and gastric ulceration [see comments]. Ann Int Med 1994120977–981. [DOI] [PubMed] [Google Scholar]
- 4.El‐Omar E M, Carrington M, Chow W H.et al Interleukin‐1 polymorphisms associated with increased risk of gastric cancer. Nature 2000404398–402. [DOI] [PubMed] [Google Scholar]
- 5.Martin D F, Montgomery E, Dobek A S.et al Campylobacter pylori, NSAIDS, and smoking: risk factors for peptic ulcer disease. Am J Gastroenterol 1989841268–1272. [PubMed] [Google Scholar]
- 6.Atherton J C. H. pylori virulence factors [review]. Br Med Bulletin 199854105–120. [DOI] [PubMed] [Google Scholar]
- 7.Blaser M J, Berg D E. Helicobacter pylori genetic diversity and risk of human disease [review]. J Clin Invest 2001107767–773. [DOI] [PMC free article] [PubMed] [Google Scholar]
- 8.Asahi M, Azuma T, Ito S.et al Helicobacter pylori CagA protein can be tyrosine phosphorylated in gastric epithelial cells [see comments]. J Exp Med 2000191593–602. [DOI] [PMC free article] [PubMed] [Google Scholar]
- 9.Odenbreit S, Puls J, Sedlmaier B.et al Translocation of Helicobacter pylori CagA into gastric epithelial cells by type IV secretion. Science 20002871497–1500. [DOI] [PubMed] [Google Scholar]
- 10.Segal E D, Cha J, Lo J.et al Altered states: involvement of phosphorylated CagA in the induction of host cellular growth changes by Helicobacter pylori. Proc Natl Acad Sci USA 19999614559–14564. [DOI] [PMC free article] [PubMed] [Google Scholar]
- 11.Stein M, Rappuoli R, Covacci A. Tyrosine phosphorylation of the Helicobacter pylori CagA antigen after cag‐driven host cell translocation. Proc Natl Acad Sci USA 2000971263–1268. [DOI] [PMC free article] [PubMed] [Google Scholar]
- 12.Atherton J C. The clinical relevance of strain types of Helicobacter pylori [review]. Gut 199740701–703. [DOI] [PMC free article] [PubMed] [Google Scholar]
- 13.Leunk R D, Johnson P T, David B C.et al Cytotoxic activity in broth‐culture filtrates of Campylobacter pylori. J Med Microbiol 19882693–99. [DOI] [PubMed] [Google Scholar]
- 14.Papini E, de Bernard M, Milia E.et al Cellular vacuoles induced by Helicobacter pylori originate from late endosomal compartments. Proc Natl Acad Sci USA 1994919720–9724. [DOI] [PMC free article] [PubMed] [Google Scholar]
- 15.Szabo I, Brutsche S, Tombola F.et al Formation of anion‐selective channels in the cell plasma membrane by the toxin VacA of Helicobacter pylori is required for its biological activity. EMBO J 1999185517–5527. [DOI] [PMC free article] [PubMed] [Google Scholar]
- 16.Matsuura K, Kawanishi J, Fujii S.et al Altered expression of E‐cadherin in gastric cancer tissues and carcinomatous fluid. Br J Cancer 1992661122–1130. [DOI] [PMC free article] [PubMed] [Google Scholar]
- 17.Matsui S, Shiozaki H, Inoue M.et al Immunohistochemical evaluation of alpha‐catenin expression in human gastric cancer. Virchows Arch 1994424375–381. [DOI] [PubMed] [Google Scholar]
- 18.Becker K F, Atkinson M J, Reich U.et al E‐cadherin gene mutations provide clues to diffuse type gastric carcinomas. Cancer Res 1994543845–3852. [PubMed] [Google Scholar]
- 19.Jawhari A, Jordan S, Poole S.et al Abnormal immunoreactivity of the E‐cadherin‐catenin complex in gastric carcinoma: relationship with patient survival. Gastroenterology 199711246–54. [DOI] [PubMed] [Google Scholar]
- 20.Ramesh S, Nash J, McCulloch P G. Reduction in membranous expression of beta‐catenin and increased cytoplasmic E‐cadherin expression predict poor survival in gastric cancer. Br J Cancer 1999811392–1397. [DOI] [PMC free article] [PubMed] [Google Scholar]
- 21.Yu J, Ebert M P, Miehlke S.et al Alpha‐catenin expression is decreased in human gastric cancers and in the gastric mucosa of first degree relatives. Gut 200046639–644. [DOI] [PMC free article] [PubMed] [Google Scholar]
- 22.Gayther S A, Gorringe K L, Ramus S J.et al Identification of germ‐line E‐cadherin mutations in gastric cancer families of European origin. Cancer Res 1998584086–4089. [PubMed] [Google Scholar]
- 23.Guilford P, Hopkins J, Harraway J.et al E‐cadherin germline mutations in familial gastric cancer. Nature 1998392402–405. [DOI] [PubMed] [Google Scholar]
- 24.Terres A M, Pajares J M, O'Toole D.et al H pylori infection is associated with downregulation of E‐cadherin, a molecule involved in epithelial cell adhesion and proliferation control. J Clin Pathol 199851410–412. [DOI] [PMC free article] [PubMed] [Google Scholar]
- 25.Blok P, Craanen M E, Offerhaus G J.et al Molecular alterations in early gastric carcinomas. No apparent correlation with Helicobacter pylori status. Am J Clin Pathol 1999111241–247. [DOI] [PubMed] [Google Scholar]
- 26.Shun C T, Wu M S, Lin M T.et al Immunohistochemical evaluation of cadherin and catenin expression in early gastric carcinomas: correlation with clinicopathologic characteristics and Helicobacter pylori infection. Oncology 200160339–345. [DOI] [PubMed] [Google Scholar]
- 27.Franco A, Krishna U, Peek R. Helicobacter pylori induces aberrant beta‐catenin signalling in gastric epithelial cells. Gastroenterology 2004126(Suppl 2)848 [Google Scholar]
- 28.Bebb J R, Letley D P, Thomas R J.et al Helicobacter pylori upregulates matrilysin (MMP‐7) in epithelial cells in vivo and in vitro in a Cag dependent manner. Gut 2003521408–1413. [DOI] [PMC free article] [PubMed] [Google Scholar]
- 29.Bebb J R, Letley D P, Rhead J L.et al Helicobacter pylori supernatants cause epithelial cytoskeletal disruption that is bacterial strain and epithelial cell line dependent but not toxin VacA dependent. Infect Immun 2003713623–3627. [DOI] [PMC free article] [PubMed] [Google Scholar]
- 30.Kapiteijn E, Liefers G J, Los L C.et al Mechanisms of oncogenesis in colon versus rectal cancer. J Pathol 2001195171–178. [DOI] [PubMed] [Google Scholar]
- 31.Hirata Y, Maeda S, Mitsuno Y.et al Helicobacter pylori activates the cyclin D1 gene through mitogen‐activated protein kinase pathway in gastric cancer cells. Infect Immun 2001693965–3971. [DOI] [PMC free article] [PubMed] [Google Scholar]
- 32.Chan A O, Lam S K, Wong B C.et al Promoter methylation of E‐cadherin gene in gastric mucosa associated with Helicobacter pylori infection and in gastric cancer. Gut 200352502–506. [DOI] [PMC free article] [PubMed] [Google Scholar]
- 33.Hsi L C, Angerman‐Stewart J, Eling T E. Introduction of full‐length APC modulates cyclooxygenase‐2 expression in HT‐29 human colorectal carcinoma cells at the translational level. Carcinogenesis 1999202045–2049. [DOI] [PubMed] [Google Scholar]
- 34.Sadot E, Conacci‐Sorrell M, Zhurinsky J.et al Regulation of S33/S37 phosphorylated beta‐catenin in normal and transformed cells. J Cell Sci 2002115(Pt 13)2771–2780. [DOI] [PubMed] [Google Scholar]
- 35.Kucerova D, Sloncova E, Tuhackova Z.et al Expression and interaction of different catenins in colorectal carcinoma cells. Int J Mol Med 20018695–698. [PubMed] [Google Scholar]


