Right ventricular (RV) function may be impaired either by primary right sided heart disease, or secondary to left sided cardiomyopathy or valvar heart disease. Two dimensional echocardiography is the mainstay for analysis of RV function. A detailed description of echocardiographic approaches for assessment of RV function is provided elsewhere.1 This brief review is focused on echocardiographic evaluation of right sided cardiac pathology.
EVALUATION OF RV PRESSURE OVERLOAD
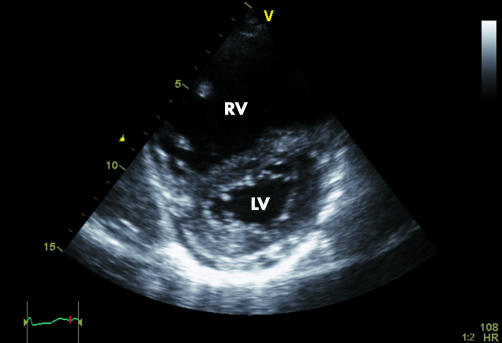
The estimation of RV pressure is of great clinical importance since the RV pressure is equal to the pressure in the pulmonary artery, provided that there is no pulmonic stenosis. Typically, in RV pressure overload, the RV wall is thickened (> 4 mm) (often observed in congenital heart disease) or dilated (in acquired heart disease). In both situations, the RV free wall is hypokinetic, and is best appreciated from parasternal long axis projections. If an elevated pulmonary artery pressure is suspected, the shape of the interventricular septum should be evaluated. Normally, the shape of the left ventricular (LV) cavity will be circular because of the higher LV pressure throughout the cardiac cycle. However, in the presence of RV pressure overload, the interventricular septum will shift towards the LV and the septum will appear flattened during systole (D shape), which is best visualised on the parasternal short axis view, just below the mitral valve. The higher the RV pressure, the further the septum will displace into the LV resulting in a D shaped LV cavity (fig 1). Of note, septal flattening in the presence of elevated RV pressure should be distinguished from (isolated) RV volume overload, which leads to a septal flattening during diastole.2,3
Figure 1 Parasternal short axis view during systole in a patient with severe right ventricle (RV) pressure overload. Note the flattening of the interventricular septum, the D shaped left ventricle (LV) and the enlarged RV. In patients with isolated RV volume overload, septal flattening occurs only in diastole.
This has also been referred to as the eccentricity index, described as the ratio of the LV cavity in mid short axis projections between the major and minor LV diameters. This ratio should normally be equal to 1 as the LV has a circular shape. If the septum moves towards the left, then the anteroposterior diameter increases, while the transverse diameter is reduced with a progressively increasing ratio.4
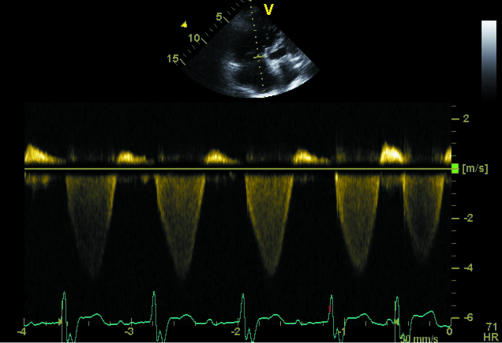
Perhaps the most common, and highly reproducible, method to estimate RV pressure is the calculation of the trans‐tricuspid pressure gradient during systole using continuous wave Doppler5 (fig 2). This technique provides the most accurate non‐invasive estimation of pulmonary artery pressure and correlates well with invasive measurements.5,6,7,8 The maximum velocity of the trans‐tricuspid regurgitant jet (m/s) is used to estimate pressure difference between the RV and the right atrium using a modified Bernoulli equation: 4 * [tricuspid regurgitant jet]2
Figure 2 Continuous wave recording of a tricuspid regurgitant jet. The trans‐tricuspid pressure gradient is calculated using a modified Bernoulli equation (4 * [tricuspid regurgitant jet]2). A trans‐tricuspid gradient > 30 mm Hg is considered indicative for RV pressure overload (provided there is no pulmonic stenosis).8
In 3790 normal subjects, McQuillan et al found a mean (SD) trans‐tricuspid gradient of 18.3 (4.9) mm Hg (∼2.1 m/s) with a 95% upper limit of 2.61 m/s, corresponding to a trans‐tricuspid gradient of approximately 27 mm Hg.9 Pulmonary artery systolic pressure can be calculated by adding right atrial pressure to the Bernoulli derived trans‐tricuspid pressure gradient.
Right atrial pressure can be estimated from the subcostal view using the diameter and the respiratory collapse of the inferior vena cava. A normal diameter of the inferior vena cava (< 2 cm) and a collapse > 50% during inspiration (or a “sniff”) suggests a normal right atrial pressure (< 10 mm Hg). If the collapse of the inferior vena cava is reduced during sniffing and the diameter is still normal, right atrial pressure is slightly elevated (10–15 mm Hg). A dilated inferior vena cava suggests the presence of more severe elevation of right atrial pressures with a right atrial pressure of 15–20 mm Hg if the respiratory collapse is reduced and > 20 mm Hg in the absence of respiratory collapse.10
In patients without pulmonary hypertension the tricuspid regurgitant signal is measurable in 50–70% of patients5,6,7,9,11 However, in the presence of pulmonary hypertension the number of measurable patients becomes much higher (up to 90%).5,7,9 This may even be higher when saline contrast enhancement is used.
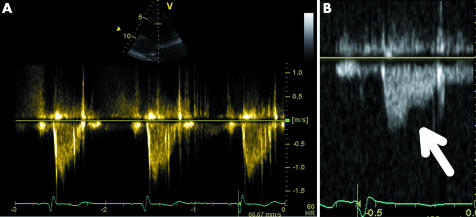
The assessment of the transtricuspid pressure gradient using continuous wave Doppler is the method of choice for echocardiographic quantification of pulmonary artery systolic pressure. In addition, various echocardiographic signs are also supportive of elevated pulmonary artery pressure. First, the pattern of the systolic flow velocity curve in the RV outflow tract derived with pulsed wave Doppler; as RV pressure increases, peak velocity will occur earlier in systole resulting in a more triangular shape of the pulmonary flow profile, which is normally dome shaped (fig 3A). As a result, pulmonary flow acceleration time will shorten and a value < 100 ms has a sensitivity of 78% with a specificity of 100% for diagnosing elevated pulmonary artery pressure (fig 3A). Also, in the presence of severe pulmonary hypertension a systolic notch may appear in the deceleration phase (fig 3B).11,12,13 And finally, the end diastolic velocity of the pulmonary regurgitant jet (if present) can help in assessing pulmonary artery pressure indirectly. In particular, adding the end diastolic pressure gradient (derived from the end diastolic velocity of the pulmonary regurgitation) to the right atrial pressure reflects the pulmonary pressure.
Figure 3 (A) Pulsed wave recording of the pulmonic forward flow in a patient with pulmonary hypertension. Note the triangular shape of the Doppler flow pattern. Shortened pulmonary flow acceleration time (< 100 ms) is also an indicator of pulmonary artery pressure.11 (B) Pulsed wave recording of the pulmonic forward flow in a patient with severe pulmonary hypertension. With severe RV pressure overload, a systolic notch may occur in the deceleration phase of the pulmonic forward flow (arrow).
Once pulmonary hypertension has been diagnosed, the most challenging clinical issue is the aetiology (secondary or primary pulmonary hypertension). Echocardiography is an ideal tool to exclude possible cardiac causes of pulmonary hypertension, such as LV dysfunction, mitral regurgitation or intracardiac shunts. In the absence of a cardiac pathology, other techniques (pulmonary functional tests, computed tomographic scan) should be obtained to assess further the aetiology of pulmonary hypertension.
EVALUATION OF RV VOLUME OVERLOAD
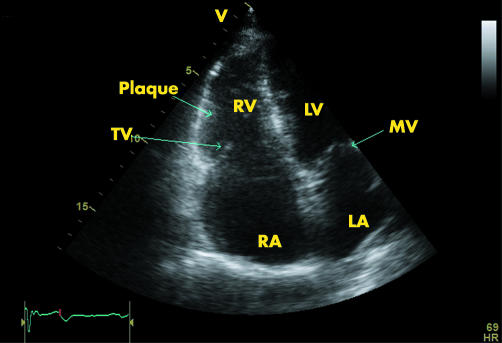
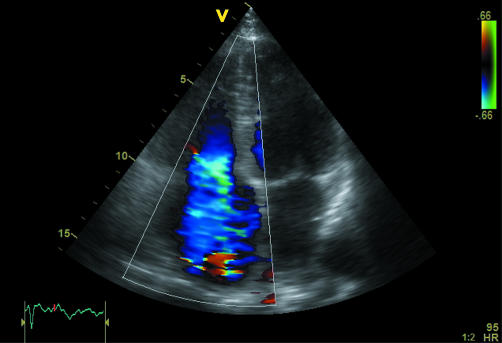
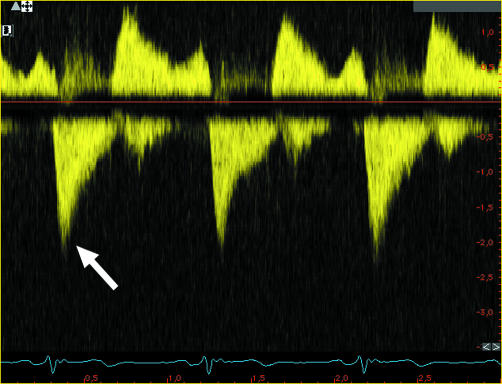
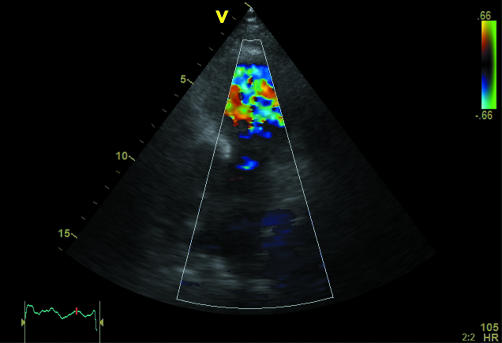
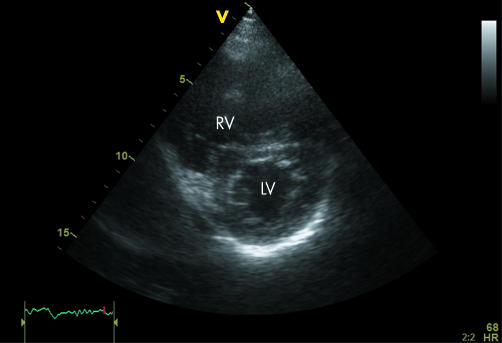
The causes of RV volume overload are tricuspid and/or pulmonary regurgitation in the presence of various cardiac pathologies. First, acquired structural pathologies of the tricuspid valve, such as rheumatic fever, carcinoid syndrome or infective endocarditis, produce tricuspid regurgitation. These abnormalities of the tricuspid leaflets can readily be identified by two dimensional echocardiography. About 20% of patients with rheumatic heart disease present with involvement of the tricuspid leaflets which typically dome in diastole. This may produce both tricuspid stenosis and regurgitation. Carcinoid syndrome usually involves both the tricuspid and pulmonic valve. Affected tricuspid (and pulmonic) valves show shortened, thickened and retracted leaflets, but also the subvalvar apparatus including tendinous chords and papillary muscles may show fibrous reaction (fig 4). Rarely calcifications are seen. Due to the often extremely large coaptation failure, a large regurgitant flow with a relatively low velocity is seen (fig 5). Typical for this severe tricuspid regurgitation is the dagger‐shaped spectral Doppler curve (fig 6). In fig 7 the pulmonic regurgitation is depicted, and since fibrously affected valves are rarely calcified, the pulmonic valve abnormalities are difficult to depict. Secondary to the RV volume overload echocardiography may depict RV enlargement in 90% of cases and abnormal ventricular septal motion in almost half of the cases (fig 8).
Figure 4 In this apical four chamber view (systolic frame), the coaptation failure of the tricuspid valve is depicted; subvalvar fibrous plaque formation is present. LA, left atrium; LV, left ventricle; MV, mitral valve; RA, right atrium.
Figure 5 Apical four chamber view, with colour flow mapping. The severe systolic tricuspid regurgitation is demonstrated. Note the relative low velocity (minimal aliasing) of the regurgitant flow, indicating a large regurgitant orifice.
Figure 6 Spectral continuous wave Doppler flow through the tricuspid valve. Note the dagger shaped curve (below the baseline, arrow) with an early systolic peak velocity and a rapid decline, compatible with severe tricuspid regurgitation.
Figure 7 Parasternal short axis view (colour flow) focused on the right ventricular outflow tract (RVOT) and the pulmonic trunk. Note the turbulence in the RVOT, indicating severe pulmonic regurgitation. Because carcinoid of the pulmonic valve rarely causes calcification, the valve is poorly visible.
Figure 8 Parasternal short axis view at end diastolic phase. Abnormal septal motion is observed (D shape caused by septal motion towards the left ventricle, LV) due to the volume overload of the dilated right ventricle (RV).
Right sided endocarditis will typically involve the tricuspid leaflets but can also affect the pulmonic valve. The hallmark of valvar infection is the detection of vegetations with a varying severity of tricuspid regurgitation, depending on the extent of valve destruction.
Next, a number of congenital abnormalities result in RV volume overload—for example, caused by tricuspid regurgitation in Ebstein's anomaly, or by left to right shunting in atrial septal defects and anomalous pulmonary venous drainage.
Finally, tricuspid regurgitation can be secondary to tricuspid annular dilatation in RV dilatation, as can be observed in cardiomyopathies or RV infarction. In these patients, tricuspid valve leaflets are normal and tricuspid regurgitation is caused by annular dilatation (functional). If this results from RV cardiomyopathy, RV contractile dysfunction will provide a clue to the differential diagnosis. Although pulmonary hypertension can show similar RV dilatation, the measurement of maximal tricuspid regurgitant velocity and the systolic deformation of the RV septum in short axis projections should help in distinguishing the two conditions.
RIGHT VENTRICULAR CARDIOMYOPATHY
When the RV is prominent with regional contractile dysfunction, this can be the consequence of ischaemic heart disease, mainly caused by proximal right coronary artery occlusion and frequently associated with LV dysfunction in the inferior wall. This is important to recognise particularly in the setting of acute myocardial infarction, when the patient presents with signs of heart failure and elevated filling pressures. Conversely, in RV cardiomyopathy, the RV is dilated with diffuse contractile dysfunction, whereas the left ventricle may not be affected. The most common (frequently) isolated RV cardiomyopathy is arrhythmogenic RV cardiomyopathy or dysplasia (ARVC/D).
ARRHYTHMOGENIC RIGHT VENTRICULAR CARDIOMYOPATHY OR DYSPLASIA
This is a heterogeneous group of conditions characterised by RV dysfunction and dilatation. While in the majority of cases the left ventricle is spared, left ventricular involvement can occur during disease progression. Often patients present with arrhythmias, in particular with ventricular tachycardia originating from the RV (left bundle branch block (LBBB) morphology), which could be life threatening. ARVC/D is an important cause of sudden death in individuals < 30 years of age and has been found in up to 20% of sudden deaths in young people.14 ARVC/D is typically inherited as an autosomal dominant trait with variable penetrance and incomplete expression. It characterised by adipose replacement of myocardial tissue in the RV wall in a spotty or diffuse process that starts in the RV subepicardium and spreads to the endocardium with fibrofatty replacement of myocytes and thinning of the wall.
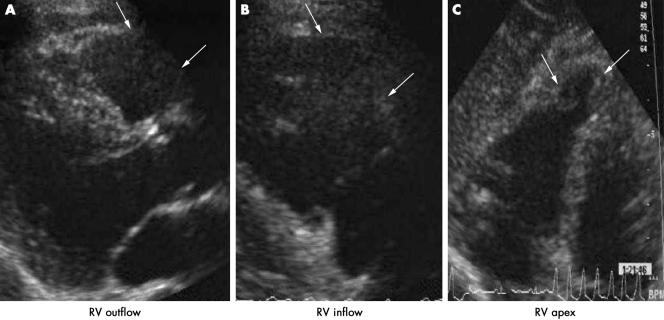
The regions of the RV most frequently involved are the RV inflow area, the apex, and the infundibulum (fig 9). These three areas form the “triangle of dysplasia”.14 Histological diagnosis is often difficult since small amounts of fat are present in the epicardial layers and within the RV myocardium even in normal subjects, and these increase with age. When the LV becomes also involved, the fibrofatty replacement can affect both the septum and LV free wall.
Figure 9 Successive echocardiographic views from a patient with arrhythmogenic RV cardiomyopathy (ARVC) to illustrate the “triangle of dysplasia”. In panel A, there is a localised akinetic area in the outflow track seen from parasternal long axis view (arrows). Panel B shows the RV inflow track view with a localised akinetic region in the free wall (arrows). Panel C shows apical four chamber projection demonstrating an apical aneurysm on the RV (arrows).
ECHOCARDIOGRAPHIC CHARACTERISTICS
Echocardiography is the diagnostic test of choice but needs to be performed according to standardised protocols.15,16 As ARVC/D affects primarily the RV, it is important to acquire views encompassing the entire RV, from the RV inflow to the outflow tract.16 The earliest abnormalities that can be detected may be focal areas of myocardial dysfunction, which may involve the RV inflow, apex and/or the RV outflow tract. These areas, however, may easily be missed or considered as normal variants of the RV function. The more obvious and pathognomonic abnormalities are those of localised aneurysmal regions of the triangle of dysplasia in the form of end systolic bulges. As long as the RV inflow and outflow tract projections are carefully recorded, these regional dyskinetic regions are easily detected. Some patients may exhibit more than one dyskinetic region. In a more advanced stage of ARVC/D, extensive areas of the RV free wall may become thin and akinetic which, together with RV dilatation, form the typical pattern of ARVC/D (fig 10). Lastly, in the most severe and advanced cases, the LV will become involved and could mimic that of non‐specific dilated cardiomyopathy.
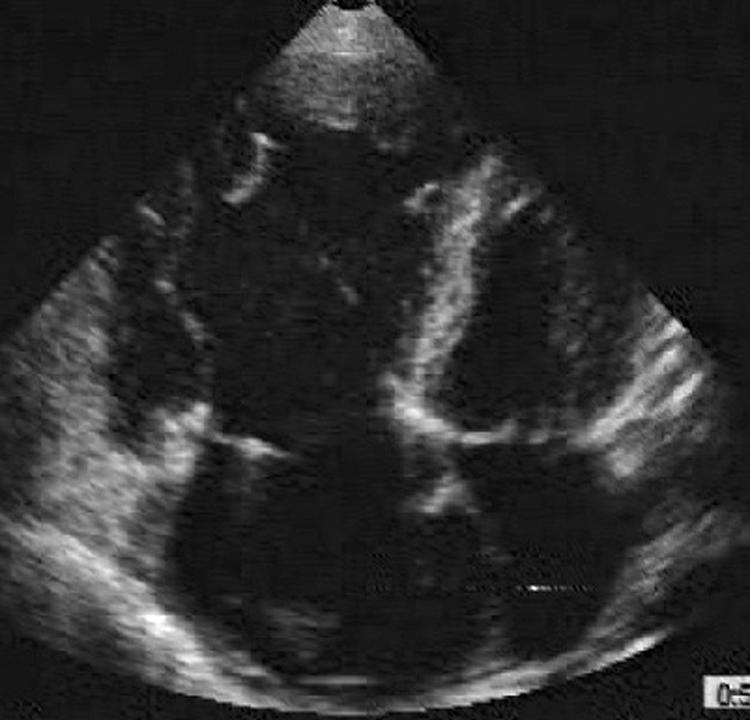
Figure 10 Apical four chamber view from a patient with a severe form of ARVC/D. In contrast with the patient in fig 9 where the aneurysm was very localised, here the entire RV is dilated and poorly contracting.
CRITERIA FOR DIAGNOSIS OF ARVC/D
A definite diagnosis of ARVC/D requires the histological finding of transmural fibrofatty replacement of RV myocardium. Diagnosis by endomyocardial biopsy may be difficult in view of the patchy distribution of the fibrofatty replacement during the earlier stages of the disease. Because of these difficulties, a consensus group has proposed a number of major and minor diagnostic criteria,14 which are summarised in table 1. To qualify as ARVC/D, a patient must demonstrate either two major, one major plus two minor, or four minor criteria.
Table 1 Task force criteria for diagnosis of arrhythmogenic right ventricular cardiomyopathy/dysplasia (ARVC/D).
| Major criteria | Minor criteria | ||
|---|---|---|---|
| 1 | Global and/or regional dysfunction and structural alterations | Severe RV dilatation and reduction of RVEF with no (or mild) impairment in LVEF | Mild global RV dilatation and/or reduction in RVEF with normal LVEF |
| Localised RV aneurysms (dyskinetic areas) | Mild segmental RV dilatation | ||
| Severe segmental RV dilatation | Regional RV hypokinesia | ||
| 2 | Tissue characterisation of walls | Fibrofatty replacement of myocardium on endomyocardial biopsy | |
| 3 | Repolarisation abnormalities | Inverted T waves in right precordial leads (V2 and V3) (in absence of RBBB) | |
| 4 | Depolarisation/conduction abnormalities | Epsilon waves or localised prolongation (>110 ms) of the QRS complex in right precordial leads (V1–V3) | Late potentials (signal averaged ECG) |
| 5 | Arrhythmias | LBBB type (non‐)sustained ventricular tachycardia | |
| Frequent ventricular extrasystoles (more than 1000/24 h) | |||
| 6 | Family history | Familial disease confirmed at necropsy or surgery | Familial history of premature sudden death (<35 years) due to suspected RV dysplasia |
| Familial history (clinical diagnosis based on present criteria) |
LBBB, left bundle branch block; LV, left ventricular; LVEF, left ventricular ejection fraction; RBBB, right bundle branch block; RV, right ventricular; RVEF, right ventricular ejection fraction.
Adapted from Furuno et al.13
RIGHT VENTRICULAR INFARCTION
The right ventricle may be affected when acute right coronary occlusion occurs. It usually occurs when a dominant right coronary artery is occluded proximally. Usually it is the RV free wall that is affected and this can be imaged from the parasternal long axis view focusing on the RV free wall in the form of localised akinesia. Occasionally, the inferior wall may also be akinetic viewed from the RV inflow track view and subcostal projections.
The diagnosis of RV infarction should be suspected in a patient with a history of recent myocardial infarction or chest pain who has signs of RV failure with raised jugular venous pressure.
While the echocardiographic characteristics of the localised RV wall akinesia may be difficult to differentiate from ARVC/D, the history of chest pain, myocardial infarction and perhaps most importantly, the presence of localised inferior LV akinesia, make the differential diagnosis rather clear. Indeed, when RV infarction is suspected, one should image the LV and look for regional inferior LV segmental abnormalities. While in ARVC/D, the LV may also be affected, the location is rather different, involving predominantly the ventricular septum and apex.
LIMITATIONS
The current review discusses the use of echocardiography in the evaluation of patients with acquired RV right heart pathologies from the right ventricular functional perspective as this may be important in guiding the correct diagnosis. Therefore it was not meant to be an exhaustive review of right heart pathologies. There are also several other (non‐)invasive techniques that have been advocated for the evaluation of patients with RV pathology. For example, right sided heart catheterisation is used for the evaluation of patients with severe RV pressure overload and magnetic resonance imaging (MRI) can be used for evaluation of RV function and structure (for example, fibro‐fatty replacements in ARVC/D). However, cardiac catheterisation is invasive and MRI is a complex technique with very limited availability and expertise only in high volume centres, and they may be seen rather as complementary modalities to echocardiography.
CONCLUSION
Comprehensive echocardiographic imaging allows accurate diagnosis in patients with RV pathology. At present, echocardiography should be considered the technique of choice for daily routine use in the evaluation of patients with known or suspected RV pathology.
Abbreviations
ARVC/D - arrhythmogenic right ventricular cardiomyopathy/dysplasia
LBBB - left bundle branch block
LV - left ventricular
MRI - magnetic resonance imaging
RV - right ventricular
References
- 1.Bleeker G B, Steendijk P, Holman E R.et al Assessing right ventricular function: the role of echocardiography and complementary technologies. Heart 200692(suppl I)i19–i26. [DOI] [PMC free article] [PubMed] [Google Scholar]
- 2.Ryan T, Petrovic O, Dillon J C.et al An echocardiographic index for separation of right ventricular volume and pressure overload. J Am Coll Cardiol 19855918–927. [DOI] [PubMed] [Google Scholar]
- 3.Kingma I, Tyberg J V, Smith E R. Effects of diastolic transseptal pressure gradient on ventricular septal position and motion. Circulation 1983681304–1314. [DOI] [PubMed] [Google Scholar]
- 4.Wilkins M, Paul G, Strange J.et al Sildenafil versus endothelin receptor antagonist for pulmonary hypertension (SERAPH) study. Am J Resp Crit Care Med 20051711292–1297. [DOI] [PubMed] [Google Scholar]
- 5.Yock P G, Popp R L. Noninvasive estimation of right ventricular systolic pressure by Doppler ultrasound in patients with tricuspid regurgitation. Circulation 198470657–662. [DOI] [PubMed] [Google Scholar]
- 6.Berger M, Haimowitz A, van Tosh A.et al Quantitative assessment of pulmonary hypertension in patients with tricuspid regurgitation using continuous wave Doppler ultrasound. J Am Coll Cardiol 19856359–365. [DOI] [PubMed] [Google Scholar]
- 7.Currie P J, Seward J B, Chan K L.et al Continuous wave Doppler determination of right ventricular pressure: a simultaneous Doppler‐catheterization study in 127 patients. J Am Coll Cardiol 19856750–756. [DOI] [PubMed] [Google Scholar]
- 8.Hinderliter A L, Willis P W, Barst R J.et al Effects of long‐term infusion of prostacyclin (epoprostenol) on echocardiographic measures of right ventricular structure and function in primary pulmonary hypertension. Circulation 1997951479–1486. [DOI] [PubMed] [Google Scholar]
- 9.McQuillan B M, Picard M H, Leavitt M.et al Clinical correlates and reference intervals for pulmonary artery systolic pressure among echocardiographically normal subjects. Circulation 20011042797–2802. [DOI] [PubMed] [Google Scholar]
- 10.Kircher B J, Himelman R B, Schiller N B.et al Noninvasive estimation of right atrial pressure from the inspiratory collapse of the inferior vena cava. Am J Cardiol 199066493–496. [DOI] [PubMed] [Google Scholar]
- 11.Naeije R, Torbicki A. More on the noninvasive diagnosis of pulmonary hypertension: Doppler echocardiography revisited. Eur Respir J 199581445–1449. [PubMed] [Google Scholar]
- 12.Dabestani A, Mahan G, Gardin J M.et al Evaluation of pulmonary artery pressure and resistance by pulsed Doppler echocardiography. Am J Cardiol 198759662–668. [DOI] [PubMed] [Google Scholar]
- 13.Furuno Y, Nagamoto Y, Fujita M.et al Reflection as a cause of mid‐systolic deceleration of pulmonary flow wave in dogs with acute pulmonary hypertension: comparison of pulmonary artery constriction with pulmonary embolisation. Cardiovasc Res 199125118–124. [DOI] [PubMed] [Google Scholar]
- 14.McKenna W J, Thiene G, Nava A.et al Diagnosis of arrhythmogenic right ventricular dysplasia/cardiomyopathy: task force of the working group myocardial and pericardial disease of the European Society of Cardiology and the Scientific Council on Cardiomyopathies of the International Society and Federation of Cardiology. Br Heart J 199471215–218. [DOI] [PMC free article] [PubMed] [Google Scholar]
- 15.Foale R A, Nihoyannopoulos P, Ribeiro P.et al Right ventricular abnormalities in ventricular tachycardia of right ventricular origine: relation to electrophysiological abnormalities. Br Heart J 19865645–54. [DOI] [PMC free article] [PubMed] [Google Scholar]
- 16.Foale R A, Nihoyannopoulos P, McKenna W J.et al The echocardiographic measurements of the normal adult right ventricle. Br Heart J 19865633. [DOI] [PMC free article] [PubMed] [Google Scholar]


