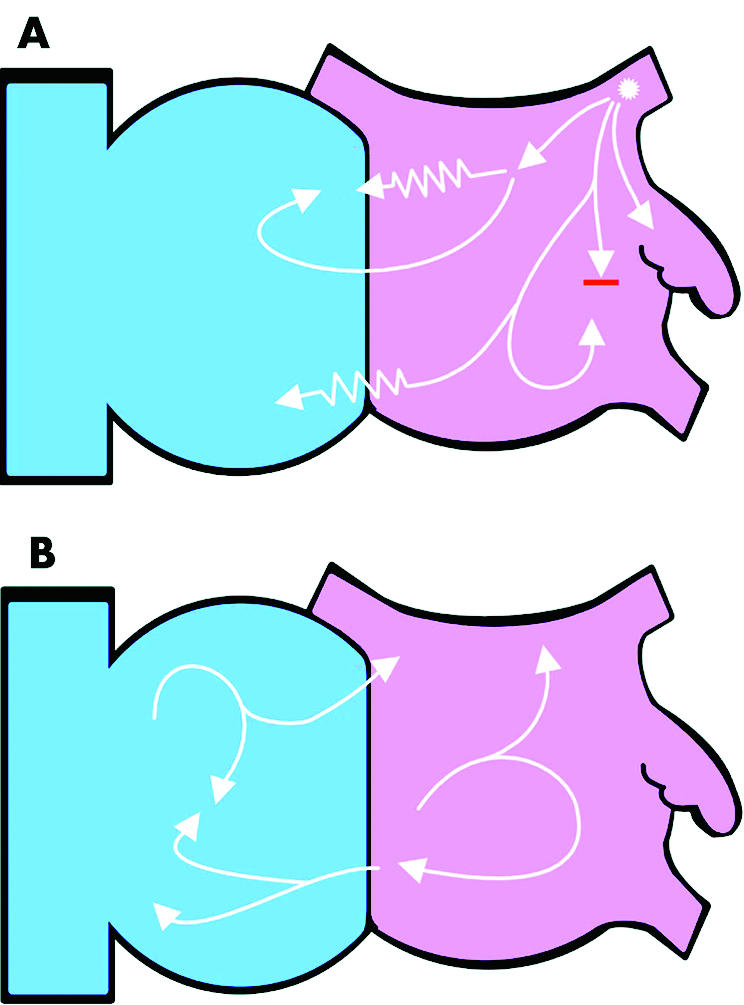
Figure 1 A schematic view of the interior surface of the right (blue) and left (pink) atria. The white arrows represent wavefronts of electrical depolarisation. (A) An ectopic focus (asterisk) from within the left superior pulmonary vein generates repetitive wavefronts at a high frequency. The rest of the atrial myocardium cannot propagate these wavefronts uniformly because of the heterogeneity of its conduction properties and anatomical obstacles. The zigzag lines represent slowed conduction and the red line conduction block. The wavefronts are consequently broken down into multiple wavefronts which manifest as atrial fibrillation on the ECG. If the focal trigger stops firing the fibrillation will terminate. (B) Multiple wavelet re‐entry. The wavefronts are turned and split by colliding with the anatomical structures (fixed block) and other wavefronts (functional block). The number of wavefronts is determined by the size and conduction properties of the atria. These wavefronts self propagate and are not dependent on a focal trigger.
