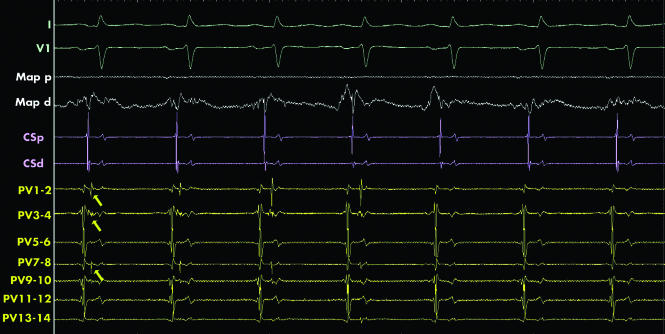
Figure 4 Electrical isolation of the left superior pulmonary vein. The surface and intracardiac electrograms recorded during ablation at the ostium of the left superior pulmonary vein. The signals shown are (from top to bottom); the surface ECG leads (I and V1, green), ablation catheter (Map, white), the coronary sinus (CS, pink) and the pulmonary vein catheter (PV, yellow). A double potential is recorded on some of the bipoles of the PV catheter (marked by yellow arrows). The first potential is the far field left atrial signal and the second the local PV potential. From the fifth sinus beat onwards the local PV potential disappears indicating the vein has become electrically isolated from the rest of the left atrium.

An official website of the United States government
Here's how you know
Official websites use .gov
A
.gov website belongs to an official
government organization in the United States.
Secure .gov websites use HTTPS
A lock (
) or https:// means you've safely
connected to the .gov website. Share sensitive
information only on official, secure websites.
