Abstract
Objective
To show an overall diagnostic accuracy ⩾ 90% for detection of ⩾ 50% stenoses by coronary half millimetre 32 detector row computed tomography angiography (32 × 0.5‐MDCTA) in patients with advanced coronary artery disease (CAD) and a high likelihood of raised calcium scores.
Methods
ECG gated 32 × 0.5‐MDCTA (32 × 0.5 mm cross sections, 0.35 × 0.35 × 0.35 mm3 isotropic voxels, 400 ms rotation) was performed after injection of iodixanol (120 ml, 320 mg/ml) in 30 consecutive patients (25 men, mean (SD) age 59 (13) years, body mass index 26.2 (4.9) kg/m2). Native arteries, including ⩾ 1.5 mm branches, and bypass grafts were screened for ⩾ 50% stenoses. Stents were excluded. Conventional coronary angiography (performed 18 (12) days before 32 × 0.5‐MDCTA) was analysed by quantitative coronary angiography.
Results
Median Agatston calcium score was 510 (range 3–5066). Sensitivity, specificity, and positive and negative predictive values for detection of ⩾ 50% stenoses in native arteries were 76% (29 of 38), 94% (190 of 202), 71% (29 of 41), and 96% (190 of 199), respectively. Overall diagnostic accuracy was 91% (219 of 240). Due to the following artefacts 20% (69 of 352) of the vessels were excluded: motion, noise, and low contrast enhancement isolated or in combination (45 of 69 (65%)); image distortion by implantable cardioverter‐defibrillator or pacemaker leads (18 of 69 (26%)); and blooming secondary to severe calcification (6 of 69 (9%)).
Conclusions
Coronary 32 × 0.5‐MDCTA accurately excludes ⩾ 50% stenoses in patients with advanced CAD and high calcium scores with an overall diagnostic accuracy of 91%.
Keywords: imaging, computed tomography, coronary angiography, coronary disease, stenosis
Quantitative coronary angiography (QCA) is the ideal means for in vivo evaluation of the vessel lumen in patients with coronary artery disease (CAD).1 Multidetector row computed tomography angiography (MDCTA) has recently emerged as a potential non‐invasive alternative to QCA.2 The increase in gantry speed to < 500 ms/rotation and in the number of detector rows from four to 64, as well as the decrease in slice thickness to submillimetre levels, over the past several years greatly improved diagnostic accuracy by coronary MDCTA.2,3,4,5,6,7,8,9 However, calcified and diffusely stenotic vessels often associated with advanced CAD limit current 16 detector row systems and have not been addressed by 64 detector row computed tomography (CT) angiography.7,8,9
The main purpose of this study was to investigate the diagnostic accuracy of coronary half millimetre 32 detector row CT angiography (32 × 0.5‐MDCTA) in the assessment of ⩾ 50% stenoses in patients with advanced CAD and a high likelihood of raised coronary calcium scores.
METHODS
Study population
Patients with advanced CAD and aged between 40–79 years, and consequently with a high likelihood of raised calcium scores, primarily referred to conventional coronary angiography (CCA) for clinical indications and who initially agreed to undergo coronary 32 × 0.5‐MDCTA within 60 days, were considered eligible for this comparative study.10,11 Advanced CAD was defined as luminal filling defects suggestive of atherosclerotic lesions in all three coronary territories with at least one visually graded as ⩾ 50% by the interventionist performing the CCA. Exclusion criteria were acute coronary syndromes, dyspnoea precluding a 15 to 20 second breath hold (in the absence or presence of bypass grafts, respectively), constant irregular rhythm, serum creatinine > 114 μmol/l, allergy to iodine, more than one cardiac catheterisation during the preceding year, recent exposure to fluoroscopy for > 35 minutes, and a history of intracoronary brachytherapy.
Over 157 days, 33 consecutive patients were selected (25 (76%) men, eight (24%) women). Three (9%) patients were excluded from the study because they later declined to receive additional doses of radiation or a radio contrast agent. Hence, 30 patients were ultimately enrolled (25 men, five women), with a mean (SD) body mass index of 26.2 (4.9) kg/m2 (median 25.9), aged 59 (13) years (median 60), and of white ethnicity (30 (100%)). Twenty seven (90%) had multivessel obstructive disease, defined as ⩾ 50% stenoses by QCA in at least two coronary territories, and five (17%) had an implantable cardioverter‐defibrillator (ICD) or a permanent pacemaker. Nine (30%) patients had a history of coronary artery bypass grafting and 21 (70%) had a history of percutaneous coronary intervention. The Johns Hopkins Hospital institutional review board approved this study and all participants gave written informed consent.
MDCTA protocol
MDCTA was performed with a half millimetre 32 detector row scanner (Aquilion 32; Toshiba Medical Systems Corporation, Otawara, Japan). Heart rate during the examination was mean (SD) 63 (12) beats/min (median 60). Twenty six (87%) patients were taking β blockers before the examination and no participants received additional doses for the CT examination.
Prospectively ECG triggered 3.0 mm thick cross sections for calcium score measurements were acquired before contrast infusion according to the protocol originally validated by electron beam CT.12 Subsequently, a 120 ml bolus of iodixanol at a concentration of 320 mg/ml (Visipaque 320; Amersham Health, Little Chalfont, Buckinghamshire, UK) followed by a saline chaser of 30 ml was injected intravenously through a dual head powered injector (Stellant; Medrad, Indianola, Pennsylvania, USA) at a rate of 5 ml/s (during the first two thirds) and then at 3 ml/s for the rest of the infusion. For bolus tracking, successive axial slices were acquired over the ascending aorta and a region of interest (Sure Start; Toshiba Medical) was positioned in the aortic root cranially to the emergence of the left coronary artery. As the signal in the ascending aorta reached a predefined threshold of 150 Hounsfield units the patient was instructed to sustain an inspiratory breath hold of 15 and 22 seconds on average, in the absence or presence of bypass grafts, respectively. Helical scanning was triggered manually and scanning direction was craniocaudal.
We used a scanning protocol with a gantry rotation time of 400 ms and slice collimation of 32 × 0.5 mm applied at a table increment of 3.60–4.40 mm/rotation, depending on the patient's heart rate, by using a tube voltage of 120 kV and a current of 250–400 mA, depending on the patient's weight. A scanning field of view of 320 mm was combined with a detector collimation of 32 × 0.5 mm, a slice reconstruction overlap of 40% (each 0.3 mm), and a 512 × 512 pixel matrix, ultimately generating truly isotropic voxels of 0.35 × 0.35 × 0.35 mm3 (13 line pairs/cm). Current was not modulated. On the basis of phantom measurements, mean effective radiation dose for both the calcium score scan and contrast enhanced angiography was 12 mSv (8–18 mSv).
Simultaneous ECG was recorded and retrospectively used to assign source images to their respective phases of the cardiac cycle. Axial images were reconstructed by a multisegment reconstruction algorithm at 10 time points (the centre of the reconstruction window between 0% and 90% of the cardiac cycle, at 10% intervals).5 At the observer's discretion, additional window positions were obtained.
MDCTA image interpretation
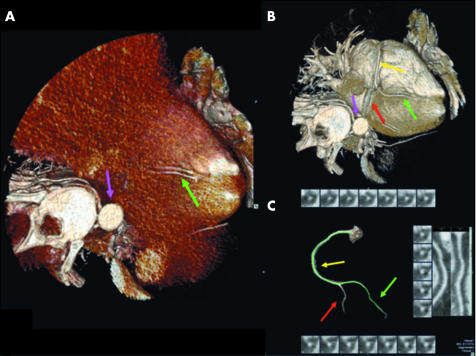
One observer (MASC) independently reviewed in a blinded fashion all 32 × 0.5‐MDCTA images by using a modified version of an automated three dimensional approach recently developed in our cardiovascular CT imaging laboratory and described in detail elsewhere.13 In short, it makes use of the visually oriented application of an automated vessel tracking algorithm (Vitrea 2, version 3.5; Vital Images Inc, Plymouth, Minnesota, USA) on the three dimensional cardiac volume rendered images. This semiautomated centre line detection of the coronary lumen on slabs of three dimensional volume renderings eventually generates orthogonal two dimensional curved multiplanar reformatted images as well as true cross sectional views. The lumen is then analysed on these two dimensional images automatically provided. In difficult cases, the traditional approach that uses axial and manually oriented multiplanar reformatted, thin slab maximum intensity projection, and curved multiplanar reformatted images was also used (fig 1).3
Figure 1 The performance of coronary half millimetre 32 detector row computed tomography angiography (32×0.5‐MDCTA) is shown in three dimensional cardiac volume renderings of the right coronary artery (RCA) (A) before (posterior descending artery, green arrow; descending aorta, purple arrow) and (B) after (RCA, yellow arrow; posterior descending artery, green arrow; posterolateral artery, red arrow; and descending aorta, purple arrow) the appropriate window level setting. (C) The isolated RCA is then traced by the vessel probe, with diagnosis based on visual assessment of true cross sectional and orthogonal curved multiplanar reformatted (CPR) images automatically provided, according to the protocol previously described.13
The four major coronary arteries—left main, left anterior descending (LAD), left circumflex (LCx), and right coronary artery (RCA), including their first order branches with luminal diameter ⩾ 1.5 mm by QCA (excluding septal and right marginal branches)—and bypass grafts were screened for two degrees of luminal stenosis, ⩾ 50% and ⩾ 70%, by visual estimation. Segments proximal and distal to stents and bypass graft anastomoses were evaluated. Stented lumens were excluded because we did not perform intravascular ultrasound for comparison in these patients. Total Agatston calcium scores were also obtained.12 Bypass grafts, stents, and metal clips were carefully avoided during calcium measurement.
Quantitative coronary angiography
CCA was performed according to standard techniques and blindly reviewed by another observer (JMM) by using QCA (Encompass; Heartlab Inc, Westerly, Rhode Island, USA).1 Diameter stenosis, as a percentage of the reference diameter (diameter of non‐diseased lumen immediately proximal to the lesion), was measured in two orthogonal directions and the average of these two measurements ultimately established stenosis severity. All lesions with a reference diameter ⩾ 1.5 mm by QCA were included.4
If the same major artery (left main‐LAD, LCx, or RCA), first order branch (diagonal, obtuse marginal, posterolateral, or posterior descending), or bypass graft contained more than one significant stenosis, only the most proximal lesion with luminal diameter ⩾ 50% or ⩾ 70% in each of these three distinct categories of vessels was compared with the corresponding 32 × 0.5‐MDCTA lesion.3,5 This same principle was followed in a separate analysis exclusively of the segments distal to bypass graft anastomoses.
Statistical analysis
Sample size was defined to provide an overall diagnostic accuracy ⩾ 90% for detection of ⩾ 50% stenoses in the native arteries of patients with advanced CAD and a high likelihood of raised calcium scores by 32 × 0.5‐MDCTA, with an α level of 0.05 (two sided p values) and a power of 0.80. For comparison we used our preliminary experience with 16 × 0.5‐MDCTA in patients with advanced CAD and high calcium scores in whom we had reached an overall diagnostic accuracy of 80% during a pilot study in our institution in 2004. Accordingly, we calculated a necessary sample size of ⩾ 215 native arteries, including main vessels and their side branches, for this per‐vessel analysis. Since documentation of at least one coronary stenosis ⩾ 50% by the interventionist during CCA was an inclusion criterion for this study, a per‐patient analysis would be strongly biased. Likewise, a per‐segment analysis could have promoted a decrease in disease prevalence potentially causing an artificial increase in specificities and negative predictive values. Because our previous experience with a similar population had shown us about 10 interpretable vessels in each patient by 16 × 0.5‐MDCTA (2004 pilot study) we decided to enrol 30 patients in total, anticipating around 300 evaluable arteries.
Standard descriptive statistics were expressed as means and medians. Owing to an asymmetrical distribution, calcification levels were expressed as medians and ranges. Fisher's exact test was used to calculate the diagnostic accuracy of 32 × 0.5‐MDCTA compared with QCA for identification of ⩾ 50% and ⩾ 70% stenoses. The Mann‐Whitney test was implemented for comparison between different calcium scores in grafted versus non‐grafted vessels, and multiple linear and logistic regression analyses were performed to control for numerous variables possibly related to coronary calcification. We used the statistical package Stata/SE 8 (StataCorp LP, College Station, Texas, USA).
RESULTS
CCA and 32 × 0.5‐MDCTA were performed without complications and data from all 30 patients were included in the ultimate comparative analysis. The mean (SD) interval between CCA and 32 × 0.5‐MDCTA was 18 (12) days (median 17). Seventeen of 369 vessels (5%) had < 1.5 mm diameter by QCA and were ineligible for comparison. Of 352 eligible vessels, 283 (80%) (256 native arteries and 27 bypass grafts) were interpretable by 32 × 0.5‐MDCTA.
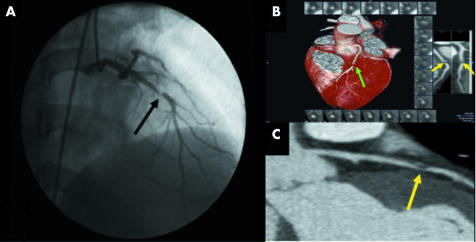
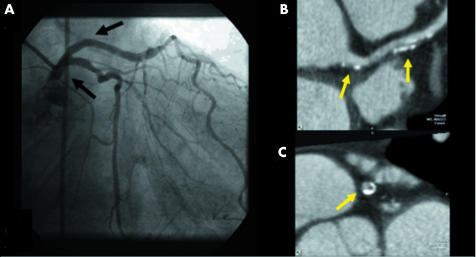
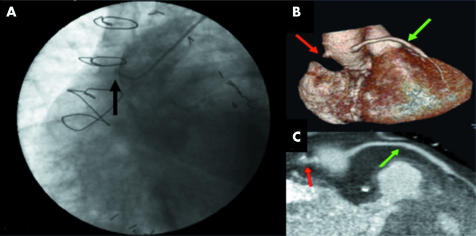
Coronary 32 × 0.5‐MDCTA was able to discriminate obstructive (fig 2) from non‐obstructive (fig 3) atherosclerotic lesions in the native bed, as well as to determine patency of bypass grafts (fig 4).
Figure 2 Obstructive lesion in the mid left anterior descending coronary artery (LAD) by (A) conventional angiography (black arrow) and by (B) 32×0.5‐MDCTA three dimensional volume rendered (green arrow) and (C) two dimensional CPR images (yellow arrows).
Figure 3 Non‐obstructive lesions in the left main (LM) and proximal LAD whose lumens are shown as normal by (A) conventional angiography (black arrows) and by (B) 32×0.5‐MDCTA two dimensional CPR (yellow arrows) and (C) cross sectional images (yellow arrow). Note that the calcified spots did not interfere with luminal analysis in both two dimensional planes.
Figure 4 (A) Occluded saphenous vein graft by conventional angiography (black arrow). (B) This same occluded graft (red arrows) and a patent one (green arrows) as depicted by 32×0.5‐MDCTA three dimensional volume rendered and (C) two dimensional CPR images.
Fifty and seventy per cent stenoses
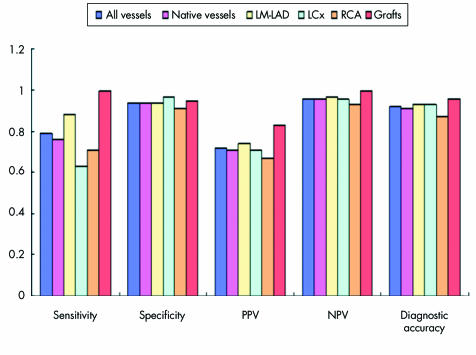
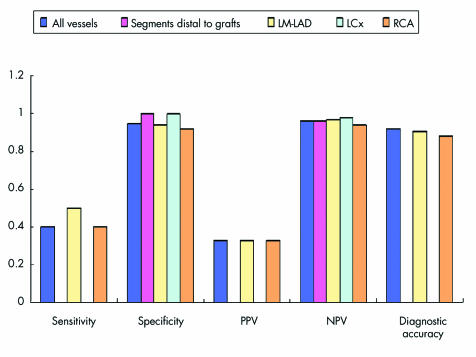
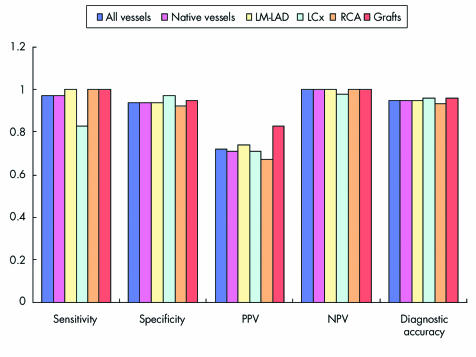
Figures 5–7 detail sensitivity, specificity, positive and negative predictive values, and diagnostic accuracy of 32 × 0.5‐MDCTA to detect ⩾ 50% and ⩾ 70% stenoses in major coronary territories. Figure 6 shows the same diagnostic measurements to detect ⩾ 50% stenoses exclusively in segments without grafts and in those distal to bypass graft anastomoses.
Figure 5 Bar graphs illustrating diagnostic measurements obtained by 32×0.5‐MDCTA in comparison with quantitative coronary angiography (QCA). Screening for 50% stenoses in all vessels combined, native vessels, LM‐LAD, LCx, RCA, and bypass grafts obtained the following results: sensitivity (34/43 (79%), 29/38 (76%), 14/16 (88%), 5/8 (63%), 10/14 (71%), and 5/5 (100%), respectively); specificity (207/220 (94%), 190/202 (94%), 75/80 (94%), 64/66 (97%), 51/56 (91%), and 18/19 (95%), respectively); positive predictive value (PPV) (34/47 (72%), 29/41 (71%), 14/19 (74%), 5/7 (71%), 10/15 (67%), and 5/6 (83%), respectively): negative predictive value (NPV) (207/216 (96%), 190/199 (96%), 75/77 (97%), 64/67 (96%), 51/55 (93%), and 18/18 (100%), respectively); and diagnostic accuracy (241/263 (92%), 219/240 (91%), 89/96 (93%), 69/74 (93%), 61/70 (87%), and 23/24 (96%), respectively).
Figure 6 Screening for 50% stenoses in all native vessels without grafts and in segments distal to bypass graft anastomoses, as well as in these same vessels according to their distribution among the three major coronary territories (LM‐LAD, LCx, and RCA), obtained the following results: sensitivity (4/10 (40%), 0/1, 2/4 (50%), 0/1, and 2/5 (40%), respectively); specificity (152/160 (95%), 23/23 (100%), 62/66 (94%), 43/43 (100%), and 47/51 (92%), respectively); PPV (4/12 (33%), 0/0, 2/6 (33%), 0/0, and 2/6 (33%), respectively); NPV (152/158 (96%), 23/24 (96%), 62/64 (97%), 43/44 (98%), and 47/50 (94%), respectively); and diagnostic accuracy (156/170 (92%), not calculated, 64/70 (91%), not calculated, and 49/56 (88%)). Note: Sensitivities and PPVs are missing for the segments distal to bypass graft anastomoses and LCx territory because either the numerator or the denominator was zero. Consequently, overall diagnostic accuracy could not be calculated for these territories.
Figure 7 Screening for 70% stenoses in all vessels combined, native vessels, LM‐LAD, LCx, RCA, and bypass grafts obtained the following results: sensitivity (34/35 (97%), 29/30 (97%), 14/14 (100%), 5/6 (83%), 10/10 (100%), and 5/5 (100%), respectively); specificity (215/228 (94%), 198/210 (94%), 77/82 (94%), 66/68 (97%), 55/60 (92%), and 18/19 (95%), respectively); PPV (34/47 (72%), 29/41 (71%), 14/19 (74%), 5/7 (71%), 10/15 (67%), and 5/6 (83%), respectively); NPV (215/216 (100%), 198/199 (100%), 77/77 (100%), 66/67 (98%), 55/55 (100%), and 18/18 (100%), respectively); and diagnostic accuracy (249/263 (95%), 227/240 (95%), 91/96 (95%), 71/74 (96%), 65/70 (93%), and 23/24 (96%), respectively).
Calcium scores
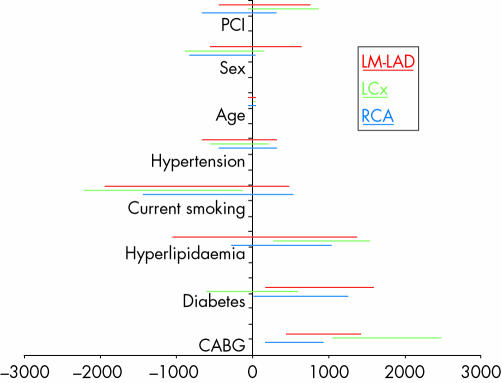
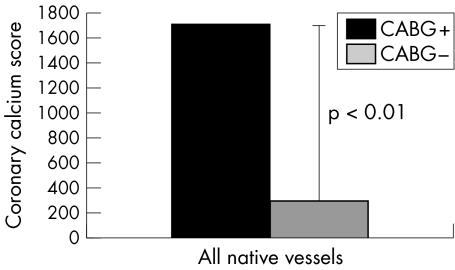
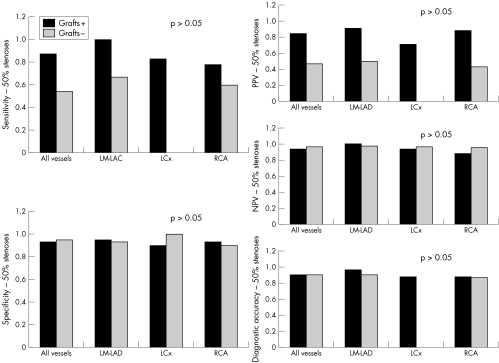
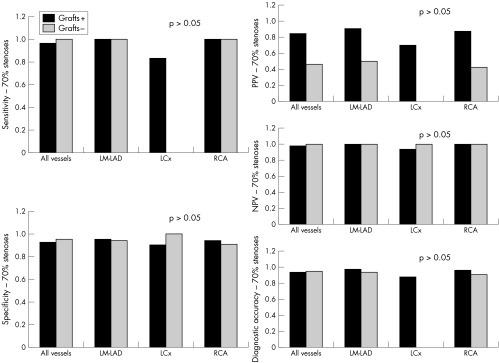
Total Agatston scores ranged from 3–5066 (median 510). Feeding from a bypass graft was the strongest predictor of vessel calcification (figs8 and 9). However, the degree of calcification did not modify 32 × 0.5‐MDCTA's ability to exclude ⩾ 50% and ⩾ 70% stenoses (figs 10 and 11).
Figure 8 Multiple regression analysis showing the 95% confidence intervals of potential risk factors for coronary calcification for each major coronary territory (LM‐LAD, LCx, and RCA). Prior coronary artery bypass grafting (CABG) was the strongest predictor of vessel calcification in this group of patients with advanced coronary artery disease, followed by diabetes.
Figure 9 Comparison of the degree of calcium deposits in the walls of native coronary arteries receiving as opposed to those not receiving blood from a bypass graft. The difference in Agatston calcium scores between native vessels connected (median 1710) and not connected (median 291) to a bypass graft (either arterial or venous) was highly significant (p < 0.01).
Figure 10 Diagnostic measurements for the 50% threshold showed no significant differences in the performance of 32×0.5‐MDCTA between the more (grafted) and less (non‐grafted) calcified native arteries. Note that sensitivity and PPV are missing for the non‐grafted LCx territories because either the numerator or the denominator was 0. Consequently, overall diagnostic accuracy could not be calculated for these territories.
Figure 11 Diagnostic measurements for the 70% threshold showed no significant differences in the performance of 32×0.5‐MDCTA between the more (grafted) and less (non‐grafted) calcified native arteries. Note that sensitivity and PPV are missing for the non‐grafted LCx territories because either the numerator or the denominator was 0. Consequently, overall diagnostic accuracy could not be calculated for these territories.
Uninterpretable vessels
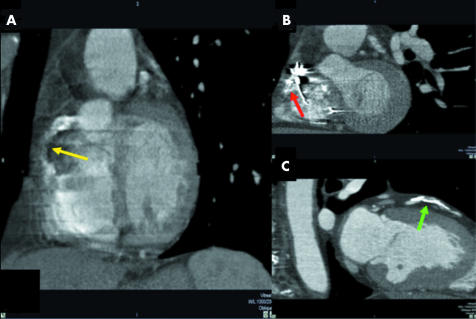
Of 352 major coronaries, first order branches, and bypass grafts evaluated, 69 (20%) were uninterpretable by 32 × 0.5‐MDCTA. Of these, 64 (93%) were first order branches and five (7%) were main arteries (all RCAs). Uninterpretability was attributed to the following artefacts: motion, noise, and low contrast enhancement either isolated or most commonly in combination in 45(65%), especially in the more distal segments of the LCx and RCA; image distortion by an ICD or pacemaker lead in 18(26%), exclusively in the RCA; and excessive blooming secondary to severe calcification in six (9%), especially in first order branches (fig 12).
Figure 12 Uninterpretable RCAs due to artefacts caused by (A) motion (yellow arrow) and (B) an implantable cardioverter‐defibrillator lead (red arrow). (C) First diagonal branch excluded by severe calcification (green arrow).
DISCUSSION
This is the first study to address exclusively patients with advanced CAD and high calcium scores by MDCTA. We showed that coronary 32 × 0.5‐MDCTA correctly excludes ⩾ 50% and ⩾ 70% stenoses in such a challenging scenario. Specificities in the native territories ranged between 91–97% for ⩾ 50% stenoses and between 92–97% for ⩾ 70% stenoses, and negative predictive values varied from 93–97% and from 98–100%, respectively. When ⩾ 50% stenoses in native segments without grafts and in those distal to bypass graft anastomoses were analysed separately, specificities and negative predictive values remained high, ranging between 92–100% and between 94–98%, respectively (fig 5–7).
Most previous studies of coronary MDCTA of native arteries evaluated ⩾ 50% stenoses.2,3,4,5,6 For this same cut off, sensitivities and positive predictive values were high in the left main‐LAD and bypass grafts in this study. However, lower sensitivities were observed in the LCx and RCA even though specificities and negative predictive values were as high as in other vessels. The lower performance of 32 × 0.5‐MDCTA in identifying ⩾ 50% stenoses in the LCx and RCA territories of such patients was largely secondary to smaller lumens in their distal branches, whose diameters tended to be closer to the minimum threshold of 1.5 mm chosen for inclusion in our comparative analysis. In addition, a particularly greater amount of motion artefacts was noted in these same territories. Nevertheless, even though the population in this study seemed to have more widespread and complex disease, the results showing 32 × 0.5‐MDCTA's ability to exclude ⩾ 50% stenoses are comparable with those of earlier studies with 12 × 0.75‐, 16 × 0.75‐, 16 × 0.5‐, and 64 × 0.6‐MDCTA in populations with apparently milder CAD and overall less calcified vessels.3,4,5,6,7,8,9
Owing to frequent native vessel occlusion at the site of a significant stenosis secondary to competitive flow after surgical revascularisation, patients with previous coronary artery bypass grafting seem to derive clinical benefit from assessment of coronary stenoses in vessels without grafts and in segments distal to bypass graft anastomoses.14 When we restricted our analysis of ⩾ 50% stenoses to these vessels, specificities varied between 92–100% and negative predictive values from 94–98%. However, sensitivities and positive predictive values decreased considerably in this subset of vessels, probably as a consequence of the large decrease in disease prevalence from 16% to 6% after exclusion of all segments proximal to the anastomoses.
Because the number of vessels with ⩾ 70% stenoses has long been known to be an important prognostic factor in patients with CAD, we investigated this new system's assessment of such an important threshold.15 In this study, the performance profile of 32 × 0.5‐MDCTA was robust in that it underestimated solely an 80% lesion as measured by QCA. Moreover, the overall sensitivity of 32 × 0.5‐MDCTA was 97%, illustrating its ability not only to exclude but also to identify ⩾ 70% stenoses in native arteries of patients with advanced CAD and high calcium scores, with an overall diagnostic accuracy of 95%.
Coronary calcification
Multidetector row CT and electron beam CT are equivalent for calcium score measurement.16 Therefore, with a median Agatston score of 510 by non‐contrasted 32 × 0.5‐MDCTA and 63% (19 of 30) of patients having scores > 400, this was a population with high calcium scores.11
Calcified vessels are a strong limitation to current 16 detector row MDCTA systems.5,6 Hoffmann et al6 attributed to calcification 94% (18 of 19) of their false positive results for detection of ⩾ 50% stenoses in native coronaries by 16 × 0.75‐MDCTA. Likewise, Dewey et al,5 while studying a similar number of patients by 16 × 0.5‐MDCTA, reported that 100% (five of five) of their false positive results were due to severely calcified segments. Unfortunately, these authors did not quantify the amount of calcium in their analyses.
In the present study, we showed that the diagnostic accuracy of 32 × 0.5‐MDCTA was much less affected by vessel calcification. In fact, our seemingly paradoxical higher sensitivities and positive predictive values for detection of ⩾ 50% and ⩾ 70% stenoses in grafted and more calcified vessels were probably due to a greater disease prevalence in these vessels (32% and 30%, respectively) than in those without grafts and with less calcium deposition (8% and 4%, respectively).
It has been suggested that atherosclerosis progression is more pronounced in surgically revascularised coronary arteries.14 We found that feeding from a bypass graft was the strongest predictor of vessel calcification in this group of patients, even after controlling for variables such as age and diabetes (fig 8). Even though our sample size was small for this type of analysis and because our finding can be explained by the greater tendency to surgically revascularise more severely diseased vessels, we believe that it deserves further investigation.
Interpretability
The relatively high number of uninterpretable vessels found in this study, namely, 20% (69 of 352), can be attributed partly to the advanced stage of atherosclerosis in this subset of patients and predominantly to diffusely narrowed vessels associated with advanced CAD. A combination of artefacts such as motion, noise, and low contrast enhancement was the most important limitation especially for evaluation of the distal LCx and RCA.
Calcification was responsible for only 9% (six of 69) of uninterpretable vessels, however, being restricted to a small amount of first order branches. In our previous experience with 16 × 0.5‐MDCTA (our 2004 pilot study) we were unable to analyse a few coronary lumens where blooming secondary to calcium deposits seemed to look even worse because of superimposed motion artefacts. In these cases, we tended to designate calcification as the reason for uninterpretability. Since the spatial and temporal resolutions of 16 × 0.5‐ and 32 × 0.5‐MDCTA are essentially the same, and because 32 × 0.5‐MDCTA is expected to cause fewer motion artefacts (because of shorter breath holds and fewer heart beats throughout image acquisition), it is possible that the real reason for misinterpretation in some of the cases analysed by 16 detector row MDCTA was the presence of underestimated motion and not overestimated calcification.5,6
Advantages of 32 × 0.5‐MDCTA
The breath hold time for a typical coronary study (coverage of about 120 mm in the z axis direction) by 32 × 0.5‐MDCTA is only 12 seconds. This is particularly important for imaging older or critically ill patients. Our ability to image highly calcified vessels adequately, as discussed above, as well as more severely diseased patients, including those with ICDs and very low left ventricular ejection fractions, suggests that this reduced scanning time is an important feature in overcoming some of the limitations of 16 detector row MDCTA. Moreover, because heart rhythm and frequency control devices such as ICDs and permanent pacemakers are becoming increasingly more common in patients with advanced CAD and traditionally constitute an absolute contraindication to magnetic resonance imaging, 32 × 0.5‐MDCTA emerges as an alternative to tomographic imaging of these patients with high temporal and spatial resolution, even though we have noticed limitations in the evaluation of the RCA in a few patients in this study.17
We conclude that coronary 32 × 0.5‐MDCTA reliably excludes ⩾ 50% and ⩾ 70% stenoses in vessels with a luminal diameter ⩾ 1.5 mm in a population with complex and advanced atherosclerotic disease regardless of calcification degree and territory location (left main, LAD, LCx, or RCA). Such results highlight the possibility of its present use in the follow up of patients with established chronic CAD, as well as, in the future, in the risk stratification of patients with chest pain and an intermediate likelihood of CAD.
Acknowledgements
This work was funded by the National Institutes on Aging (Bethesda, MD), grant RO1‐AG021570‐01, and by The Johns Hopkins Reynolds Cardiovascular Center (D W Reynolds Foundation, Las Vegas, NV), and was partly supported by Toshiba Medical Systems Corporation (Otawara, Japan). Dr Cordeiro is funded by the Brazilian National Research Council (CNPq, Brasília, DF, Brazil) as a postdoctoral fellow (fellowship grant 202706/02‐8) in the Division of Cardiology of The Johns Hopkins University School of Medicine (Baltimore, MD).
Abbreviations
32×0.5‐MDCTA - half millimetre 32 detector row computed tomography angiography
CAD - coronary artery disease
CCA - conventional coronary angiography
CT - computed tomography
ICD - implantable cardioverter‐defibrillator
LAD - left anterior descending
LCx - left circumflex
MDCTA - multidetector row computed tomography angiography
QCA - quantitative coronary angiography
RCA - right coronary artery
Footnotes
*Also the Departments of Radiology, Biomedical Engineering, and Surgery
†Also the Department of Radiology
References
- 1.Keane D, Haase J, Slager C J.et al Comparative validation of quantitative coronary angiography systems: results and implications from a multicenter study using a standardized approach. Circulation 1995912174–2183. [DOI] [PubMed] [Google Scholar]
- 2.Nieman K, Oudkerk M, Rensing B J.et al Coronary angiography with multi‐slice computed tomography. Lancet 2001357599–603. [DOI] [PubMed] [Google Scholar]
- 3.Nieman K, Cademartiri F, Lemos P A.et al Reliable noninvasive coronary angiography with fast submillimeter multislice spiral computed tomography. Circulation 20021062051–2054. [DOI] [PubMed] [Google Scholar]
- 4.Ropers D, Baum U, Pohle K.et al Detection of coronary artery stenoses with thin‐slice multi‐detector row spiral computed tomography and multiplanar reconstruction. Circulation 2003107664–666. [DOI] [PubMed] [Google Scholar]
- 5.Dewey M, Laule M, Krug L.et al Multisegment and halfscan reconstruction of 16‐slice computed tomography for detection of coronary artery stenoses. Invest Radiol 200439223–229. [DOI] [PubMed] [Google Scholar]
- 6.Hoffmann U, Moselewski F, Cury R C.et al Predictive value of 16‐slice multidetector spiral computed tomography to detect significant obstructive coronary artery disease in patients at high risk for coronary artery disease: patient‐versus segment‐based analysis. Circulation 20041102638–2643. [DOI] [PubMed] [Google Scholar]
- 7.Leschka S, Alkadhi H, Plass A.et al Accuracy of MSCT coronary angiography with 64‐slice technology: first experience. Eur Heart J 2005261482–1487. [DOI] [PubMed] [Google Scholar]
- 8.Leber A W, Knez A, von Ziegler F.et al Quantification of obstructive and nonobstructive coronary lesions by 64‐slice computed tomography: a comparative study with quantitative coronary angiography and intravascular ultrasound. J Am Coll Cardiol 200546147–154. [DOI] [PubMed] [Google Scholar]
- 9.Raff G L, Gallagher M J, O'Neill W W.et al Diagnostic accuracy of noninvasive coronary angiography using 64‐slice spiral computed tomography. J Am Coll Cardiol 200546552–557. [DOI] [PubMed] [Google Scholar]
- 10.Eggen D A, Strong J P, McGill H C., Jr Coronary calcification: relationship to clinically significant coronary lesions and race, sex, and topographic distribution. Circulation 196532948–955. [DOI] [PubMed] [Google Scholar]
- 11.Rumberger J A, Brundage B H, Rader D J.et al Electron beam computed tomographic coronary calcium scanning: a review and guidelines for use in asymptomatic persons. Mayo Clin Proc 199974243–252. [DOI] [PubMed] [Google Scholar]
- 12.Agatston A S, Janowitz W R, Hildner F J.et al Quantification of coronary artery calcium using ultrafast computed tomography. J Am Coll Cardiol 199015827–832. [DOI] [PubMed] [Google Scholar]
- 13.Cordeiro M A S, Lardo A C, Brito M S V.et al CT angiography in highly calcified arteries: 2D vs. modified automated 3D approach to identify coronary stenoses. Int J Cardiovasc Imaging. (in press) [DOI] [PubMed]
- 14.Guthaner D F, Robert E W, Alderman E L.et al Long‐term serial angiographic studies after coronary artery bypass surgery. Circulation 197960250–259. [DOI] [PubMed] [Google Scholar]
- 15.Hammermeister K E, DeRouen T A, Dodge H T. Variables predictive of survival in patients with coronary disease: selection by univariate and multivariate analyses from the clinical, electrocardiographic, exercise, arteriographic, and quantitative angiographic evaluations. Circulation 197959421–430. [DOI] [PubMed] [Google Scholar]
- 16.Detrano R C, Anderson M, Nelson J.et al Coronary calcium measurements: effect of CT scanner type and calcium measure on rescan reproducibility. MESA study. Radiology 2005236477–484. [DOI] [PubMed] [Google Scholar]
- 17.Niehaus M, Tebbenjohanns J. Electromagnetic interference in patients with implanted pacemakers or cardioverter‐defibrillators. Heart 200186246–248. [DOI] [PMC free article] [PubMed] [Google Scholar]


