Abstract
Background
The systolic to diastolic arteriolar blood volume (aBV) ratio derived using myocardial contrast echocardiography (MCE) can identify the presence of coronary stenosis at rest. There are some patients with moderate to severe coronary stenosis who nonetheless exhibit a normal systolic to disatolic aBV ratio.
Aim
To test the hypothesis that collateral blood flow influences the systolic to diastolic aBV ratio. MCE‐defined phasic changes in aBV were recorded at baseline and up to 2 degrees of non‐critical stenosis in 12 dogs. Measurements were made from MCE‐defined collateralised and non‐collateralised portions of the left anterior descending arterial bed.
Results
Increases in both systolic and diastolic aBV were noted in the non‐collateralised region with increasing degrees of stenosis. Although these increases in the absolute values did not reach statistical significance, the systolic to diastolic aBV signal ratio in the non‐collateralised bed increased significantly between stages (analysis of variance, p = 0.003). In comparison, in the collateralised bed neither the absolute systolic nor diastolic aBV signals changed with increasing degrees of stenosis. Consequently, the aBV signal ratio between systole and diastole also did not change in this bed.
Conclusion
Phasic changes in aBV are influenced by the degree of collateral blood flow. Thus, if the region of interest is not placed in the centre of the vascular bed, the degree of stenosis may be underestimated by the systolic to diastolic aBV ratio. On the other hand, as extensive collateralisation may indicate excellent prognosis, this ratio may provide prognostic information independent of the coronary anatomy.
Owing to compensatory vasodilation of resistance arterioles distal to a coronary stenosis,1,2,3 resting coronary blood flow (CBF) remains constant until the stenosis exceeds 85% of the luminal diameter.4 We have recently shown in both a canine model and in humans that myocardial contrast echocardiography (MCE) can be used to detect this compensatory increase in arteriolar blood volume (aBV), thus allowing the detection of coronary stenosis at rest, without recourse to any form of stress.5,6
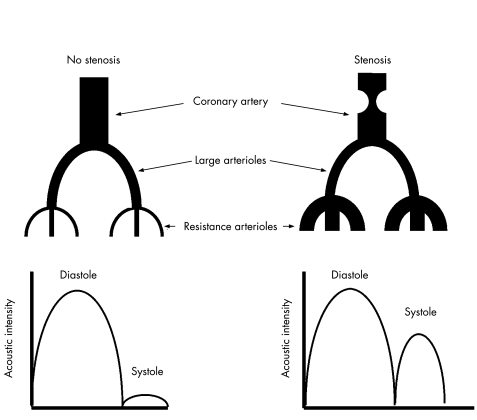
CBF occurs predominantly in diastole,7 and filling of the intramyocardial vessels with microbubbles produces a large diastolic signal on high mechanical index MCE (fig 1) using short ultrasound pulsing intervals.5,6 During systole, blood is propelled retrogradely from resistance arterioles into larger intramyocardial arterioles,7 but the signal on MCE is small because of the small aBV8 (fig 1). In the presence of a non‐critical coronary stenosis, aBV increases because of compensatory vasodilation of resistance vessels,1,2,3 so more blood is propelled retrogradely into larger intramyocardial vessels, resulting in a greater systolic signal and a larger systolic to diastolic aBV signal ratio (fig 1).5,6
Figure 1 Changes in resistance arterioles in the presence of a coronary stenosis and the effect on phasic myocardial contrast echocardiography signals obtained from the larger myocardial arterioles at high mechanical index and short pulsing intervals. See text for details.
There are some patients with moderate to severe coronary stenosis who nonetheless exhibit a low systolic to disatolic aBV ratio.6 We postulated that this could be due to collateral blood flow (collBF) in the myocardium subtended by the stenosis. collBF usually emanates from a non‐diseased or less diseased vessel so that aBV in collateralised regions will be smaller than non‐collateralised portions of the perfusion bed.
Methods
Animal preparation
The study was approved by the Animal Care and Use Committee and conformed to the American Heart Association Guidelines for Use of Animals in Research. Twelve anaesthetised, open‐chest dogs were used. Catheters were placed in both femoral veins for administration of fluids and microbubbles, and in the ascending aorta to measure the central aortic pressure. A screw occluder was placed on the mid‐portion of the left anterior descending coronary artery (LAD) to produce stenoses of varying severities. Ultrasonic time‐of‐flight flow probes (Series SC, Transonics, Ithaca, New York, USA) were placed on the LAD proximal to the screw occluder and on the proximal left circumflex coronary artery (LCx), and connected to a digital flowmeter (model T206, Transonics). A 20‐gauge polyethylene catheter was introduced into a side branch of the LAD to measure mean coronary artery pressure distal to the screw occluder.
All catheters and the flowmeter were connected to a multichannel recorder (Model 200‐1001, Triton Technology, San Diego, California, USA). Simultaneous CBF, pressures and electrocardiogram were acquired digitally into a computer and the signals were displayed continuously online using Labtech Notebook (Laboratory Technologies, Andover, Massachusetts, USA). The severity of the stenosis was judged by the difference between the mean aortic and distal LAD pressures. Total flow to the LAD bed was calculated by subtracting LCx flow at stenosis stages by that at baseline and adding the difference to the LAD flow.
Myocardial contrast echocardiography
MCE was performed with a phased‐array digital system (Sonos 7500, Philips Ultrasound, Andover, Massachusetts, USA) using a short‐axis view at the mid‐papillary muscle level. A latex water bath served as an acoustic interface between the transducer and the heart. Compression was set at 100% and all other system settings were optimised at the beginning of the experiment and held constant throughout. Real‐time (30 Hz) images were acquired for wall thickening analysis.
Imagent (IMCOR Pharmaceuticals, San Diego, California, USA) was used as the ultrasound contrast agent. We selected this agent because, for the high dose required to detect aBV, it produces the least posterior wall attenuation compared with other commercially available agents at the time this study was performed. Also, it is highly sensitive to ultrasound destruction, allowing us to use a relatively low mechanical index for destructive imaging at each pulse.
For measuring the LAD perfusion bed size and the extent of collBF in the bed, 5 ml of Imagent was diluted in 55 ml of saline and infused continuously at a rate of 125 ml/h during transient LAD occlusion. Intermittent ultraharmonic imaging was performed using a mechanical index of 0.3 to obtain end‐systolic images at short (2–3 cardiac cycles) and long (20 cardiac cycles) pulsing intervals.
For measurement of phasic changes in aBV, image depth and transmit focus were set at 6 and 3 cm, respectively, to image only the LAD bed. A large dose of microbubbles was used to define the small aBV.5,6 Consequently, 5 ml of Imagent was injected as a bolus over 1 s, followed by a 10 ml saline flush for 5 s. Imaging was performed using power modulation at 15 Hz and a mechanical index of 0.3. As the interval between frames is only 66 ms, microbubble replenishment of capillaries is prevented, as microbubbles have time to fill only larger intramyocardial vessels before being destroyed by the next ultrasound pulse.
Image analysis
For wall thickening analysis, the observer defined several epicardial and endocardial targets in each frame from end diastole to end systole. These points were automatically connected by cubic‐spline interpolation to derive epicardial and endocardial contours.9 To correct for systolic cardiac rotation, the junction of the left posterior and right ventricular free walls were defined over the epicardium in each frame, and 100 equidistant chords between the 2 contours were generated starting at this point. Each chord represents the shortest distance between the epicardial and endocardial contours. Chord lengths in the collateralised and non‐collateralised regions defined by MCE were automatically averaged. Plots of wall thickening over the entire systolic contraction sequence were automatically generated, with time represented in 25th centiles. Maximal wall thickening at any point in systole was taken to represent wall thickening in that region.9
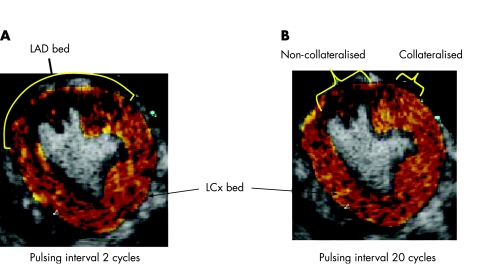
The size of the LAD perfusion bed was defined at short pulsing intervals (<2 or 3 cardiac cycles) during continuous infusion of contrast (fig 2A).10 Regions of the LAD supplied by collBF were defined at a long pulsing interval (20 cardiac cycles, fig 2B).10 Colour coding was applied to background‐subtracted images at each pulsing interval to visually enhance the myocardial signal and better define the borders of the LAD bed as well as the collateralised and non‐collateralised regions.11 For acoustic intensity measurements, an anti‐log function was applied to all images to linearise the values.12 As acoustic intensity at 20 cardiac cycles corresponds to relative blood flow,11 the acoustic intensities in the collateralised and non‐collateralised regions of the LAD bed were measured at this interval, and normalised to that in the LCx bed to derive the collateralisation index.
Figure 2 Method of defining the left anterior descending coronary artery (LAD) perfusion bed size (A) and the collateralised as well as non‐collateralised regions in the bed (B) using myocardial contrast echocardiography. LCx, Left circumflex coronary artery. See text for details.
For measuring phasic changes in aBV, regions of interest were placed over the MCE‐defined non‐collateralised and collateralised portions of the LAD bed on an end‐systolic frame. The corresponding regions of myocardium from all other frames were then manually aligned before measuring the myocardial acoustic intensity in all frames over three consecutive cardiac cycles. The background‐subtracted acoustic intensity values averaged from all three cycles at end diastole and end systole were used to define the systolic to diastolic aBV signal ratio.5
Experimental protocol
Haemodynamic and echocardiographic data were acquired at baseline. Up to two levels of stenosis were created in each dog in a random order. All data were re‐acquired at each stage. Finally, the LAD bed was occluded to define the LAD bed size, collateralised and non‐collateralised regions of the LAD bed, as well as the collateralisaton index. The dogs were euthanised with an overdose of potassium chloride and pentobarbital.
Statistical methods
Data are expressed as mean (1SD). Comparisons between stages were made by repeated‐measures analysis of variance. When differences were found between stages, Student's t test was performed to determine interstage differences with Bonferroni's correction for multiple comparisons. Correlations were sought with least squares regression analysis. A p value of <0.05 was considered significant (two sided).
Results
A total of 32 datasets were acquired from the 12 dogs during baseline and stenosis stages. Stenosis severity was categorised on the basis of the trans‐stenotic pressure gradient as moderate (12–25 mm Hg) or severe (>25 mm Hg). Table 1 depicts the haemodynamic and wall thickening results. Heart rate and mean aortic pressure remained constant during all stages. By definition, the trans‐stenotic pressure gradient increased with increasing stenosis severity. Although it did not reach statistical significance, LAD CBF tended to decline with increasing stenosis severity, whereas LCx CBF tended to increase, so that total flow to the LAD bed remained unchanged between stages. The lack of decrease in LAD CBF and lack of increase in LCx CBF may be due to LAD–LAD collaterals. Also, the first septal perforator in the dog can come off the left main and supply collaterals to the LAD. As there was no change in LAD CBF, percentage wall thickening in both the collateralised and non‐collateralised portions of the LAD bed, which were similar at baseline, also remained unchanged. No change was also recorded in percentage wall thickening in the non‐stenosed LCx perfusion bed.
Table 1 Haemodynamic, coronary blood flow and wall thickening results (mean (1SD)).
| Baseline (n = 12) | Moderate stenosis (n = 8) | Severe stenosis (n = 12) | p Value (ANOVA) | |
|---|---|---|---|---|
| Heart rate (bpm) | 128 (9) | 126 (6) | 126 (7) | 0.88 |
| Mean AoP (mm Hg) | 114 (10) | 112 (10) | 112 (11) | 0.82 |
| Mean CAP (mm Hg) | 114 (10) | 90 (10) | 78 (12) | <0.001 |
| Mean trans‐stenotic gradient (mm Hg) | 1 (1) | 22 (2) | 34 (4) | <0.001 |
| LAD CBF (ml/min) | 19.5 (5.8) | 15.5 (5.5) | 13.5 (4.8) | 0.18 |
| LCx CBF (ml/min) | 22.7 (3.7) | 26.7 (5.1) | 27.5 (4.6) | 0.16 |
| Total CBF to LAD bed (ml/min) | 19.5 (5.8) | 19.5 (5.8)* | 18.5 (4)* | 0.93 |
| % WT LAD bed (non‐collataralised zone) | 32.7 (1.4) | 32.6 (1.3) | 32.6 (1.5) | 0.95 |
| % WT LAD bed (collateralised zone) | 33.0 (1.8) | 32.6 (1.4) | 32.6 (1.4) | 0.84 |
| %WT LCx bed | 32.2 (0.3) | 32.3 (0.7) | 31.9 (0.5) | 0.78 |
ANOVA, analysis of variance; AoP, aortic pressure; CAP, coronary artery pressure; CBF, coronary blood flow; LAD, left anterior descending coronary artery; LCx, left circumflex coronary artery; WT, wall thickening.
*Derived by adding LAD CBF to the increase in LCx CBF.
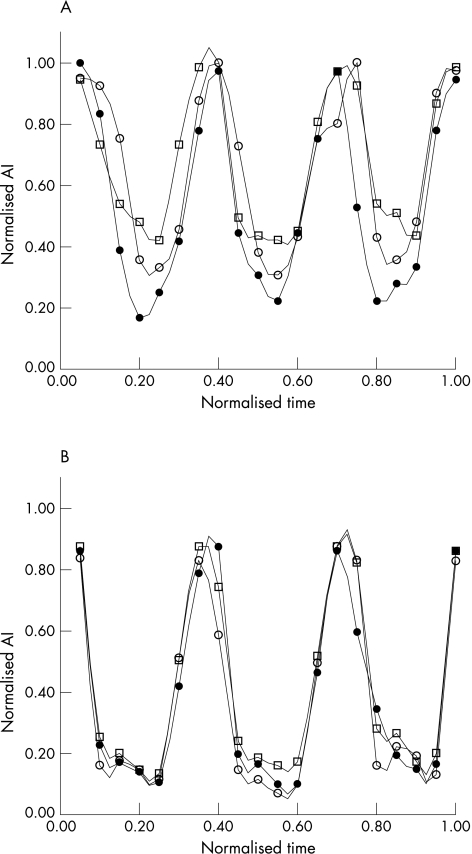
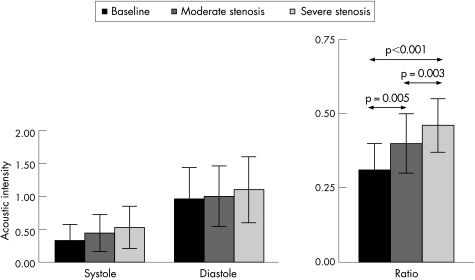
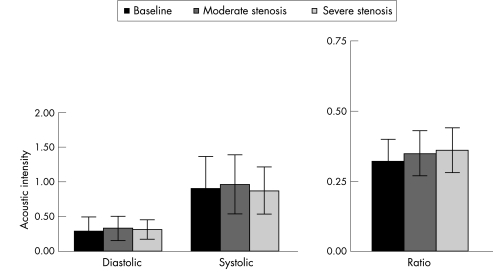
Figure 3 illustrates phasic changes in aBV signal from a single dog from the non‐collateralised (panel A) and collateralised (panel B) regions of the LAD bed at baseline and at two increasing levels of stenosis. A progressive increase in the systolic signal is noted in the non‐collateralised region, whereas the collateralised region shows no change in the systolic signal with increasing levels of stenosis. When data from all 12 dogs were combined, increases in both systolic and diastolic aBV were noted in the non‐collateralised region with increasing degrees of stenosis (fig 4). Although these increases in the absolute values did not reach statistical significance, the systolic to diastolic aBV signal ratio in the non‐collateralised bed increased significantly between stages (analysis of variance p = 0.003). In comparison, in the collateralised region, neither the absolute systolic nor diastolic aBV signals changed with increasing degrees of stenosis (fig 5). Consequently, the aBV signal ratio between systole and diastole also did not change in this bed. A cut off value of 0.4 for the systolic to diastolic aBV signal ratio at rest identified a relevant severe stenosis with a sensitivity of 82% and a specificity of 83%.
Figure 3 Phasic myocardial contrast echocardiography (MCE) signals obtained from the non‐collateralised (A) and collateralised (B) regions of the left anterior descending coronary artery perfusion bed on high mechanical index MCE performed at 15 Hz. See text for details. AI, acoustic intensity. Filled circle, no stenosis; open circle, mild stenosis; open square, moderate stenosis.
Figure 4 Diastolic and systolic acoustic intensity values and the systolic to diastolic arteriolar blood volume (aBV) ratio from the non‐collateralised region of the left anterior descending coronary artery bed at baseline and 2 levels of stenosis in the 12 dogs. The systolic to diastolic aBV ratio is significantly different (p = 0.003 by analysis of variance) between the three stages.
Figure 5 Diastolic and systolic acoustic intensity values and the systolic to diastolic arteriolar blood volume ratio from the collateralised region of the left anterior descending coronary artery bed at baseline and at 2 levels of stenosis in the 12 dogs. There are no differences between these values.
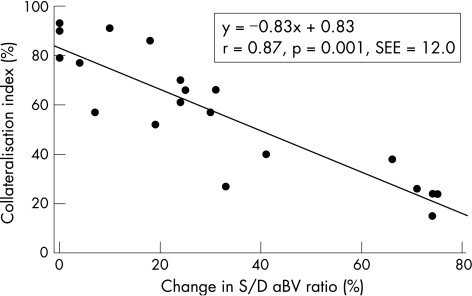
Figure 6 illustrates a strong linear relationship between the change in the systolic to diastolic aBV ratio between baseline and different degrees of stenosis versus the collateralisation index (a measure of collBF). When the LAD stenosis increased in severity, collBF to the LAD also increased proportionately. This increase was obviously more marked in the apparently collateralised compared with the non‐collateralised regions in the LAD bed.
Figure 6 Relationship between percentage change in the systolic to diastolic (S/D) arteriolar blood volume (aBV) ratio and the collateralisation index. See text for details.
Discussion
Gas‐filled microbubbles used as contrast agents during MCE exhibit an intravascular rheology that is similar to that of erythrocytes.13,14,15 When we quantify myocardial perfusion routinely on MCE, we destroy these microbubbles in the ultrasound beam and then measure their rate of myocardial replenishment.16 At end systole, because most of the aBV and venous blood volume has been milked out,17 the signal obtained is essentially from microbubbles in the capillaries, which have a mean velocity of about 1 mm/s at rest.15 Thus, it takes approximately 5 s to replenish all the capillaries in the 5 mm ultrasound beam elevation after microbubble destruction. As aBV is a very small fraction of the total myocardial blood volume,8 any increase in aBV distal to a stenosis secondary to autoregulation is not measurable using this method.
The velocity of microbubbles or erythrocytes in a blood vessel is proportional to the size of the blood vessel.18 Thus the velocity decreases from 1 m/s in the aorta to 1 mm/s in the capillaries. When we measure the acoustic intensity in the myocardium between two destructive ultrasound pulses, we are essentially measuring the blood volume of vessels that fill within the interval between these pulses. Thus, for an ultrasound beam with a width of 5 mm, if the pulses are 5 s apart, the acoustic intensity reflects vessels that fill with a mean velocity of 1 mm/s. If the pulses are 1 s apart, the acoustic intensity reflects vessels that fill with a mean velocity of 5 mm/s, and so on. In this manner, we can theoretically select a pulsing interval for any given ultrasound beam width at which the acoustic intensity will reflect a mean erythrocyte velocity in the resistance vessels (150–300 μm in diameter). If these vessels enlarge, the acoustic intensity should increase proportionately.
The problem with this approach is that when we select such a pulsing interval, not only does the acoustic intensity reflect the volume of the resistance vessels but also the volume of other vessels that may have partially filled within that interval. As the capillary to arteriolar ratio is very high in the myocardium, the backscatter from the bubbles in the partially filled capillaries will be much higher than that from the much fewer albeit fully filled arterioles. One way to overcome this problem is to use short pulsing intervals in which neither the smaller arterioles nor the capillaries fill, but only large intramyocardial arterioles fill. As these vessels do not participate in autoregulation, their aBV will not increase and neither will their backscatter during diastole. However, as in systole these vessels receive the retrogradely propelled blood from distal arterioles in systole,17 backscatter in systole will increase if the distal resistance vessels have more blood in them. Further, blood from any resistance vessels that have filled in the meanwhile will also be represented in this signal. This is the basis of our approach which we first validated in an animal model of coronary stenosis5 and then in humans.6 Using this approach, we can detect the presence of coronary stenosis at rest without recourse to any form of stress.
Although we saw a higher systolic to diastolic aBV ratio with greater degrees of stenosis in our experimental and human studies, we found considerable scatter in the results.5,6 Thus, even at moderate or severe levels of stenosis, we sometimes did not see the anticipated increase in the systolic to diastolic aBV ratio. We postulated that this could be due to collBF in the region subtended by the stenosis. CollBF usually emanates from a non‐diseased or less diseased vessel so that aBV in collateralised regions will be smaller than in the non‐collateralised areas. In this study, we have proved this to be the case.
Clinical implications
How does this affect our detection of coronary stenosis? It is clear that we should not simply measure the average systolic to diastolic aBV ratio over a vascular territory, but instead examine the ratio over each pixel in the region. This parametric approach would provide a spatial display of the systolic to diastolic aBV ratios in a region. In most patients with coronary stenosis, we will probably find that the ratio is the highest at the centre of a vascular territory and lowest at the borders. In some cases where the entire vascular bed is supplied by collBF, the ratio may be low throughout and we may not be able to detect coronary stenosis. However, in this instance, the prognosis of the patient may be excellent despite severe stenosis. Long‐term studies are required to prove this hypothesis. In any case, the presence of coronary stenosis in a symptomatic patient could still be confirmed by routine MCE methods.16
Limitations of the study
There are some limitations to our study. We derived the collateralisation index by measuring acoustic intensity at a long pulsing interval. Instead, we could have measured collBF by generating replenishment curves, but this would have required images at many pulsing intervals, which were not obtained. We did not measure myocardial blood flow in the LAD bed, but the constant total coronary flow and normal wall thickening in the LAD bed indicate that normal flow was maintained. Obviously, decreased flow would have resulted in regional dysfunction and the detection of coronary stenosis would have been moot.
We did not generate the parametric images as suggested above because we have not yet developed the software. This approach necessitates precise registration of pixels between diastolic and systolic images over a number of cardiac cycles, requiring advanced image analysis algorithms that we are in the process of developing. We hope to test this approach in humans in the foreseeable future.
Acknowledgements
Supported in part by grants from the National Institutes of Health, Bethesda, Maryland (R01‐EB‐002069) and IMCOR Pharmaceuticals (San Diego, California). The ultrasound equipment was provided by Philips Ultrasound (Andover, Massachussetts). Dr Micari was the recipient of an Italian Society of Cardiology‐Aventis Foundation Training Grant.
Abbreviations
aBV - arteriolar blood volume
collBF - collateral blood flow
CBF - coronary blood flow
LAD - left anterior descending coronary artery
LCx - left circumflex coronary artery
MCE - myocardial contrast echocardiography
Footnotes
Competing interests: None declared.
Presented in part at the 77th Annual Scientific Session of the American Heart Association, New Orleans, Louisiana, USA.
References
- 1.Rouleau J, Boerboom L E, Surjadhana A.et al The role of autoregulation and tissue diastolic pressures in the transmural distribution of left ventricular blood flow in anesthetized dogs. Circ Res 197945804–815. [DOI] [PubMed] [Google Scholar]
- 2.Lindner J R, Skyba D M, Goodman N C.et al Changes in myocardial blood volume with graded coronary stenosis: an experimental evaluation using myocardial contrast echocardiography. Am J Physiol 1997272H567–H575. [DOI] [PubMed] [Google Scholar]
- 3.Kanatsuka H, Lamping K, Eastham C L.et al Heterogenous changes in epimyocardial microvascular size during graded coronary stenosis. Evidence of the microvascular site for autoregulation. Circ Res 199066389–396. [DOI] [PubMed] [Google Scholar]
- 4.Gould K L, Lipscomb K. Effects of coronary stenoses on coronary flow reserve and resistance. Am J Cardiol 19743448–55. [DOI] [PubMed] [Google Scholar]
- 5.Wei K, Le E, Bin J P.et al Non‐invasive detection of coronary artery stenosis at rest without recourse to exercise or pharmacologic Stress. Circulation 2002105218–223. [DOI] [PubMed] [Google Scholar]
- 6.Wei K, Tong K L, Belcik T.et al Detection of coronary stenosis at rest with myocardial contrast echocardiography. Circulation 20051121085–1087. [DOI] [PubMed] [Google Scholar]
- 7.Chilian W M, Marcus M L. Phasic coronary blood flow velocity in intramural and epicardial coronary arteries. Circ Res 198250772–781. [DOI] [PubMed] [Google Scholar]
- 8.Kassab G S, Lin D H, Fung Y B. Morphometry of pig coronary venous system. Am J Physiol 1994267H2100–H2113. [DOI] [PubMed] [Google Scholar]
- 9.Sklenar J, Jayaweera A R, Kaul S. A computer‐aided approach for the quantification of left ventricular function using two‐dimensional echocardiography. J Am Soc Echocardiogr 1992533–40. [DOI] [PubMed] [Google Scholar]
- 10.Coggins M P, Sklenar, Le D E.et al Noninvasive prediction of ultimate infarct size at the time of acute coronary occlusion based on the extent and magnitude of collateral‐derived myocardial blood flow. Circulation 20011042471–2477. [DOI] [PubMed] [Google Scholar]
- 11.Linka A Z, Sklenar J, Wei K.et al Assessment of transmural distribution of myocardial perfusion with contrast echocardiography. Circulation 1998981912–1920. [DOI] [PubMed] [Google Scholar]
- 12.Jayaweera A R, Sklenar J, Kaul S. Quantification of images obtained during myocardial contrast echocardiography. Echocardiography 199411385–396. [DOI] [PubMed] [Google Scholar]
- 13.Keller M W, Segal S S, Kaul S.et al The behavior of sonicated albumin microbubbles within the microcirculation: a basis for their use during myocardial contrast echocardiography. Circ Res 198965458–467. [DOI] [PubMed] [Google Scholar]
- 14.Jayaweera A R, Edwards N, Glasheen W P.et al In‐vivo myocardial kinetics of air‐filled albumin microbubbles during myocardial contrast echocardiography: comparison with radiolabeled red blood cells. Circ Res 1994741157–1165. [DOI] [PubMed] [Google Scholar]
- 15.Lindner J R, Song J, Jayaweera A R.et al Microvascular rheology of Definity microbubbles after intra‐arterial and intravenous administration. J Am Soc Echocardiogr 200215396–403. [DOI] [PubMed] [Google Scholar]
- 16.Wei K, Jayaweera A R, Firoozan S.et al Quantification of myocardial blood flow with ultrasound induced destruction of microbubbles administered as a constant venous infusion. Circulation 199897473–483. [DOI] [PubMed] [Google Scholar]
- 17.Goto M, Flynn A E, Doucette J W.et al Cardiac contraction affects deep myocardial vessels predominately. Am J Physiol1991261H1417–H1429. [DOI] [PubMed] [Google Scholar]
- 18.Chien S, Usami S, Skalak R. Blood flow in small tubes. In: Renkin EM, Michel CC, eds. Handbook of physiology—Vol IV. The cardiovascular system Oxford: Oxford University Press, 1984217–249.


