Abstract
Retinoids, particularly all-trans-retinoic acid (RA), are potent regulators of cell differentiation, cell proliferation, and apoptosis. The role of all-trans-RA during development and in the maintenance of adult tissues has been well established. The control of all-trans-RA levels in cells and tissues is regulated by the balance between its biosynthesis and its catabolism to inactive metabolites. The cytochrome P450 enzyme P450RAI (herein renamed P450RAI-1) is partially responsible for this inactivation of all-trans-RA. In this report, we describe the identification, molecular cloning, and characterization of a second related enzyme, P450RAI-2, which is also involved in the specific inactivation of all-trans-RA. Transiently transfected P450RAI-2 can convert all-trans-RA to more polar metabolites including 4-oxo-, 4-OH-, and 18-OH-all-trans-RA. Competition experiments with other retinoids suggest that all-trans-RA is the preferred substrate. The high level of expression of P450RAI-2, particularly in the cerebellum and pons of human adult brain, suggests a unique role for this enzyme in the protection of specific tissues from exposure to retinoids.
All-trans-retinoic acid (RA) is a critical regulator of gene expression during embryonic development and in the maintenance of adult epithelial tissues (1–4). The effects of all-trans-RA are mediated by heterodimers of nuclear receptors for retinoic acid (RARs) and retinoid-X-receptors (RXRs), which are regulated by the 9-cis isomer of RA. Three different subtypes exist for each of these receptors (RARα, -β and -γ; RXRα, -β, and -γ), which individually are expressed in a tissue-specific manner but collectively can be found in essentially all cell types, both during embryonic development and in the adult (5). The activity of RA in these tissues is controlled, to a large extent, by enzymes involved in its synthesis from retinaldehyde [aldehyde dehydrogenase-1 (ALDH-1) and retinaldehyde dehydrogenase-2 (RALDH-2)] and its catabolism to 4-OH, 4-oxo, and 18-OH products (P450RAI) (6–10).
We and others have recently identified one enzyme specifically involved in all-trans-RA catabolism [P450RAI-1 (CYP26A) from zebrafish, mouse, human, chicken, and Xenopus] that is responsible for the metabolism of active all-trans-RA to inactive polar metabolites, including 4-OH-all-trans-RA (4-OH-RA), 4-oxo-all-trans-RA (4-oxo-RA), and 18-OH-all-trans-RA (18-OH-RA) (6, 10–15). P450RAI-1 expression can be induced by all-trans-RA pretreatment in multiple tissues and cell types, and this expression is concomitant with increased all-trans-RA catabolism. In MCF7 cells, all-trans-RA-inducible all-trans-RA metabolism depends on the continued presence of all-trans-RA, suggesting a feedback-loop mechanism for the regulation of all-trans-RA levels (6). Inducible expression of P450RAI-1 has also been observed in vivo in zebrafish, chicken, Xenopus, and mouse embryos, suggesting that this autoregulatory feedback-loop plays an important role in balancing all-trans-RA levels in certain developing tissues (6, 10–12, 15).
Studies from several groups show that tissues such as neural fold in chick embryos (10), caudal neuroepithelia (7, 13), and developing retina from mouse (8) express P450RAI-1 constitutively, thus forming a barrier to all-trans-RA exposure. Comparison of the expression patterns of RALDH-2 and P450RAI-1 in these models suggests that these enzymes act together to form regions of RA synthesis and activity (where RALDH-2 is expressed) bounded by regions restricting tissue from exposure to RA (where P450RAI-1 is expressed). RALDH-2-expressing tissues have been shown to contain retinoid activity as measured by both retinoid-responsive reporter gene activity and direct measurement of RA levels from tissue extracts; by similar analyses, P450RAI-1-expressing tissues do not (7, 8). In addition, overexpression of P450RAI-1 in Xenopus embryos has been shown to abrogate the teratogenic effects of exogenously applied RA, consistent with a catabolic role for this enzyme (15). In this report we describe the cloning and characterization of a second all-trans-RA-inducible, all-trans-RA-metabolizing cytochrome P450, P450RAI-2, which is predominantly expressed in brain, cerebellum in particular. Human P450RAI-2 shows 42% amino acid identity to human P450RAI-1 and, when transfected into COS-1 cells, causes the rapid conversion of all-trans-RA into more polar metabolites, including the inactive products 4-oxo-RA, 4-OH-RA, and 18-OH-RA. P450RAI-2, as with P450RAI-1, is also inducible in certain cultured cell lines exposed to all-trans-RA.
Materials and Methods
Identification of P450RAI-2 cDNA.
The human expressed sequence tag (EST) database at the National Center for Biotechnology Information (NCBI) was searched by using an amino acid sequence encoding a typical heme-binding motif found in all cytochrome P450s. A single human EST, AA012833 (3.5 kb) from the Soares retina N2b4H2 library, showed a high degree of amino acid similarity to human, mouse, Xenopus, and zebrafish P450RAI-1 (CYP26A), based on a blastx search of the nonredundant GenBank database. The EST was obtained from Research Genetics (Huntsville, AL) and sequenced.‖
Cloning of the Full-Length Cytochrome P450RAI-2 cDNA.
The full-length P450RAI-2 was amplified by using the PCR with an upstream primer encompassing the translation initiation codon, (5′-CAACATGCTCTTTGAGGGCTTGGATC-3′), and a second primer (5′-CAGCGGGGTGGTGGTTGTGGGAGGTAG-3′), which corresponded to sequence downstream of the assigned stop codon. Human retina Marathon-Ready cDNA (CLONTECH) was used as a template. A fragment approximately 1600 bp in length was PCR amplified by using conditions as outlined previously (16). For transient expression studies, the P450RAI-2 cDNA was subcloned into the EcoRI restriction endonuclease site of pcDNA3.1 (Invitrogen).
Cell Culture.
Cultured cells used for transient transfections or Northern blot analyses were maintained as previously described (6).
Transient Transfection of Cos-1 Cells.
Exponentially growing cells were plated in triplicate into six-well plates and transfected with 1 μg of pcDNA3.1-P450RAI-1 or pcDNA3.1-P450RAI-2 using Fugene 6 transfection reagent as described by the manufacturer (Roche Molecular Biochemicals).
Tissue Expression of P450RAI-2 and P450RAI-1.
The analyses of tissue expression of P450RAI-2 and P450RAI-1 were performed by probing a 76-tissue human poly(A)+ blot (CLONTECH) with full-length P450RAI-2 and P450RAI-1. [α-32P]dATP-labeled probes for the corresponding cDNAs were hybridized to blots by using the conditions as described by the manufacturers. A human brain multitissue Northern blot (CLONTECH) was also hybridized with full-length [α-32P]dATP-labeled P450RAI-2 probe according to the manufacturer's directions. The blots were stripped and re-probed with [α-32P]dATP-labeled ubiquitin and β-actin controls, as detailed by the manufacturer.
P450RAI-2 Inducibility in Cultured Cells.
Tissue culture cells were incubated with 1 μM all-trans-RA dissolved in DMSO or DMSO alone for 12 h. Total RNA was prepared by using Trizol reagent (Life Technologies), and a Northern blot analysis was performed. The blot was hybridized at 65°C by using ExpressHyb (CLONTECH) according to the manufacturer's directions. The blot was washed as follows: 2× SSPE and 0.1% SDS, two washes of 5 min each; 1× SSPE and 0.1% SDS, one wash of 15 min at 65°C; 0.1× SSPE and 0.1% SDS, one wash of 15 min at 65°C. The blot was exposed to x-ray film for 66 h.
Analysis of All-trans-RA Metabolism by HPLC.
Forty-eight hours posttransfection, cells were washed twice with DMEM (without serum) and then incubated in 0.5 ml of DMEM containing 10% FBS and either 100 nM radiolabeled all-trans-RA (0.1 μCi/ml [3H]RA; 5 nCi/nmol) or unlabeled 1 μM all-trans-RA. After incubation for 3 h at 37°C, in an environment protected from light, total lipids were extracted as described previously by Bligh and Dyer (17), as modified in ref. 11. The water-soluble retinoid metabolites were quantified by using β-scintillation counting. The organic-soluble metabolites were dried under nitrogen gas, resuspended in 100 μl of acetonitrile/water/acetic acid in the ratio 50:50:0.5, and analyzed by HPLC. HPLC separations were achieved by using a reverse-phase column (150 × 4.6 mm C18 Zorbax-SB, Hewlett Packard) with a water/acetonitrile/acetic acid gradient system (18). Effluent from the HPLC column flowed directly to a radioflow detector LB (EG & G Berthold, Bad Wildbad, Germany). The retinoids were detected at a wavelength of 351 nm, and the UV spectrum of each metabolite peak was determined by using photodiode array detection. Both radioactivity and UV spectral data were analyzed by using millenium 32 software (Waters). Water-soluble radioactivity (see Fig. 4) was calculated by integration of selected regions of the chromatograms. Three regions of the chromatograms were defined; they represent (i) the substrate peak (all-trans-RA); (ii) peaks with retention times between 8 and 12 min (4-OH region); and (iii) more polar peaks with retention times between 2 and 6 min (polar region).
Figure 4.
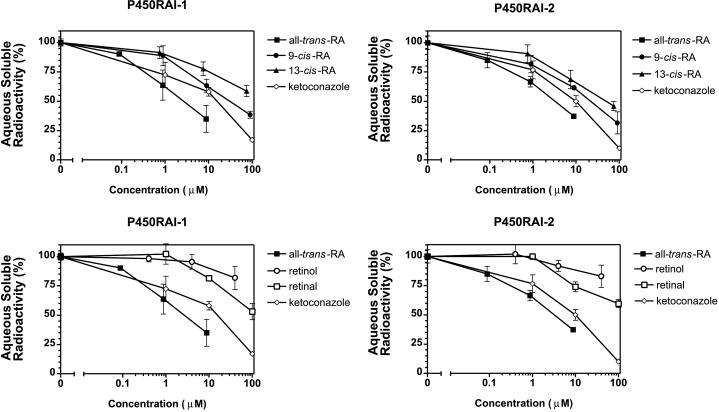
Competitive inhibition of P450RAI-mediated all-trans-RA metabolism. COS-1 cells transiently transfected with pcDNA3.1-P450RAI-2, pcDNA3.1-P450RAI-1, or pcDNA3.1 alone were used to assess the ability of several retinoids to competitively inhibit all-trans-RA metabolism. For comparison, the nonspecific cytochrome P450 inhibitor ketoconazole is shown in each panel.
Competition Assays.
COS-1 cells were transfected with either pcDNA3.1-P450RAI-1 or pcDNA3.1-P450RAI-2 in six-well tissue culture plates as described above. Forty-eight hours posttransfection, cells were harvested, pooled, washed with DMEM, and replated into duplicate 48-well plates with 5 × 10⁵ cells per well. The cells were incubated in 0.2 ml of DMEM containing 0.05 μCi/ml [3H]RA (final concentration 2 nM) in the presence or absence of increasing concentrations of each unlabeled retinoid (all-trans-RA, 9-cis-RA, 13-cis-RA, retinol, and retinal). Control cells were incubated with increasing concentrations of ketoconazole. After incubation for 3 h at 37°C, the retinoids were extracted by using the Bligh and Dyer (17) procedure, and the water-soluble RA metabolites were counted in a scintillation counter as described above. ID50 values represent the concentration of competitor required to inhibit all-trans-RA metabolism by 50% and were derived manually from log-transformed data.
Results
Cloning of the Full-Length P450RAI-2 cDNA.
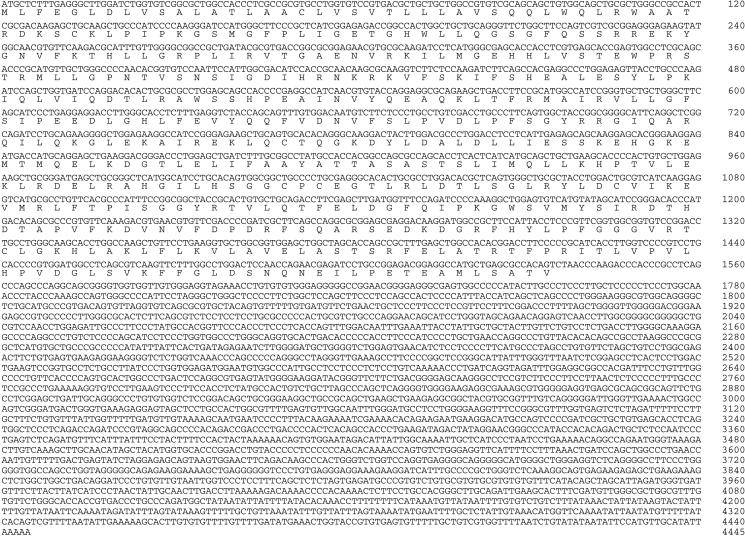
An EST clone from a human retinal cDNA library was identified in the GenBank EST database (accession no. AA012833); this clone showed significant homology to P450RAI-1 (CYP26A). By using PCR primers, a portion of the full-length cDNA, coding for the complete ORF, was amplified from human retinal cDNA. The cDNA sequence isolated from the retinal cDNA library encoding the ORF of P450RAI-2 is shown in Fig. 1. The 4,445-bp sequence from retina conceptually encodes a 512-amino acid protein. Identity between P450RAI-2 and its closest neighbor, P450RAI-1, is 42% absolute amino acid identity.
Figure 1.
Human P450RAI-2 cDNA sequence. The full-length cDNA clone was isolated from human retina cDNA. The deduced primary sequence, in single-letter code, identifies a 512-amino acid protein that is shown directly below the corresponding nucleotide sequence. Numbers indicate nucleotide positions.
All-trans-RA Metabolism by P450RAI-2.
When either plasmid (pcDNA3.1-P450RAI-2 or pcDNA3.1-P450RAI-1) was introduced into COS-1 cells, all-trans-RA substrate over the 3-h incubation period was extensively metabolized to more polar water-soluble products (Figs. 2 and 3). Fig. 2 shows comparative chromatograms of the lipid-soluble extracts from pcDNA3.1-P450RAI-2- (Fig. 2A), pcDNA3.1-P450RAI-1- (Fig. 2B), and pcDNA3.1-transfected cells (Fig. 2C). In both pcDNA3.1-P450RAI-2- and pcDNA3.1-P450RAI-1-transfected cells, the generation of multiple more polar peaks is observed. There is also a significant decrease in all-trans-RA substrate when compared with pcDNA3.1 controls (compare RA peaks in Fig. 2 A and B with C). Peaks labeled as 4-OH-RA, 4-oxo-RA, and 18-OH-RA coelute with standards of, and show characteristic UV spectra for, these metabolites. Additionally, multiple unidentified more-polar peaks (labeled 1–4; Fig. 2A), which show UV maxima characteristic of retinoids (data not shown), are generated and appear to be qualitatively similar in both P450RAI-2 and P450RAI-1 samples compared with controls.
Figure 2.
HPLC analysis of all-trans-RA metabolism in transfected COS-1 cells. Expression of either P450RAI-2 or P450RAI-1 in cells causes disappearance of all-trans-RA substrate (compare C with A or B) in addition to the generation of more polar metabolic products. Identities of the retinoids labeled as all-trans-RA, 4-OH-RA, 4-oxo-RA, and 18-OH-RA (A and B) were verified by coelution with known standards and comparison of the spectral properties by using photodiode array detection. Peaks labeled 1–4 (A) have spectral properties characteristic of retinoids, specifically UV maxima between 320 and 350 nm.
Figure 3.
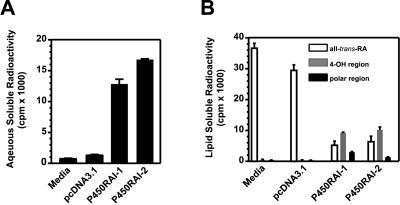
Metabolism of all-trans-RA in transfected COS-1 cells. Conversion of all-trans-RA to water-soluble metabolites is observed in P450RAI-2- or P450RAI-1-expressing cells compared with pcDNA vector or media alone control samples (A). Fractions from HPLC chromatography were grouped into three regions (all-trans-RA substrate, 4-OH region, and polar region), which allowed quantification of the different classes of retinoid metabolites.
To evaluate the efficiency of P450RAI-2 at more physiological concentrations of substrate, P450RAI-2-transfected cells were exposed to 100 nM radiolabeled all-trans-RA (Fig. 3). In these cells, 34 ± 0.2% of the all-trans-RA substrate is converted to water-soluble products compared with 26 ± 1.5% in the P450RAI-1-transfected cells (Fig. 3A). Controls, including media alone or pcDNA3.1-transfected cells, show 1.6 ± 0.1% (media alone) and 2.7 ± 0.2% (pcDNA3.1) conversion of substrate to water-soluble radioactivity.
We also evaluated the radioactivity remaining in the organic-soluble fraction in the transfected cells exposed to 100 nM all-trans-[3H]RA (Fig. 3B). HPLC analysis identified many more polar metabolites in both the P450RAI-2- and P450RAI-1-transfected cells compared with controls (data not shown). In media from cells transfected with pcDNA3.1-P450RAI-2 or pcDNA3.1-P450RAI-1, we observe a high degree of disappearance of substrate compared with controls. As well, there is a concomitant increase in the more polar lipid-soluble retinoid metabolites, which elute in both the 4-OH and polar regions of the chromatograms. These results clearly indicate that expression of either P450RAI-2 or P450RAI-1 causes substantial metabolism of all-trans-RA to more polar metabolites (Fig. 3B).
Retinoid Substrate Specificity of P450RAI-2.
Given the presence of two unique enzymes with the capacity to rapidly metabolize all-trans-RA, we were interested to evaluate the specificity of these two enzymes. Interestingly, both P450RAI-1 and P450RAI-2 show approximately equal efficiencies at metabolizing all-trans-RA (Figs. 3 and 4). We also evaluated the ability of five retinoids (all-trans-RA, 9-cis-RA, 13-cis-RA, retinal, and retinol) to compete out P450RAI-2- or P450RAI-1-mediated all-trans-RA metabolism (Fig. 4). The nonspecific cytochrome P450 inhibitor ketoconazole was also tested. These competition studies indicated that P450RAI-1 and -2 exhibit comparable substrate specificities, with all-trans-RA being the preferred substrate for both enzymes, having ID50 values of approximately 3.0 μM for P450RAI-2 and 2.5 μM for P450RAI-1. The other retinoids show varying abilities to compete out metabolism of all-trans-RA by P450RAI-2 and P450RAI-1 in the following rank order: 9-cis-RA > 13-cis-RA > retinal ≥ retinol (see Table 1 for interpolated ID50 values). Using microsomes prepared from stably transfected P450RAI-1 cells, we have also found the same relative levels of competition, suggesting that the differences in ID50 values are not due to differences in cellular uptake of the retinoids (data not shown).
Table 1.
Interpolated ID50 (μM) values
| Competitor | P450RAI-1 | P450RAI-2 |
|---|---|---|
| All-trans-RA | 2.5 | 3 |
| 9-cis-RA | 32 | 25 |
| 13-cis-RA | >75 | 55 |
| Retinol | >100 | >100 |
| Retinal | >100 | >100 |
| Ketoconazole | 16 | 16 |
Tissue Expression of P450RAI-2.
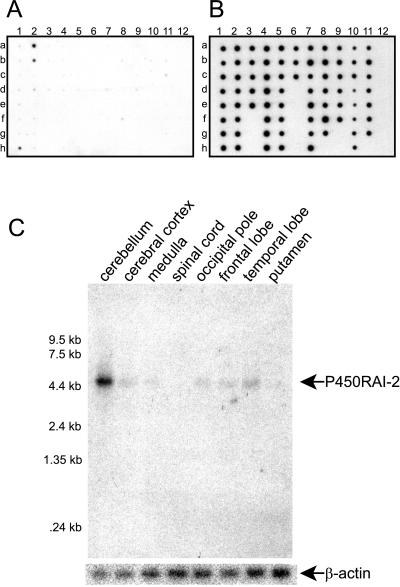
Using a multitissue RNA dot blot containing samples from 76 different normal human tissues, we evaluated the distribution of expression of P450RAI-2. Whereas most tissues appear to have detectable levels of P450RAI-2 expression, samples from human brain including pons (Fig. 5A, sample h1) and left and right cerebellum (Fig. 5A, samples a2 and b2, respectively) clearly show the highest levels of expression. In comparison, a similar blot probed with P450RAI-1 shows low level expression in most of the tissues, with the absence of a distinct signal in any of the corresponding tissues from human brain (data not shown). Blots shown in Fig. 5 A and B are representative of multiple hybridization experiments. Two independent blots were used, and each blot was hybridized with probes for P450RAI-2, P450RAI-1, and ubiquitin control (Fig. 5B) to verify the results.
Figure 5.
Expression of P450RAI-2 in human tissues. (A) RNA samples from 76 normal human tissues were probed for expression of P450RAI-2 transcripts by using a commercially available dot blot. Signals representing P450RAI-2 transcripts are observed in three samples, a2, b2, and h1, representing left and right cerebellum and pons, respectively. (B) Control hybridization with a human ubiquitin probe. (C) Northern blot analyses for expression of P450RAI-2 in human brain. Transcripts at approximately 5 kb corresponding to P450RAI-2 are indicated.
Given the apparent expression of transcripts for P450RAI-2 in distinct tissues from human brain, as observed on the multitissue RNA dot blot, we probed a Northern blot comprising mRNAs from various brain tissues. Fig. 5C shows the presence of a 5-kb transcript consistent with the size predicted by the cDNA clone. Consistent with the dot blot analyses, considerably higher levels of expression of transcripts for P450RAI-2 are seen in the cerebellum. Lower but detectable levels of expression are observed in cerebral cortex, medulla, occipital pole, frontal lobe, and temporal lobe.
Inducibility of P450RAI-2 Transcripts in Cultured Cells.
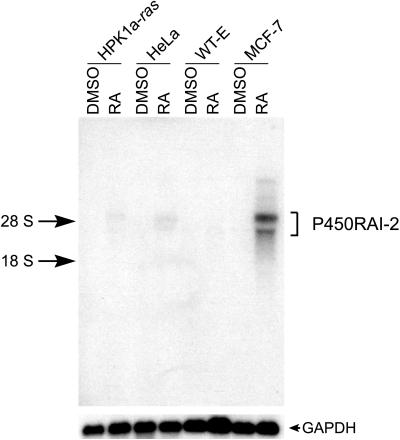
Several human cell lines in culture were tested for expression and induction of expression of P450RAI-2 by treating cells with 1 μM all-trans-RA or DMSO for 12 h followed by Northern blot (Fig. 6). Of the four cell lines tested by Northern analysis, three (HPK1a-ras, HeLa, and MCF-7) show induction of P450RAI-2 transcripts in response to all-trans-RA, with MCF-7 showing the strongest induction.
Figure 6.
All-trans-RA induction of P450RAI-2 expression. Northern blot analysis of cultured cells treated with all-trans-RA or vehicle (DMSO). Northern blot was hybridized to either P450RAI-2 cDNA or, for control of RNA loading, to glyceraldehyde-3-phosphate dehydrogenase (GAPDH) probe.
Discussion
We have identified an RA-metabolizing cytochrome P450. At least two genes encoding all-trans-RA-metabolizing enzymes P450RAI-1 (6, 19) and P450RAI-2 are expressed in humans. During the preparation of this manuscript, Nelson (20) predicted the amino acid sequence for a P450RAI-related sequence from an EST database search. This predicted sequence, which was named CYP26B1, is identical to that experimentally derived for P450RAI-2. The predicted amino acid sequences of these enzymes (P450RAI-1 and P450RAI-2) are 42% similar overall. Regions corresponding to functional domains, such as those for heme binding and putative substrate binding, exhibit the highest degrees of similarity. P450RAI-1 and -2 are also conserved across species from zebrafish to humans, suggesting that these enzymes may be functionally distinct (6, 18, 20). The genomic structures of these two genes are quite distinct; P450RAI-1 comprises seven exons, whereas P450RAI-2 has six, and there is no clear evidence of conserved intron/exon boundaries between the two genes (19, 20). These data support the possibility that these genes diverged from a common ancestral gene before the emergence of mammals.
P450RAI-2 can metabolize all-trans-RA with efficiency comparable to that of P450RAI-1. HPLC analysis comparing these enzymes reveals their striking similarities with respect to conversion of all-trans-RA into 4-OH- and 4-oxo-RA and characteristic secondary products. Moreover, P450RAI-1 and P450RAI-2 share surprisingly similar specificities for retinoids, as determined by our competition studies. The all-trans metabolite of RA is clearly the preferred substrate for both enzymes, with a rank-order all-trans-RA > 9-cis-RA > 13-cis-RA. In support of these findings, preliminary results from our laboratory by using Lineweaver–Burk analyses on kinetic data from microsomes from P450RAI-2- and P450RAI-1-transfected cells show that both enzymes have similar apparent Km values of 52 nM. Other retinoids, such as retinol and retinaldehyde, are very poor competitors, suggesting that they are unlikely to be natural substrates for these enzymes under normal physiological conditions. This observation is in contrast to a recent report suggesting that P450RAI (CYP26A) may be involved in the activation step of retinol (21). These similarities would suggest that, at least with respect to metabolic activity, these enzymes may be equivalent. Although this similarity in activity is somewhat surprising given their differences in sequence, there are many RA-binding proteins [RARs, RXRs, and cellular RA-binding protein (CRABP)] that are widely different in primary amino acid sequences. It is possible that the differences in sequence reflect differences in the abilities of these enzymes to interact with other proteins such as CRABPs that have been proposed to modify all-trans-RA metabolic activities in cells (22, 23).
Although the enzymatic activities of P450RAI-1 and -2 may be similar, it appears that their tissue-specific expression is not. Tissue dot blot and Northern blot analyses indicate that, in the adult, P450RAI-2 is broadly expressed at low levels in most tissues but is predominantly expressed in brain tissues, notably pons and cerebellum. P450RAI-1, on the other hand, does not show appreciable expression in any of the human brain tissues evaluated. It will be interesting to compare the patterns of expression of these enzymes during development, where numerous studies have indicated that the role of P450RAI-1 is to regulate local levels of all-trans-RA and restrict certain tissues from all-trans-RA activity. Developing retina exhibits an exquisite pattern of coordinated expression of P450RAI-1 and of the all-trans-RA-synthesizing enzymes RALDH-2 and ALDH-1 (8). That the EST corresponding to P450RAI-2 (accession no. AA012833) was derived from an adult retinal library suggests that this enzyme may also play a role in the balance of all-trans-RA in retinal tissue.
Expression of P450RAI-2 in adult human brain suggests that all-trans-RA may play an important homeostatic role in brain tissue. In this regard, it has recently been shown that all-trans-RA-signaling pathways may be important for memory and learning because RARβ/RXRα knockout mice have impaired long-term potentiation and limited ability to negotiate a water maze (24). If all-trans-RA-signaling pathways are involved in maintenance of higher order brain function, then the regulation and function of enzymes like P450RAI-2 will be important regulators of these pathways. The high level of expression of P450RAI-2 in adult cerebellum suggests that it is protecting this tissue from exposure to RA. Of note, developing cerebellum is highly sensitive to the teratogenic effects of RA (25, 26). Also, Yamamoto et al. (27) have reported evidence that RA may be synthesized from retinol in the choroid plexus of developing cerebellum, and that RA injected into the cerebellum is rapidly metabolized. These findings support the notion of an important role for RA metabolism in cerebellum during development that may also extend into adulthood. It is likely that this metabolism is mediated by P450RAI-2.
Studies of several cell lines in culture indicate that P450RAI-2 expression, similar to that of P450RAI-1, is regulated by all-trans-RA. For example, the induction by all-trans-RA of P450RAI-2 expression in the breast epithelial adenocarcinoma cell line MCF-7 is comparable to that of P450RAI-1. Transcriptional elements required for RA induction of P450RAI-1 have recently been characterized. A functional, conserved, canonical RA response element (RARE) is found within the first 200 bp of the P450RAI-1 promoter (28). Characterization of upstream regulatory elements within the P450RAI-2 gene will allow comparative studies of induction of these two genes at the transcriptional level and will help to discriminate possible similarities or differences in their regulation.
RA metabolism may be implicated in certain disease states, such as dermatological conditions and cancer. The present work suggests that certain brain functions may also depend on normal retinoid metabolism. There is interest in inhibiting this activity to increase the cell sensitivity to the differentiating or apoptotic affects of all-trans-RA; recent clinical trials with all-trans-RA metabolism inhibitors suggest that this may be a viable approach to treat diseases that respond positively to retinoids. The identification of a second P450RAI provides another potentially useful target for rational drug design.
Acknowledgments
Special thanks to Susanne Wittish and Karilene Montgomery for administrative assistance. Thanks also to James Chithalen, Department of Biochemistry, for helpful HPLC advice. This work was funded by Cytochroma Incorporated. G.J. and M.P. are supported by grants from the Medical Research Council of Canada and the National Cancer Institute of Canada.
Abbreviations
- RA
retinoic acid
- RAR
RA receptor
- RXR
retinoid X receptor
- 4-OH-RA
4-OH-all-trans-RA
- 4-oxo-RA
4-oxo-all-trans-RA
- 18-OH-RA
18-OH-all-trans-RA
- EST
expressed sequence tag
- ALDH-1
aldehyde dehydrogenase-1
- RALDH-2
retinaldehyde dehydrogenase-2
Footnotes
Data deposition: The sequences reported in this paper have been deposited in the GenBank database (accession no. AF252297).
Article published online before print: Proc. Natl. Acad. Sci. USA, 10.1073/pnas.120161397.
Article and publication date are at www.pnas.org/cgi/doi/10.1073/pnas.120161397
For information regarding reagents, e-mail info@cytochroma.com.
References
- 1.Gudas L, Sporn M, Roberts A. In: The Retinoids. Sporn M, Roberts A, Goodman D S, editors. New York: Raven; 1994. pp. 443–520. [Google Scholar]
- 2.Lotan R. FASEB J. 1996;10:1031–1039. doi: 10.1096/fasebj.10.9.8801164. [DOI] [PubMed] [Google Scholar]
- 3.Lotan R M. Cancer Treat Res. 1995;74:43–72. doi: 10.1007/978-1-4615-2023-8_3. [DOI] [PubMed] [Google Scholar]
- 4.Morriss-Kay G M, Sokolova N. FASEB J. 1996;10:961–968. doi: 10.1096/fasebj.10.9.8801178. [DOI] [PubMed] [Google Scholar]
- 5.Chambon P. FASEB J. 1996;10:940–954. [PubMed] [Google Scholar]
- 6.White J A, Beckett-Jones B, Guo Y D, Dilworth F J, Bonasoro J, Jones G, Petkovich M. J Biol Chem. 1997;272:18538–18541. doi: 10.1074/jbc.272.30.18538. [DOI] [PubMed] [Google Scholar]
- 7.Iulianella A, Beckett B, Petkovich M, Lohnes D. Dev Biol. 1999;205:33–48. doi: 10.1006/dbio.1998.9110. [DOI] [PubMed] [Google Scholar]
- 8.McCaffery P, Wagner E, O'Neil J, Petkovich M, Drager U C. Mech Dev. 1999;85:203–214. doi: 10.1016/s0925-4773(99)00132-x. [DOI] [PubMed] [Google Scholar]
- 9.Niederreither K, Subbarayan V, Dolle P, Chambon P. Nat Genet. 1999;21:444–448. doi: 10.1038/7788. [DOI] [PubMed] [Google Scholar]
- 10.Swindell E, Thaller C, Sockanathan S, Petkovich M, Jessell T, Eichele G. Dev Biol. 1999;216:282–296. doi: 10.1006/dbio.1999.9487. [DOI] [PubMed] [Google Scholar]
- 11.White J A, Petkovich M. In: Retinoid Protocols, Methods in Molecular Biology. Redfern C, editor. Vol. 89. Totowa, NJ: Humana; 1998. pp. 389–404. [DOI] [PubMed] [Google Scholar]
- 12.Abu-Abed S S, Beckett B R, Chiba H, Chithalen J V, Jones G, Metzger D, Chambon P, Petkovich M. J Biol Chem. 1998;273:2409–2415. doi: 10.1074/jbc.273.4.2409. [DOI] [PubMed] [Google Scholar]
- 13.Fujii H, Sato T, Kaneko S, Gotoh O, Fujii-Kuriyama Y, Osawa K, Kato S, Hamada H. EMBO J. 1997;16:4163–4173. doi: 10.1093/emboj/16.14.4163. [DOI] [PMC free article] [PubMed] [Google Scholar]
- 14.Ray W J, Bain G, Yao M, Gottlieb D I. J Biol Chem. 1997;272:18702–18708. doi: 10.1074/jbc.272.30.18702. [DOI] [PubMed] [Google Scholar]
- 15.Hollermann T, Chen Y, Grunz H, Pieler T. Eur Mol Biol Org. 1998;17:7361–7372. doi: 10.1093/emboj/17.24.7361. [DOI] [PMC free article] [PubMed] [Google Scholar]
- 16.Jones G, Strugnell S, DeLuca H F. Physiol Rev. 1998;78:1193–1231. doi: 10.1152/physrev.1998.78.4.1193. [DOI] [PubMed] [Google Scholar]
- 17.Bligh E G, Dyer W J. Can J Biochem. 1957;37:911–917. doi: 10.1139/o59-099. [DOI] [PubMed] [Google Scholar]
- 18.White J, Guo Y, Baetz K, Beckett-Jones B, Bonasoro J, Hsu K, Dilworth J, Jones G, Petkovich M. J Biol Chem. 1996;271:29922–29927. doi: 10.1074/jbc.271.47.29922. [DOI] [PubMed] [Google Scholar]
- 19.White J, Beckett B, Scherer S, Hebrick J, Petkovich M. Genomics. 1998;48:270–272. doi: 10.1006/geno.1997.5157. [DOI] [PubMed] [Google Scholar]
- 20.Nelson D. Arch Biochem Biophys. 1999;371:345–347. doi: 10.1006/abbi.1999.1438. [DOI] [PubMed] [Google Scholar]
- 21.Lane M, Chen A, Roman S, Derguini F, Gudas L. Proc Natl Acad Sci USA. 1999;96:13524–13529. doi: 10.1073/pnas.96.23.13524. [DOI] [PMC free article] [PubMed] [Google Scholar]
- 22.Boylan J, Gudas L. J Biol Chem. 1992;267:21486–21491. [PubMed] [Google Scholar]
- 23.Napoli J. FASEB J. 1996;10:993–1001. doi: 10.1096/fasebj.10.9.8801182. [DOI] [PubMed] [Google Scholar]
- 24.Chiang M Y, Misner D, Kempermann G, Schikorski T, Giguere V, Sucov H M, Gage F H, Stevens C F, Evans R M. Neuron. 1998;21:1353–1361. doi: 10.1016/s0896-6273(00)80654-6. [DOI] [PubMed] [Google Scholar]
- 25.Lammer E J, Chen D T, Hoar R M, Agnish N D, Benke P J, Braun J T, Curry C J, Fernhoff P M, Grix A J, Lott I T, et al. N Engl J Med. 1985;313:837–841. doi: 10.1056/NEJM198510033131401. [DOI] [PubMed] [Google Scholar]
- 26.Lammer E, Armstrong D. In: Retinoids in Normal Development and Teratogenesis. Morris-Kay G, editor. Oxford: Oxford Univ. Press; 1992. pp. 281–295. [Google Scholar]
- 27.Yamamoto M, Drager U, Ong D, McCaffery P. Eur J Biochem. 1998;257:344–350. doi: 10.1046/j.1432-1327.1998.2570344.x. [DOI] [PubMed] [Google Scholar]
- 28.Loudig, O., Babichuk, C., White, J., Abu-Abed, S., Mueller, C. & Petkovich, M. (2000) Mol. Endocrinol., in press. [DOI] [PubMed]


