

Abstract
Regulation of the structural equilibrium of G-quadruplex-forming sequences located in the promoter regions of oncogenes by the binding of small molecules has shown potential as a new avenue for cancer chemotherapy. In this study, microcalorimetry (isothermal titration calorimetry and differential scanning calorimetry), electronic spectroscopy (ultraviolet-visible and circular dichroism), and molecular modeling were used to probe the complex interactions between a cationic porphryin mesotetra (N-methyl-4-pyridyl) porphine (TMPyP4) and the c-MYC PU 27-mer quadruplex. The stoichiometry at saturation is 4:1 mol of TMPyP4/c-MYC PU 27-mer G-quadruplex as determined by isothermal titration calorimetry, circular dichroism, and ultraviolet-visible spectroscopy. The four independent TMPyP4 binding sites fall into one of two modes. The two binding modes are different with respect to affinity, enthalpy change, and entropy change for formation of the 1:1 and 2:1, or 3:1 and 4:1 complexes. Binding of TMPyP4, at or near physiologic ionic strength ([K+] = 0.13 M), is described by a “two-independent-sites model.” The two highest-affinity sites exhibit a K1 of 1.6 × 10⁷ M−1 and the two lowest-affinity sites exhibit a K2 of 4.2 × 10⁵ M−1. Dissection of the free-energy change into the enthalpy- and entropy-change contributions for the two modes is consistent with both “intercalative” and “exterior” binding mechanisms. An additional complexity is that there may be as many as six possible conformational quadruplex isomers based on the sequence. Differential scanning calorimetry experiments demonstrated two distinct melting events (Tm1 = 74.7°C and Tm2 = 91.2°C) resulting from a mixture of at least two conformers for the c-MYC PU 27-mer in solution.
INTRODUCTION
In anticancer drug discovery, shifting the focus to structural selectivity instead of sequence selectivity is a promising means to improve drug specificity and affinity for specific biotargets. Recently the binding of small molecules to higher-order DNA structures, such as G-quadruplex DNA, has been the focus of a new avenue for the treatment of cancer (1–5). It has been proposed that the formation of G-quadruplexes can occur in the promoter regions of 17 of the 30 known oncogenes (e.g., c-MYC, VEG-F, BCL-2, etc.) as well as the human telomere (5–7). The c-MYC protein has been identified as one of the main activation factors for the hTERT catalytic domain of the telomerase enzyme (8–15). The activation of the telomerase enzyme has been identified in >60% of cancer cells of different types (16,17). Some studies have shown that under physiological conditions the formation of the G-quadruplex is not highly favored (18–20). However, binding a drug with high affinity for G-quadruplex DNA can drive this equilibrium toward the formation of G-quadruplex structures (21–25). Potential applications of binding drugs to G-quadruplex DNA include downregulation of genes important to the development and/or endurance of multiple types of cancer (10,11,26–33).
The affinity of the model drug mesotetra (N-methyl-4-pyridyl) porphine (TMPyP4) for G-quadruplex DNA has been previously established (1,30,34–38). The mechanism by which this compound binds to G-quadruplex DNA has been a topic of dispute. Haq et al. described the binding of TMPyP4 to a series of model quadruplex structures by an exclusively intercalative mechanism in which the number of bound TMPyP4 molecules/quadruplex was consistent with the number of “intercalation slots” (39). Seenisamy et al. have suggested that there are only two possible binding sites on the G-quadruplex, both of which are on the exterior ends of the quadruplex structure (40). Interestingly, Seenisamy et al. noted a change in titration circular dichroism (CD) spectra for the c- MYC 27-mer quadruplex up to four mole ratios of TMPyP4. In light of these discrepancies, the main purpose of this study was to develop a better understanding of the location and number of binding sites involved in the binding of TMPyP4 (or other planar heterocyclic compounds) to G-quadruplex DNA. Our data support both intercalation and end-capping mechanisms for binding saturating amounts of TMPyP4 to the c-MYC quadruplex.
MATERIALS AND METHODS
The c-MYC 27-mer of sequence 5′-TGGGGAGGGTGGGGAGGGTGGGGAAGG and molecular mass 8687.4 g/mol was obtained from Oligos Etc. (Wilsonville, OR). c-MYC 27-mer stock solutions were prepared by dissolution of weighed amounts of the oligonucleotide in KBPES buffer (.01 M KH2PO4, .01 M K2HPO4, .001 M EDTA, 0.02–0.6 M KCl, KOH added dropwise to pH 7.0). A small volume (2 mL) of the oligonucleotide stock solution was exhaustively dialyzed (1000 molecular-weight cutoff membrane) against two changes of buffer (1 L, 24 h each) at 4°C. The concentrations of all the DNA solutions were verified using ultraviolet-visible (UV-Vis) spectrophotometry with molar extinction coefficients determined using a nearest-neighbor calculation for single-stranded DNA (41) and the absorbance of thermally denatured constructs extrapolated back to 25°C, and/or a total-phosphate-analysis technique (42). The extinction coefficient determined for the 27-mer quadruplex by these techniques was ɛ260 = 2.153 × 10⁵ M−1 cm−1.
TMPyP4 was obtained from Frontier Scientific (Logan, Utah). All ligand solutions were prepared by dissolution of a weighed amount of TMPyP4 and using a measured volume of the final dialysate from the appropriate oligonucleotide solution preparation as the buffer. Concentrations for TMPyP4 solutions were verified with absorbance measurements using a published molar extinction coefficient of ɛ424 = 2.26 × 10⁵ M−1 cm−1 (39).
Isothermal titration calorimetry (ITC) experiments were performed using a Microcal VP-ITC (Microcal, Northampton, MA). All of the oligonucleotide titrations were done by overfilling the ITC cell with ∼1.5 mL of nominally 25 μM oligonucleotide solution and adding ∼60 (5 μL) to 140 (2 μL) injections of nominally 8 × 10⁻⁴ M TMPyP4. Titrations were done at five temperatures from 5 to 45°C and at five supporting electrolyte concentrations of 0.02–0.6 M KCl. Typically, three replicate titration experiments were performed. Due to the nonsigmoidal shape of the thermogram and the obvious presence of at least two independent binding processes, the thermograms (integrated heat/injection data) obtained in ITC experiments were fit with our own “independent-sites” model and a fitting algorithm developed for use with Mathematica 5.0 software. The data were fit within experimental error with a “two-independent-sites” model. Simpler models were unable to fit the data within experimental error and more complex models were not justified. (The model equations and a representative fit are described in the Results section and shown in Fig. 1 A.) Values for ΔG1 (K1), ΔG2 (K2), ΔH1, ΔH2, –TΔS1, –TΔS2, n1, and n2 were extracted directly from the fits obtained for our two-independent-sites model. Error analysis was accomplished using a Monte Carlo procedure. ΔCp1 and ΔCp2 values were obtained by plotting ΔHi versus temperature (°C) and fitting the temperature data with a simple linear-regression model.
FIGURE 1.

(A) Representative nonlinear regression fit of the ITC integrated heat data for TMPyP4 binding to the 27-mer quadruplex DNA construct in 100 mM KCl at 25°C. The fit is shown as a solid line and is the result from the “multiple-independent-sites” model. The fit line shown above was obtained with a user-defined fitting routine coded in Mathematica 5.0 by our laboratory. (B) Dissection of the Gibb's free energy change for binding TMPyP4 to both mode 1 and mode 2 sets of equivalent binding sites of the 27-mer quadruplex in 100 mM KCl phosphate buffer (100 mM KCl, 30 mM phosphate buffer, pH 7.0). The first bar (vertically hatched) represents the free-energy change, the second bar (dotted) the enthalpy change, and the third bar (horizontally hatched) the –TΔS for modes 1 and 2, as noted in the figure. All parameter values are favorable (negative) with the exception of the mode 2 entropic term.
The differential scanning calorimetry (DSC) experiments were performed using a Microcal VP-DSC instrument. The c-MYC 27-mer concentration was nominally 1 × 10⁻⁴ M and TMPyP4 concentrations ranged from 5 × 10⁻⁵ M to slightly greater than 1 × 10⁻⁴ M. Experiments covered the temperature range from 10 to 110°C and the scan rate was set to 90°C/h. A typical experiment involved collecting three heating scans for each filling, and replicate measurements were done on separate fillings of the DSC cell. The DSC data were analyzed using the Origin 7.1 software and were fit for two “two-state” processes. The Origin analysis reported values for the melting temperature, Tm, and the calorimetric, ΔHcal, and van't Hoff enthalpies, ΔHVH, for each observed transition.
UV-vis spectroscopy titrations were done using an Agilent 8453 diode array (Agilent, Santa Clara, CA). DNA and ligand solutions for UV-vis titrations were prepared at identical concentrations of 32 μM (BPES buffer). A titration experiment was done in two parts. In the first part, 1 mL of the dilute c-MYC 27-mer solution (32 μM) was placed into a standard quartz cuvette and 25 × 50-μl injections of the TMPyP4 solution were added manually. In the second part, 1 mL of the diluteTMPyP4 solution (32 μM) was placed into a standard quartz cuvette and 25 × 50-μl injections of the c-MYC 27-mer solution were added. Spectra from 200 to 600 nm were recorded after each injection in both parts of the titration experiment. In this manner, the entire mole fraction range of 0–1 was covered and there were five overlapping points at the end of each “half-titration.” The difference spectra used to construct the Job plot were obtained by subtraction of the spectra for TMPyP4 solutions from the spectra for the same concentration of TMPyP4 in the presence of the c-MYC 27-mer. The Job plot was analyzed to determine the mole fractions corresponding to specific TMPyP4/DNA complexes.
CD experiments were performed using a JASCO 810 CD spectropolarimeter spectroscopy instrument (Jasco, Tokyo, Japan) with spectra collected over the wavelength range 200–450 nm. The c-MYC 27-mer concentration was nominally 2 × 10⁻⁶ M and ligand concentration ranged from 0 to slightly greater than 8 × 10⁻⁶ M. Concentrations of the oligonucleotide and TMPyP4 were verified using UV-vis absorbance measurements. CD titration data were collected after manual addition of aliquots of the dilute TMPyP4 titrant using a calibrated micropipette. CD spectra were collected at mole ratios of 0:1, 1:1, 2:1, 3:1, and 4:1 for the TMPyP4/c-MYC 27-mer.
RESULTS
Fig. 1 A shows typical integrated heat data for the titration of the c-MYC PU 27-mer with TMPyP4 along with a two-independent-sites fit. (The raw ITC data corresponding to the same experiment are given in Supplementary Material as Fig. S1.) The ITC data demonstrate a stoichiometry of 4:1 for the TMPyP4:c-MYC 27-mer complex. The microcalorimetric signal and integrated heat data are complex and are consistent with at least two independent binding processes occurring during complex formation before drug saturation. These data are not typical for either a one-site or two-site ITC titration since the stronger binding interaction has the smaller exothermic heat of binding generating the complete curve shape shown in Fig. 1 A. Fig. 1 B shows the dissection of the free-energy changes for binding modes 1 and 2 into the enthalpy and entropy contributions.
The ITC thermograms were modeled using a multiple independent binding site nonlinear regression algorithm. The algorithm was implemented into the Mathematica 5.0 programming language and is defined by Eqs. 1 and 2.
 |
(1) |
 |
(2) |
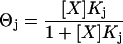
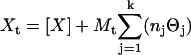
Equations 1 and 2 describe the equilibrium and mass-balance relationships for the system being studied, where Θj is the fraction of site j occupied by ligand, Xt is the total ligand concentration, [X] is the free ligand concentration, Mt is the total macromolecule concentration, Kj is the binding constant of process j, and nj is the total stoichiometric ratio for process j. Each of the equations is defined for k-binding sites, and solutions for any k-site binding process can be defined. Substituting Eq. 1 into Eq. 2 and expanding the polynomial in terms of the indeterminant [X] results in a (k + 1) degree polynomial. Thus, to determine a solution for a k-site independent binding process, roots of a (k + 1) degree polynomial must be found. A Mathematica 5.0 fitting algorithm was used to obtain a real root of the (k + 1) degree polynomial. Substitution of [X] into Eq. 1 allows the fraction of binding site j that is occupied to be calculated.
 |
(3) |
 |
(4) |
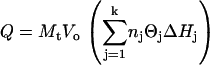
The total heat produced can be calculated from Eq. 3, where Vo is the initial volume of the sample cell and ΔHj is the molar enthalpy change for process j. The differential heat is defined by Eq. 4, where i represents the injection number. Nonlinear regression was performed on parameters Kj, nj, and ΔHj to obtain a best fit to the experimental data.
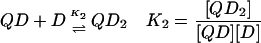
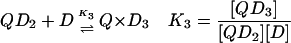
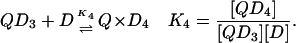
In the case of the quadruplex/TMPyP4 system, where saturation occurs at 4 mol drug/mol oligonucleotide, there are four unique binding sites and 64 microstate species possible as the titration proceeds from zero drug bound to saturation. Definitions of the macrobinding constants determined from these nonlinear regression fit models are given in Eqs. 5–8.
 |
(5) |
 |
(6) |
 |
(7) |
 |
(8) |
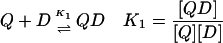
Since the quadruplex/TMPyP4 interaction can be modeled within experimental error only with two independent modes each having a stoichiometry of 2:1, the binding affinities for the first and second drug-binding interactions must be approximately equal, and the binding affinities for the third and fourth interactions must be approximately equal as well. Throughout the rest of this article, the parameter K1 refers to both of the highest-affinity sites (K1 and K2) in Eqs. 5 and 6 above, whereas the parameter K2 refers to both of the lower-affinity sites (K and K4) in Eqs. 7 and 8 above. The nonlinear regression fit (Fig. 1 A, solid line) is from a two-independent-sites model and the best-fit parameters listed in Tables 1 and 2. TMPyP4 binding to the two highest-affinity quadruplex sites, K1 ≈ 0.55 × 10⁷ M−1, is ∼ 20 times tighter than binding to the two lower-affinity sites, K2 ≈ 0.024 × 10⁷ M−1. ∂ΔG1–2 is approximately −2 kcal/mole, and ∂ΔH1–2 is approximately +6 kcal/mole. The large unfavorable change in the enthalpy change between mode 1 binding and mode 2 binding is obviously compensated to a large degree by a more favorable entropy change for the latter process. The free-energy change for each binding mode was parsed into the respective enthalpy and entropy contributions (Fig. 1 B). The two binding modes have distinctly different energetic profiles. The first is driven mainly by a favorable entropic contribution, whereas the second is driven by a large favorable enthalpy change. These energetic profiles are similar to those exhibited by duplex DNA interacting with groove binders and intercalators, respectively (43–47).
TABLE 1.
ITC-derived thermodynamic parameters for the 27-mer quadruplex construct binding TMPyP4 in variable salt conditions at 25°C (298 K)
| [KCl] (mM) | K1 (M−1) × 10−6 | ΔG1 (kcal/mol) | K2 (M−1) × 10−5 | ΔG2 (kcal/mol) |
|---|---|---|---|---|
| 20 | 43 (±3) | −10.4 | 18 (±0.6) | −8.5 |
| 50 | 25 (±2) | −10.1 | 7.0 (±0.2) | −8.0 |
| 100 | 5.4 (±.5) | −9.2 | 2.0 (±0.1) | −7.3 |
| 200 | 11 (±1) | −9.6 | 2.3 (±0.1) | −7.3 |
Parameters are for the two-independent-sites binding model. The uncertainties listed for ΔHi were determined by Monte Carlo analysis.
TABLE 2.
ITC-derived thermodynamic parameters for the 27-mer quadruplex construct binding TMPyP4 in variable salt conditions at 25°C (298 K)
| [KCl] (mM) | ΔH1 (kcal/mol) | −TΔS1 (kcal/mol) | ΔH2 (kcal/mol) | −TΔS2 (kcal/mol) |
|---|---|---|---|---|
| 20 | −1.4 (±0.07) | −9.0 | −13.1 (±0.1) | 4.6 |
| 50 | −1.7 (±0.07) | −8.4 | −9.0 (±0.1) | 1.0 |
| 100 | −2.6 (±0.06) | −6.6 | −9.1 (±0.1) | 1.8 |
| 200 | −1.8 (±0.07) | −7.8 | −11.9 (±0.1) | 4.6 |
Parameters are for the two-independent-sites binding model. The uncertainties listed for ΔHi were determined by Monte Carlo analysis.
TMPyP4 titrations of the c-MYC 27-mer were done at five concentrations (50 ≤ [K+] ≥ 630 mM) of the supporting electrolyte. The ITC results obtained for the highest potassium concentration (630 mM) are neither tabulated nor discussed, as the binding of TMPyP4 was too weak at this salt concentration (K2 < 1 × 10⁻³ M−1), leaving the binding data subject to larger errors. The thermodynamic parameters obtained from fitting these ITC titrations are given in Tables 1 and 2. Over the range of 20–200 mM added KCl, the free-energy, enthalpy, and entropy changes seem to be relatively insensitive to the ionic strength for either binding mode. Increasing the ionic strength decreases the affinity for both binding processes. For all salt solutions ([K+] ≤ 230 mM), the dissection of the free energy of binding for both binding modes exhibited the same energetic profiles discussed above. These results are somewhat surprising in light of known polyelectrolyte effects and the fact that ionic strength and the specific cation are known to affect the structure of the quadruplex (48).
The temperature studies allowed us to estimate the ΔCp for binding and to evaluate the role of water in the TMPyP4/quadruplex complex formation. Again the titration data were best fit with a two-independent-sites model at all temperatures. The best-fit parameters for these experiments are given in Tables 3 and 4. The heat-capacity changes were calculated by plotting the ΔHi values versus temperature and fitting the data with a simple linear-regression line for each binding mode. The heat-capacity changes, ΔCp1 and ΔCp2, were 31 and 58 cal/mol·K, respectively. These ΔCp values are small and indicate only small net changes in structured solvent on binding. Again, this result is interesting since solvation is important to DNA structure and many ligands bind to DNA with the concomitant expulsion of groove or spine water (49–51).
TABLE 3.
ITC-derived thermodynamic parameters for the 27-mer quadruplex construct binding TMPyP4 in 100 mM KCl at a range of temperatures from 5 to 45°C
| T (°C) | K1 (M−1) × 10−6 | ΔG1 (kcal/mol) | K2 (M−1) × 10−5 | ΔG2 (kcal/mol) |
|---|---|---|---|---|
| 5 | 26 (±9) | −9.4 | 2.2 (±0.1) | −6.8 |
| 15 | 12 (±3) | −9.3 | 2.7 (±0.1) | −7.2 |
| 25 | 5.4 (±0.5) | −9.2 | 2.0 (±0.1) | −7.3 |
| 37 | 1.7 (±0.4) | −8.8 | 1.1 (±0.1) | −7.2 |
| 45 | 3.7 (±0.8) | −9.5 | 1.3 (±0.1) | −7.4 |
Parameters are for the two-independent-sites binding model. The uncertainties listed for ΔHi were determined by Monte Carlo analysis.
TABLE 4.
ITC-derived thermodynamic parameters for the 27-mer quadruplex construct binding TMPyP4 in 100 mM KCl at a range of temperatures from 5 to 45°C
| T (°C) | ΔH1 (kcal/mol) | −TΔS1 (kcal/mol) | ΔH2 (kcal/mol) | −TΔS2 (kcal/mol) |
|---|---|---|---|---|
| 5 | −4.7 (±0.7) | −4.7 | −9.3 (±0.3) | 2.5 |
| 15 | −2.6 (±0.1) | −6.7 | −9.3 (±0.2) | 2.1 |
| 25 | −2.6 (±0.1) | −6.6 | −9.1 (±0.1) | 1.8 |
| 37 | −2.7 (±0.1) | −6.1 | −9.2 (±0.1) | 2.0 |
| 45 | −3.5 (±0.2) | −6.0 | −8.3 (±0.1) | 0.9 |
Parameters are for the two-independent-sites binding model. The uncertainties listed for ΔHi were determined by Monte Carlo analysis.
The thermal stability of the c-MYC 27-mer was measured using DSC. The melting curve (Fig. 2 A) is well fit by summation of two two-state thermal transitions. The lower melting transition has a Tm of 76.4°C and the higher melting transition has a Tm of 91.2°C at 130 mM potassium. The two separate transitions indicate the presence of 1), two independent melting domains in a single structure; 2), a stepwise melting process for a single structure, in which a conformation change is followed by complete denaturation (sequential A→B→C); or 3), two different quadruplex conformers existing simultaneously in solution, each with its own unique melting temperature. Although the DSC data cannot unambiguously be used to identify which of these three possible processes is occurring, we believe the third process seems to be the most reasonable. This is based on the fact that the enthalpy changes for the two processes are similar in magnitude and from the fact that the equilibrium between these two conformations can be shifted by either drug binding or by the association of a shorter oligonucleotide having complimentary duplex-forming sequences and noninteractive bases directly adjacent to the quadruplex (data not shown). The relative percentages of each conformer at 25°C are ∼30 and 70% for the low-melting and high-melting conformers, respectively (in the absence of either TMPyP4 or the “capping sequence” just mentioned). The DSC results obtained for the highest potassium concentration (630 mM) are neither tabulated nor discussed, as the melting temperature of the quadruplex at this salt concentration was at or above the upper temperature limit of the instrument, leaving the melting data subject to larger errors. A plot of the DSC data for denaturation of the 27-mer G-quadruplex in 50–230 mM [K+] is given in Fig. 2 B. (The enthalpy change data obtained from the two-state fits for both thermal transitions in Fig. 2 B have been plotted as a function of melting temperature in Fig. S2 in Supplementary Materials). In the 20-mM salt solution, the lower melting transition has a Tm of 67.5°C and the higher melting transition has a Tm of 81.3°C. In the 200-mM salt solution, the lower melting transition has a Tm of 83.4°C and the higher melting transition has a Tm of 97.4°C. As expected, the thermal stability of the quadruplex increased continuously with increasing ionic strength. As we mentioned above, we have analyzed our DSC data based on a model that assumes that each two-state transition observed in the thermogram reflects a uniquely folded conformation of the oligonucleotide. All of the thermograms are composed of at least two independent two-state thermal transitions.
FIGURE 2.

(A) Thermal denaturation of the 27-mer quadruplex construct in 100 mM KCl, 20 mM phosphate buffer, pH 7.0. The raw DSC excess heat capacity signal has been deconvoluted into two “two-state” processes using Origin 7.0. The Tm values for the lower-melting conformer and the higher-melting conformers are 76.4 and 91.2°C, respectively. (B) Thermal denaturation of the 27-mer quadruplex construct in 20, 50, 100, 200, and 600 mM KCl (all of these with 30 mM phosphate buffer, pH 7.0). The curves from left to right are in the following order: 20, 50, 100, 200, and 600 mM KCl.
UV-vis titration spectra for the complexation of TMPyP4 by G-quadruplex oligonucleotide show an obvious red shift in the absorbance maximum, λmax. The λmax shifts from 422 to 440 nm (18 nm) and the absorbance is attenuated by ∼35% (hypochromicity). The shift in wavelength and the hyperchromicity are indicative of intercalation of the TMPyP4 molecule into the quadruplex structure (52–54). We note that the absence of a sharp isobestic point is the probable result of multiple conformatioins for the quadruplex and quadruplex-drug complexes. Examination of the Job plot (Fig. 3 A) shows several slope changes between approximately linear regions. The last four endpoints correspond to stoichiometric ratios of 1:1, 2:1, 3:1, and 4:1 mol TMPyP4/mol c-MYC 27-mer. The stoichiometric ratio at saturation (4:1) is consistent with the overall stoichiometry determined by fitting the ITC data in this article and with CD data analyzed in Hurley et al. (40).
FIGURE 3.

(A) Job plot of difference spectra collected at 450 nm plotted against mole fraction of added TMPyP4. The linear regression intersections correspond to mole fractions of 0.5, 0.66, 0.75, and 0.8. These intersections represent binding stoichiometries of 1:1, 2:1, 3:1, and 4:1, respectively. (B) Plot of absorbance versus wavelength for incremental additions of TMPyP4 into 27-mer G-quadruplex oligonucleotide. Total solution concentration was kept constant at 32 μM throughout the addition of ligand. The plot shows a characteristic red shift from 422 nm to 440 nm consistent with an intercalative drug binding mechanism.
As shown in Fig. 4 A, CD measurements of the 27-mer quadruplex construct demonstrated a spectral signature consistent with G-quadruplex DNA that agreed very well with previously published spectra for the same sequence (40). The CD spectra for the naked quadruplex along with solutions containing 1:1, 2:1, 3:1, and 4:1 mol TMPyP4/c-MYC 27-mer are shown in Fig. 4 A. Titration of the quadruplex with TMPyP4 in the CD instrument demonstrated that the quadruplex structure was still present after saturation with TMPyP4. Fig. 4 B shows that bound TMPyP4 does not have an induced CD signal under these experimental conditions, which are different (e.g., with respect to buffer, supporting electrolytes, temperature, drug and oligonucleotide concentrations, etc.) from those explored in Seenisamy et al. (40). The absorbance of the added TMPyP4 at 440 nm was attenuated by ∼50% for the last two mole ratios of added drug. The TMPyP4 absorbance (at 440 nm) increased according to the free drug extinction coefficient once the quadruplex had been saturated with TMPyP4 (4 mol TMPyP4/mol 27-mer quadruplex). The UV-vis absorbtion spectrum 200–440 nm for the solution containing TMPyP4 and the 27-mer qudruplex with a ratio of 4 mol drug/mol quadruplex is shown in Fig. 4 C.
FIGURE 4.

(A) Circular dichroism spectra of the 27-mer quadruplex interacting with TMPyP4 in 100 mM KCl, 30 mM phosphate buffer, pH 7.0. The CD spectra for both the naked and the TMPyP4-saturated quadruplex show the characteristic maximum at 264 nm typical of parallel G-quadruplex DNA. (B) Circular dicroism spectrum for the TMPyP4 saturated c-MYC 27-mer with data collected out to 450 nm showing no induced CD for the drug at 440 nm. (C) Absorbance spectrum for the TMPyP4-saturated c-MYC 27-mer demonstrating attenuation of the absorbance peak for TMPyP4 consistent with intercalation of TMPyP4 into the c-MYC 27-mer structure.
DISCUSSION
The ITC titrations of the c-MYC 27-mer with TMPyP4 exhibit two independent binding processes with different energetic profiles. The UV-vis and CD titrations indicate the intercalation of TMPyP4 into the quadruplex structure as well as the persistence of the quadruplex structure through saturation with TMPyP4. The stoichiometry of the TMPyP4 binding interaction is consistently 4 mol TMPyP4/mol c-MYC 27-mer at saturation. It is almost intuitive that there must be some combination of interior and exterior binding processes in play to form the 4:1 TMPyP4/G-quadruplex complex. As shown in Fig. 1 B, the energetic profiles for mode 1 and mode 2 binding sites are very different. Dissection of the free energy changes for binding TMPyP4 to the four independent sites in the quadruplex indicates that the highest-affinity sites (mode 1, presumably binding to the two end-cap regions) have an energetic profile consistent with “groove-like” binding interactions in duplex DNA (43–47). Dissection of the free-energy change for binding to the lower-affinity sites (mode 2, presumably binding to the two intercalation cavities) exhibits a profile similar to that shown for intercalation into duplex DNA (43–47). The two-independent-sites model is the simplest model that can fit the titration data and the derived K, ΔG, ΔH, and TΔS values for the two sites are weighted averages of all of the microstate values (55).
The free energy changes (and energetic profiles) for binding TMPyP4 to the c-MYC 27-mer by either binding mode are approximately independent of both ionic strength and temperature. The apparently small electrostatic contribution to the TMPyP4 affinity is consistent with the results of the computational modeling, indicating that there are no significant electrostatic interactions in the formation of the end-capped complex, and very few weak (3.5- to 4-Å) electrostatic interactions in the formation of the intercalation complex (Supplementary Material). The limited temperature dependence, i.e., the small positive values for ΔCp1 and ΔCp2, suggests that there must be little or no net solvent restructuring accompanying complex formation (52).
The thermal stability of the quadruplex was shown to increase with either TMPyP4 binding or increased ionic strength. At 630 mM ionic strength, little if any TMPyP4 binding was observed. Presumably, this is an indication that at high potassium concentrations, potassium ions might occupy TMPyP4 binding sites. We suspect that the effect of NaCl would be different; the salt dependence of both the quadruplex stability and TMPyP4 binding is really a combination of an ionic strength effect (screening) and a more specific counterion binding effect on the structure of the quadruplex in solution (e.g., Na+ versus K+).
We have used Eq. 9 to estimate the differential binding term for potassium ion binding to the quadruplex (56,57).
 |
(9) |
In Eq. 9, Δn is defined as the number of differentially bound ions that are released during quadruplex unfolding to a random coil, α is the activity coefficient for the released ion, ΔH is the enthalpy change for the quadruplex to random coil transition, Tm is the transition temperature, and δTm/δlog[K+] is determined from a plot of the melting temperature of the quadruplex versus the log of the potassium ion concentration. The value of Δn for each of the two transitions is comparable (Δn1 = 0.53, and Δn2 = 1.01). See Fig. 5. Either value seems small in light of published structures showing three specifically bound potassium ions in the typical G-quadruplex structure (22). We are not convinced that the difference between the Δn values calculated from Eq. 9 and the number of potassium ions placed in the crystal structure is significant. We actually have shown in the accompanying supplementary materials that there is a simple linear relationship between the Tm and [K+]1/2, indicating that the change in Tm can be just as effectively predicted as a function of the activity coefficient for the potassium ion.
FIGURE 5.

Plot of the melting temperature (Tm) versus the log of the potassium ion concentration (log[K+]). Both Tm1 (•) and Tm2 (▪) exhibit a linear dependence on the log of the potassium ion concentration. The log function was chosen to estimate the differential ion binding term by use of Eq. 9. The linear regression fits shown are described by the following equations: for the Tm1 data, the equation is Tm1 = 23.8 × log[K+] + 26.7, and for the Tm2 data, the equation is Tm2 = 24.4 × log[K+] + 39.6. The correlation coefficients for these fits are 0.9946 and 0.9991 for the Tm1 and Tm2 equations, respectively.
One conclusion, drawn in part from DSC obtained at low TMPyP4/quadruplex ratios (data not shown), is that the lower-melting conformer seen in the DSC experiment (Fig. 2 A) exhibits the highest average affinity for TMPyP4. It is well known that the c-MYC G-rich promoter sequence is theoretically capable of forming a variety of conformation isomers (40,58). Patel has reported on NMR structures for two mutant sequences exhibiting folding patterns that utilize different G-runs in the complete 27-mer wild-type sequence and have 1:2:1 bases in the connecting loops or 1:6:1 bases in the connecting loops (58). We have done DSC experiments with a mutant that forms only the 1:6:1 loop isomer, and this sequence exhibits a single two-state melting transition with a Tm that is equal to the Tm of the lower-melting conformer in the wild-type c-MYC 27-mer quadruplex studied here. We might speculate that 1:2:1and 1:6:1 loop isomers are in equilibrium in the wild-type c-MYC 27-mer solution and that binding TMPyP4 to the lower-melting conformer would result in a concomitant transition from the 1:2:1 isomer to the 1:6:1 isomer. Therefore, the differences in the total heat seen in the titrations done at different salt concentrations may be due not only to differences in the enthalpy values for TMPyP4 binding, but also to the inclusion of some refolding heat in the total heat of binding measured in these solutions.
Seenisamy et al. reported that significant changes in the quadruplex circular dichroism spectra were observed to occur upon the addition of TMPyP4 up to a mole ratio of 4 mol drug/mol oligonucleotide (40). It must be noted that these CD data were collected in the absence of K+. Photocleavage assay results published in the same work were interpreted to imply the binding of only 2 drug mol TMPyP4/mol quadruplex, both binding to end-cap regions. It is our belief that the intercalated TMPyP4 molecules would have had a smaller light absorption cross section than drug molecules in the end-capped positions. This is consistent with the hypochromicity observed in this study for the addition of TMPyP4 at mole ratios >2. In effect, photocleavage would occur predominantly near the end-capped TMPyP4 molecules and not near those that were intercalated. Haq et al., on the other hand, in other quadruplex model systems, stated that the quadruplex would be saturated with only 2 mol TMPyP4/mol oligonucleotide, both occupying intercalation cavities in the quadruplex structure comprised of four stacked G-tetrads (39). Our data indicate that overlapping end-capping and intercalation interactions are present in the binding of TMPyP4 to the 27-mer quadruplex DNA construct.
All of our experimental data are consistent with a model for the binding of TMPyP4 to the 27-mer quadruplex that features 1), the presence of four TMPyP4 binding sites in the quadruplex; 2), the existence of two binding modes, one in which the favorable free energy change is partly due to a favorable entropy change and a second in which the favorable free energy change is opposed by an unfavorable entropy contribution; and 3), binding modes that each consist of two thermodynamically equivalent ligand-binding sites.
We conclude with a statement that this system is extremely complex. The c-MYC 27-mer sequence is theoretically capable of forming multiple folded quadruplex structures with both chain (parallel and antiparallel) and loop (1:6:1, 1:2:1, …) isomers. In the work presented here, we report average thermodynamic parameters for binding of up to 4 mol TMPyP4 to an unknown mixture of quadruplex species. We have discussed that there are at least two conformers present with differing thermal stability, and that the lower-melting conformer(s) appears to have the higher affinity for TMPyP4. We have also gone out on a limb and suggested that our data are consistent with the native c-MYC sequence existing as a mixture of 1:6:1 and 1:2:1 intramolecular propeller-type parallel-stranded quadruplex structures, with TMPyP4 being preferentially bound to the 1:6:1 loop isomer.
SUPPLEMENTARY MATERIAL
An online supplement to this article can be found by visiting BJ Online at http://www.biophysj.org.
Acknowledgments
This work was supported in part by a Northern Arizona University Prop-301 award (E.A.L.) and awards 0014 (L.H. and E.A.L.) and 0015 (E.A.L. and L.H.) from the Arizona Biomedical Research Commission.
References
- 1.Anantha, N. V., N. Azam, and R. D. Sheardy. 1998. Porphyrin binding to quadruplexed T4G4. Biochemistry. 37:2709–2714. [DOI] [PubMed] [Google Scholar]
- 2.Han, H., D. R. Langley, A. Rangan, and L. H. Hurley. 2001. Selective interactions of cationic porphyrins with G-quadruplex structures. J. Am. Chem. Soc. 123:8902–8913. [DOI] [PubMed] [Google Scholar]
- 3.Sun, D., B. Thompson, B. E. Cathers, M. Salazar, S. M. Kerwin, J. O. Trent, T. C. Jenkins, S. Neidle, and L. H. Hurley. 1997. Inhibition of human telomerase by a G-quadruplex-interactive compound. J. Med. Chem. 40:2113–2116. [DOI] [PubMed] [Google Scholar]
- 4.Han, H., and L. H. Hurley. 2000. G-quadruplex DNA: a potential target for anti-cancer drug design. Trends Pharmacol. Sci. 21:136–142. [DOI] [PubMed] [Google Scholar]
- 5.Hurley, L. H. 2001. Secondary DNA structures as molecular targets for cancer therapeutics. Biochem. Soc. Trans. 29:692–696. [DOI] [PubMed] [Google Scholar]
- 6.Mergny, J. L., J. F. Riou, P. Mailliet, M. P. Teulade-Fichou, and E. Gilson. 2002. Natural and pharmacological regulation of telomerase. Nucleic Acids Res. 30:839–865. [DOI] [PMC free article] [PubMed] [Google Scholar]
- 7.Todd, A. K., M. Johnston, and S. Neidle. 2005. Highly prevalent putative quadruplex sequence motifs in human DNA. Nucleic Acids Res. 33:2901–2907. [DOI] [PMC free article] [PubMed] [Google Scholar]
- 8.Cong, Y. S., J. P. Wen, and S. Bacchetti. 1999. The human telomerase catalytic subunit hTERT: organization of the gene and characterization of the promoter. Hum. Mol. Genet. 8:137–142. [DOI] [PubMed] [Google Scholar]
- 9.Ducrest, A. L., M. Amacker, Y. D. Mathieu, A. P. Cuthbert, D. A. Trott, R. F. Newbold, M. Nabholz, and J. Lingner. 2001. Regulation of human telomerase activity: repression by normal chromosome 3 abolishes nuclear telomerase reverse transcriptase transcripts but does not affect c-Myc activity. Cancer Res. 61:7594–7602. [PubMed] [Google Scholar]
- 10.Wang, J., L. Y. Xie, S. Allan, D. Beach, and G. J. Hannon. 1998. Myc activates telomerase. Genes Dev. 12:1769–1774. [DOI] [PMC free article] [PubMed] [Google Scholar]
- 11.Wu,K.J., C. Grandori, M. Amacker, N. Simon-Vermot, A. Polack, J. Lingner, and R. Dalla Favera. 1999. Direct activation of TERT transcription by c-MYC. Nat. Genet. 21, 220–224. [DOI] [PubMed] [Google Scholar]
- 12.Greenberg, R. A., R. C. O'Hagan, H. Y. Deng, Q. R. Xiao, S. R. Hann, R. R. Adams, S. Lichtsteiner, L. Chin, G. B. Morin, and R. A. De Pinho. 1999. Telomerase reverse transcriptase gene is a direct target of c-Myc but is not functionally equivalent in cellular transformation. Oncogene. 18:1219–1226. [DOI] [PubMed] [Google Scholar]
- 13.Drissi, R., F. Zindy, M. F. Roussel, and J. L. Cleveland. 2001. c-Myc-mediated regulation of telomerase activity is disabled in immortalized cells. J. Biol. Chem. 276:29994–30001. [DOI] [PubMed] [Google Scholar]
- 14.Kruk, P. A., N. J. Rampino, and V. A. Bohr. 1995. DNA damage and repair in telomeres: relation to aging. Proc. Natl. Acad. Sci. USA. 92:258–262. [DOI] [PMC free article] [PubMed] [Google Scholar]
- 15.Ducrest, A. L., M. Amacker, Y. D. Mathieu, A. P. Cuthbert, D. A. Trott, R. F. Newbold, M. Nabholz, and J. Lingner. 2001. Regulation of human telomerase activity: repression by normal chromosome 3 abolishes nuclear telomerase reverse transcriptase transcripts but does not affect c-Myc activity. Cancer Res. 61:7594–7602. [PubMed] [Google Scholar]
- 16.Hahn, W. C., and R. A. Weinberg. 2002. Modelling the molecular circuitry of cancer. Nat. Rev. Cancer. 2:331–341. [DOI] [PubMed] [Google Scholar]
- 17.Hahn, W. C., C. M. Counter, A. S. Lundberg, R. L. Beijersbergen, M. W. Brooks, and R. A. Weinberg. 1999. Creation of human tumour cells with defined genetic elements. Nature. 400:464–468. [DOI] [PubMed] [Google Scholar]
- 18.Li, W., D. Miyoshi, S. Nakano, and N. Sugimoto. 2003. Structural competition involving G-quadruplex DNA and its complement. Biochemistry. 42:11736–11744. [DOI] [PubMed] [Google Scholar]
- 19.Halder, K., V. Mathur, D. Chugh, A. Verma, and S. Chowdhury. 2005. Quadruplex-duplex competition in the nuclease hypersensitive element of human c-MYC promoter: C to T mutation in C-rich strand enhances duplex association. Biochem. Biophys. Res. Commun. 327:49–56. [DOI] [PubMed] [Google Scholar]
- 20.Risitano, A., and K. R. Fox. 2003. Stability of intramolecular DNA quadruplexes: comparison with DNA duplexes. Biochemistry. 42:6507–6513. [DOI] [PubMed] [Google Scholar]
- 21.Grand, C. L., H. Han, R. M. Munoz, S. Weitman, D. D. Von Hoff, L. H. Hurley, and D. J. Bearss. 2002. The cationic porphyrin TMPyP4 down-regulates c-Myc and human telomerase reverse transcriptase expression and inhibits tumor growth in vivo. Mol. Cancer Ther. 1:565–573. [PubMed] [Google Scholar]
- 22.Read, M. A., and S. Neidle. 2000. Structural characterization of a guanine-quadruplex ligand complex. Biochemistry. 39:13422–13432. [DOI] [PubMed] [Google Scholar]
- 23.Han, F. X., R. T. Wheelhouse, and L. H. Hurley. 1999. Interactions of TMPyP4 and TMPyP2 with quadruplex DNA. Structural basis for the differential effects on telomerase inhibition. J. Am. Chem. Soc. 121:3561–3570. [Google Scholar]
- 24.Wheelhouse, R. T., D. Sun, H. Han, F. X. Han, and L. H. Hurley. 1998. Cationic porphyrins as telomerase inhibitors: the interaction of tetra-(N-methyl-4-pyridyl)porphine with quadruplex DNA. J. Am. Chem. Soc. 120:3261–3262. [Google Scholar]
- 25.Haider, S. M., G. N. Parkinson, and S. Neidle. 2003. Structure of a G-quadruplex–ligand complex. J. Mol. Biol. 326:117–125. [DOI] [PubMed] [Google Scholar]
- 26.Mergny, J. L., L. Lacroix, M. P. Teulade-Fichou, C. Hounsou, L. Guittat, and M. Hoarau. 2001. Telomerase inhibitors based on quadruplex ligands selected by a fluorescence assay. Proc. Natl. Acad. Sci. USA. 98:3062–3067. [DOI] [PMC free article] [PubMed] [Google Scholar]
- 27.Hahn, W. C., S. A. Stewart, M. W. Brooks, S. G. York, E. Eaton, A. Kurachi, R. L. Beijersbergen, J. H. M. Knoll, M. Meyerson, and R. A. Weinberg. 1999. Inhibition of telomerase limits the growth of human cancer cells. Nat. Med. 5:1164–1170. [DOI] [PubMed] [Google Scholar]
- 28.Vaziri, H., and S. Benchimol. 1999. Alternative pathways for the extension of cellular life span: inactivation of p53/pRb and expression of telomerase. Oncogene. 18:7676–7680. [DOI] [PubMed] [Google Scholar]
- 29.Zahler, A. M., J. R. Williamson, T. R. Cech, and D. M. Prescott. 1991. Inhibition of telomerase by G-quartet DNA structures. Nature. 350:718–720. [DOI] [PubMed] [Google Scholar]
- 30.Siddiqui-Jain, A., C. L. Grand, D. J. Bearss, and L. H. Hurley. 2002. Direct evidence for a G-quadruplex in a promoter region and its targeting with a small molecule to repress c-MYC transcription. Proc. Natl. Acad. Sci. USA. 99:11593–11598. [DOI] [PMC free article] [PubMed] [Google Scholar]
- 31.Rezler, E. M., D. J. Bearss, and L. H. Hurley. 2002. Telomeres and telomerases as drug targets. Curr. Opin. Pharm. 2:415–423. [DOI] [PubMed] [Google Scholar]
- 32.Grand, C. L., T. J. Powell, R. B. Nagle, D. J. Bearss, D. Tye, M. Gleason-Guzman, and L. H. Hurley. 2004. Mutations in the G-quadruplex silencer element and their relationship to c-MYC over expression, NM23 repression and therapeutic rescue. Proc. Natl. Acad. Sci. USA. 101:6140–6145. [DOI] [PMC free article] [PubMed] [Google Scholar] [Retracted]
- 33.Gottesfeld, J. M., L. Neely, J. W. Trauger, E. E. Baird, and P. B. Dervan. 1997. Regulation of gene expression by small molecules. Nature. 387:202–205. [DOI] [PubMed] [Google Scholar]
- 34.Hudson, B. P., J. Sou, D. J. Berger, and D. R. McMillin. 1992. Luminescence Studies of the Intercalation of Cu(TMpyP4) into DNA. J. Am. Chem. Soc. 114:8997–9002. [Google Scholar]
- 35.Sehlstedt, U., S. K. Kim, P. Carter, J. Goodisman, J. F. Vollano, B. Norden, and J. C. Dabrowiak. 1994. Interaction of cationic porphyrins with DNA. Biochemistry. 33:417–426. [DOI] [PubMed] [Google Scholar]
- 36.Keating, L. R., and V. A. Szalai. 2004. Parallel-stranded guanine quadruplex interactions with a copper cationic porphyrin. Biochemistry. 43:15891–15900. [DOI] [PubMed] [Google Scholar]
- 37.Izbicka, E., R. T. Wheelhouse, E. Raymond, K. K. Davidson, R. A. Lawrence, D. Sun, B. E. Windle, L. H. Hurley, and D. D. Von Hoff. 1999. Effects of cationic porphyrins as G-quadruplex interactive agents in human tumor cells. Cancer Res. 59:639–644. [PubMed] [Google Scholar]
- 38.Seenisamy, J., S. Bashyam, V. Gokhale, H. Vankayalapati, D. Sun, A. Siddiqui-Jain, N. Streiner, K. Shin-ya, E. White, W. D. Wilson, and L. H. Hurley. 2005. Design and synthesis of an expanded porphyrin that has selectivity for the c-MYC G-quadruplex structure. J. Am. Chem. Soc. 127:2944–2959. [DOI] [PubMed] [Google Scholar]
- 39.Haq, I., J. O. Trent, B. Z. Chowdhry, and T. C. Jenkins. 1999. Intercalative G-tetraplex stabilization of telomeric DNA by a cationic porphyrin. J. Am. Chem. Soc. 121:1768–1779. [Google Scholar]
- 40.Seenisamy, J., E. M. Rezler, T. J. Powell, D. Tye, V. Gokhale, C. S. Joshi, A. Siddiqui-Jain, and L. H. Hurley. 2004. The dynamic character of the G-quadruplex element in the c-Myc promoter and modification by TMPyP4. J. Am. Chem. Soc. 126:8702–8709. [DOI] [PubMed] [Google Scholar]
- 41.Fasman, G. D. 1975. Practical Handbook of Biochemistry and Molecular Biology. CRC, Cleveland, OH.
- 42.Plum, G. E. 2000. Determination of oligonucleotide molar extinction coefficients. In Current Protocols in Nucleic Acid Chemistry. S. L. Beaucage, D. E. Bergstrom, G. D. Glick, and R. A. Jones, editors. John Wiley and Sons, New York. 1–17.
- 43.Chaires, J. B. 2006. A Thermodynamic Signature for Drug-DNA Binding Mode. Arch. Biochem. Biophys. n press. [DOI] [PubMed]
- 44.Suh, D., and J. B. Chaires. 1995. Criteria for the mode of binding of DNA binding agents. Bioorganic Med. Chem. 3:723–728. [DOI] [PubMed] [Google Scholar]
- 45.Hyun, K. M., S. D. Choi, S. Lee, and S. K. Kim. 1997. Can energy transfer be an indicator for DNA intercalation? Biochim. Biophys. Acta. 1334:312–316. [DOI] [PubMed] [Google Scholar]
- 46.Chaires, J. B. 2001. Analysis and Interpretation of Ligand-DNA Binding Isotherms. Methods Enzymol. 340:3–22. [DOI] [PubMed] [Google Scholar]
- 47.Ren, J. S., and J. B. Chaires. 1999. Sequence and structural selectivity of nucleic acid binding ligands. Biochemistry. 38:16067–16075. [DOI] [PubMed] [Google Scholar]
- 48.Kumar, N., and S. Maiti. 2005. The effect of osmolytes and small molecule on Quadruplex–WC duplex equilibrium: a fluorescence resonance energy transfer study. Nucleic Acids Res. 33:6723–6732. [DOI] [PMC free article] [PubMed] [Google Scholar]
- 49.Cooper, A. 2005. Heat capacity effects in protein folding and ligand binding: a re-evaluation of the role of water in biomolecular thermodynamics. Biophys. Chem. 115:89–97. [DOI] [PubMed] [Google Scholar]
- 50.Ladbury, J. E. 1996. Just add water! The effect of water on the specificity of protein–ligand binding sites and its potential application to drug design. Chem. Biol. 3:973–980. [DOI] [PubMed] [Google Scholar]
- 51.Freyer, M. W., R. Buscaglia, D. Cashman, S. Hyslop, W. D. Wilson, J. B. Chaires, and E. A. Lewis. 2007. Binding of netropsin to several DNA constructs: evidence for at least two different 1:1 complexes formed from an -AATT-containing ds-DNA construct and a single minor groove binding ligand. Biophys. Chem. 126:186–196. [DOI] [PubMed] [Google Scholar]
- 52.Wei, C., J. Guoqing, J. Yuan, Z. Feng, and C. Li. 2006. A spectroscopic study on the interactions of porphyrin with G-quadruplex DNAs. Biochemistry. 45:6681–6691. [DOI] [PubMed] [Google Scholar]
- 53.Leng, F., W. Preibe, and J. B. Chaires. 1998. Ultratight DNA binding of a new bisintercalating anthracycline. Antibio. Biochem. 37:1743–1753. [DOI] [PubMed] [Google Scholar]
- 54.Loontiens, F. G., P. Regenfuss, A. Zechel, L. Dumortier, and R. M. Clegg. 1990. Binding characteristics of Hoechst 33258 with calf thymus DNA, poly[d(A-T)], and d(CCGGAATTCCGG): multiple stoichiometries and determination of tight binding with a wide spectrum of site affinities. Biochemistry. 29:9029–9039. [DOI] [PubMed] [Google Scholar]
- 55.Cantor, C. R., and P. R. Schimmel. 1971. Biophysical Chemistry, Part III: The Behavior of Biological Macromolecules. W.H. Freeman and Co., San Fransisco.
- 56.Record, M. T., Jr., and T. M. Lohman. 1976. A semi-empirical extension of polyelectrolyte theory to the treatment of oligo-electrolytes. Biopolymers. 17:159–166. [Google Scholar]
- 57.Record, M. T., Jr., C. F. Anderson, and T. M. Lohman. 1978. Thermodynamic analysis of ion effects on the binding and conformational equilibria of proteins and nucleic acids: the roles of ion association or release, screening, and ion effects on water activity. Q. Rev. Biophys. 11:103–178. [DOI] [PubMed] [Google Scholar]
- 58.Phan, A. T., Y. S. Modi, and D. J. Patel. 2004. Propeller-type parallel-stranded G-quadruplexes in the human c-myc promoter. J. Am. Chem. Soc. 126:8710–8716. [DOI] [PMC free article] [PubMed] [Google Scholar]