Abstract
Bacterial flagella can adopt several different helical shapes in response to varying environmental conditions. A geometric model by Calladine ascribes these discrete shape changes to cooperative transitions between two stable tertiary structures of the constituent protein, flagellin, and predicts an ordered set of 12 helical states called polymorphic forms. Using long polymers of purified flagellin, we demonstrate controlled, reversible transformations between different polymorphic forms. While pulling on a single filament using an optical tweezer, we record the progressive transformation of the filament and also measure the force-extension curve. Both normal and coiled polymorphic forms stretch elastically with a bending stiffness of 3.5 pN·μm2. At a force threshold of 4–7 pN or 3–5 pN (for normal and coiled forms, respectively), a fraction of the filament suddenly transforms to the next, longer, polymorphic form. This transformation is not deterministic because the force and amount of transformation vary from pull to pull. In addition, the force is highly dependent on stretching rate, suggesting that polymorphic transformation is associated with an activation energy.
INTRODUCTION
Many bacteria swim by rotating long, helical flagella (1). Peritrichously flagellated bacteria, such as Escherichia coli and Salmonella, have several such flagella, each attached to a rotary motor that is embedded in the cell wall. Although the complete flagellum/motor complex contains ∼25 proteins, the bulk of the flagellum itself is composed of a single protein, flagellin (2,3). The flagellin homopolymer, called the flagellar filament, comprises more than 99% of the length of the flagellum and provides the structural stiffness necessary to generate thrust during swimming.
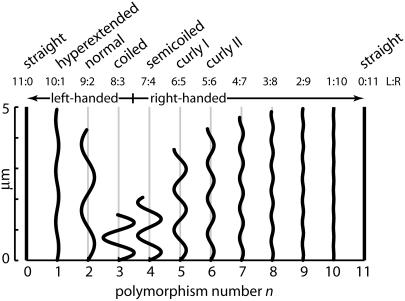
A Salmonella filament is normally a left-handed helix, but environmental perturbations can trigger a sudden, discrete change to a new shape. All of these shapes, called polymorphic forms, are helices (4,5); some are left-handed and some right-handed (Fig. 1). The most extreme forms are straight left- or right-twisted rods. A polymorphic transformation from one shape to another can be caused by changing pH, salinity, or temperature (6–8), by adding alcohols (9) or sugars (10), or by applying forces or torques to the filament (11,12). All of these transformations are reversible provided the conditions do not depolymerize the filament (6,7). In addition, mutations in flagellin can change the basic polymorphic form (13). The structure of the right-type straight form has been determined by x-ray fiber diffraction at 9-Å resolution (14) and by electron cryomicroscopy and image reconstruction at 4-Å resolution (15); a truncated right-handed flagellin can be crystallized, yielding an x-ray crystallographic structure at 2-Å resolution (5). The left-type straight form is less well characterized, but based on electron cryomicroscopy (16) and x-ray fiber diffraction measurements (2), it is believed to be slightly longer than the right-type form.
FIGURE 1.
Two-dimensional projections of the helical polymorphic forms predicted by the Calladine model of the bacterial flagellum. Polymorphism number n is the number of protofilaments in the “R” state (also displayed in the L:R ratio above the figure). Of the 12 predicted forms, 4 are left-handed (those with n ≤ 3), and most, but not all, have been observed in the wild (see Yamashita et al. (14). The form with n = 1 we call “hyperextended.” The helical forms pictured here correspond to the geometric parameters of Eqs. 6–8.
The subunits that make up the filament appear on its surface in a regular array, traced by 1-, 5-, 6-, and 11-start helices. The 11-start helices, called protofilaments, run nearly parallel to the filament axis, with extreme off-axis tilts of −1.5 or +3.5 degrees, in left-twisted or right-twisted straight filaments, respectively. The 1-start helix contains 5½ subunits per turn, with two turns required to step from one subunit to the next along a protofilament.
A simple geometric model by Calladine (4,17,18), based on earlier work by Asakura (19), explains the observed spectrum of flagellar polymorphic forms, in accord with physical data. The model assumes that 1), each individual flagellin monomer can switch between two states, “L” and “R,” that have slightly different inherent twist and length (20), and 2), the equilibrium pattern of monomer states minimizes the elastic energy of the filament.
The trivial cases of 100% L and 100% R states correspond to L-type and R-type straight filaments. Between these extremes, elastic energy is minimized when like states self-segregate along protofilaments, so that one can meaningfully refer to the “state” of a protofilament, and like protofilaments cluster together. Implicitly, there is some three-dimensional geometric incompatibility between monomer shape and the flagellar symmetry: homogeneous L and R wild-type flagellins must not fit neatly into the filament's 11-fold symmetry because the pH-neutral, room-temperature “normal” filament form contains 9/11 L and 2/11 R. The two-state model is buttressed by experiments in which chimeric filaments, composed of a mixture of mutant flagellins locked in the L and R states, yielded intermediate polymorphic forms (19,21,22). We use a modified version of the Calladine model containing three free parameters: the inherent twists of the L and R protofilaments (τL and τR) and the maximum curvature of the filament (κmax). The twist and curvature of the filament are
 |
(1) |
 |
(2) |
where n is the number of protofilaments in the R state. This simplified model neglects a slight (1.5%) variation of κmax with n (23). The parameter κmax is directly related to the L and R protofilament geometries, and typical values in the literature are consistent with measurements of protofilament structure (23). A computer simulation of filament extension identified a conformational change in a β-hairpin as the physical switch between the L and R states (5).
Although the Calladine model predicts the shapes of various forms, it says nothing about the relative stability of each form or the forces required to transform from one polymorphic form to the next. In this work we use optical tweezers to stretch isolated flagellar filaments and measure the force associated with polymorphic changes.
METHODS
Repolymerization
All work was done with Salmonella filaments repolymerized according to a variation of the method of Asakura (21,24). Three liters of QM medium (10 g Difco bacto peptone + 10 g Difco yeast extract + 10 ml 30% glucose + 10 ml 40 mM pH 8 potassium phosphate buffer per liter of water) were inoculated with 300 ml of a saturated culture of Salmonella typhimurium SJW1103 (a phase-1 stable derivative with normal filaments of serotype i (25)) and grown overnight at 37°C with shaking at 200 RPM to aerate. Cells were pelleted by centrifuging 15 min at 8000 × g and then resuspended in 42 ml polymerization buffer (5 mM potassium phosphate buffer pH 6.5 + 150 mM NaCl). Flagella were sheared from the cells in this suspension using a modified Waring blender, and the cell bodies were pelleted out (15 min at 8000 × g). The supernatant fraction was further cleaned of cell debris by centrifuging 15 min at 15,000 × g.
The resulting suspension was purified by three rounds of repolymerization. To perform a round of repolymerization: 1), pellet filaments 1 h at 78,000 × g and 4°C and discard supernatant; 2), resuspend filaments in 4–8 ml polymerization buffer; 3), reduce filament length by sonicating suspension 5 min at 50% power with a clean immersion sonicator (Heat Systems–Ultrasonics, Farmingdale, NY, model W225); 4), depolymerize filaments 5 min at 65°C; 5), clean monomer by centrifuging 1 h at 100,000 × g and 4°C and discarding precipitate; 6), make polymerization seeds: harvest a small fraction of supersaturated monomer solution, mix with an equal volume of 2M Mg2SO4 + 10 mM potassium phosphate (pH 6.5), polymerize 1 h at room temperature, spin down seeds 1 h at 78,000 × g, discard supernatant, and resuspend in original volume of polymerization buffer; 7), combine monomer and seeds and homogenize mixture by sonicating 5 min at 50% power; and 8), polymerize overnight at room temperature.
The three rounds of repolymerization used progressively smaller seed fractions of 20%, 10%, and 5% of total monomer volume. The resuspension volume in step 2 was decreased from 8 to 4 ml to keep the total monomer concentration (measured after depolymerization) around 1.5 OD280 (nominally 5 mg/ml) because ∼25% of flagellin was lost in each round of purification.
Repolymerized filaments were labeled with an amine-reactive Cy3 dye (Amersham Biosciences, Piscataway, NJ, Cat. No. PA23001) for 1.5 h in PBS (10 mM pH 7.0 phosphate buffer + 67 mM NaCl + 100 μM EDTA) in a variation of the method of Turner, Ryu, and Berg (26). To avoid breaking filaments, excess dye was removed by gently filtering with a 0.2-μm filter and flushing with 100 times the reaction volume of PBS. The majority of filaments were 10–25 μm in length, with a small population of extremely long (up to 70 μm) filaments. Labeled filaments were refrigerated in polymerization buffer until use.
Phase diagram
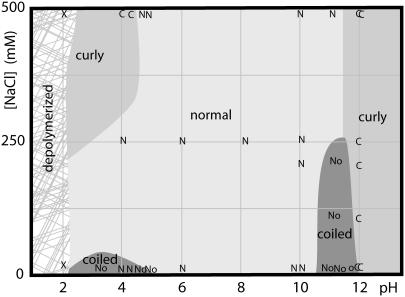
The phase diagram for Salmonella filaments (Fig. 2) was mapped using combinations of HCl (pH 2–4), 10 mM potassium phosphate buffer (pH 4–10), and NaOH (pH 10–12). Dilute samples of unlabeled repolymerized filaments in the appropriate buffer/salt combination were equilibrated 30–60 min at room temperature and observed with dark-field illumination.
FIGURE 2.
Phase diagram for repolymerized Salmonella filaments at room temperature. Measurements are denoted with letters: normal (N), curly (C), coiled (o), depolymerized (X), or coexisting normal, coiled, and hybrid normal-coiled (No).
Force-extension curves
Force-extension curves were obtained using an optical tweezer described by Berry and Berg (27). Antibody-coated beads were prepared by adsorbing anti-Cy3 antibody (Abcam, Cambridge, MA, Cat. No. ab6902-1) onto 1.4-μm latex beads (Polysciences, Warrington, PA, Cat. No. 17133) in PBS + 1% bovine serum albumin (BSA). A dilute solution of Cy3-labeled filaments and beads was mixed with an appropriate buffer (either pH 7 PBS + 0.003% BSA or pH 4 100 mM acetate + 0.01% BSA) and an oxygen-scavenging solution (0.1 mg/ml glucose oxidase (Sigma-Aldrich, St. Louis, MO, Cat. No. G7016) + 0.018 mg/ml catalase (Sigma Cat. No. C100) + 3 mg/ml glucose) and loaded into a thin chamber composed of a microscope slide and coverslip assembled using double-sided tape (∼0.07 mm thick). The slide was placed in a custom-built open-loop x-y piezoelectric stage (27) on an inverted microscope (Nikon Diaphot 200). A temperature-controlled brass jacket around the objective lens, designed according to Khan and Berg (28), was thermally coupled to the sample slide by immersion oil. Epifluorescence images of filaments were captured by a framegrabber (model LG-3, Scion Corporation, Frederick, MD) using a black and white CCD camera (Marshall Electronics, Culver City, CA, model V-1070). Trap stiffness was calibrated by fitting the trapped bead power spectrum to a Lorentzian (29), and the quadrant photodiode (QPD) response was calibrated by scanning an immobilized bead through the beam focus. During data runs, noise from the Brownian motion of the bead in the trap was suppressed using a 10-Hz low-pass hardware filter (Wavetek Rockland, Rockleigh, NJ, model 852), and the filtered QPD signal was recorded using LabView (National Instruments, Austin, TX). The trap was focused just above the chamber surface (+2 μm) so that pulling forces would be perpendicular to the optical axis, and so that the stretched filament would lie in the focal plane.
Isolated filaments naturally settle to the bottom of a microscope slide, and their proximal ends (6) adhere to clean glass (cleaned for several minutes in 95% ethanol saturated with KOH, then copiously rinsed with water). After a suitable filament was identified, an antibody-coated bead was trapped and forced against the filament until it bound, and the filament was stretched to an approximately neutral length. Labview was used to drive the piezo stage with a periodic triangle wave; the true displacement of the stage was calculated by correcting the open-loop signal using the recorded positions of stuck beads. Before data acquisition, the piezo was cycled at least 10 times to overcome the piezo memory effect. In principle, the filament extension might be less than the stage displacement because the far end of the filament moves inside the optical trap. In practice, with the relatively stiff traps used (100–150 pN/μm), the correction for bead motion was negligible.
Force-extension curves were fit to Eq. 12 with τn and κn considered to be known parameters. The extension z is related to experimental displacements dz via z = zn + Δ + dz, where Δ is the offset between the nominal origin (dz = 0) and the actual neutral filament position, and zn is the neutral axial length of the filament (given by Eq. 10 with τ = τn and κ = κn). To compute the fractional extension ζ = z/L we need to know the filament contour length L; in practice, it is more convenient to identify the neutral filament position, measure zn (from the image of the filament), and calculate L using Eq. 10. Eliminating L leads to the expression
 |
(3) |
where the neutral fractional extension ζn ≡ zn/L can be calculated from Eq. 10 to give ζ1 = 0.98, ζ2 = 0.85, and ζ3 = 0.30 for the hyperextended, normal, and coiled forms, respectively. The measured force was manually corrected by a constant offset to bring the slack region to zero force; this was required because of drift in the QPD amplifier-nulling electronics. In total, fitting of each data set used this manually fixed offset and two free parameters (Δ and EI). This offset was correlated with the fit parameter Δ but did not affect the stiffness EI or the overall shape of the force-extension curves.
RESULTS
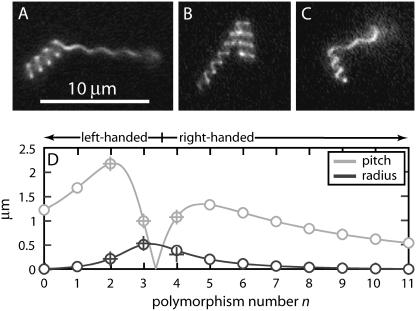
Fig. 2 shows the pH-salt phase diagram for reconstituted Salmonella flagellar filaments at room temperature; our results are similar to those obtained by Kamiya and Asakura (7). Regions labeled “coiled” generally contained some completely coiled filaments, some completely normal filaments, and some hybrid normal-coiled filaments composed of both forms, as in Fig. 3 A. Based on spot checks of a few of the regions, fluorescent labeling of filaments does not change the phase diagram.
FIGURE 3.
Filaments showing abutting sections of coiled and normal form (A), semicoiled and coiled form (B), and semicoiled and normal form (C). Beyond the normal section in (C) is a coiled end, which is out of the focal plane and not visible in this picture. (D) Predicted (o) and measured (+) pitch and radius of polymorphic forms for the best-fit values of the Calladine model parameters (Eqs. 6–8). The model allows only forms with integer n; the solid line is a continuous interpolation between these states.
Using labeled filaments in the low-pH/low-salt coiled phase and lowering the temperature to 3°C, we captured images of individual filaments in the process of transformation. Fig. 3, A–C, show examples of transiently occurring multiphase filaments. Based on a set of images like these, the pitch and radius at pH 4 and 3°C are listed in Table 1.
TABLE 1.
Pitch and radius of Salmonella filaments at pH 4 and 3°C
| Polymorphic form | n | Pitch (μm) | Radius (μm) |
|---|---|---|---|
| Normal | 2 | 2.17 | 0.21 |
| Coiled | 3 | 0.79 | 0.53 |
| Semicoiled | 4 | 1.07 | 0.30 |
The Calladine model specifies the twist and curvature of the helical forms (Eqs. 1–2), which are related to the pitch p and radius r by geometry (30, pp. 311–315):
 |
(4) |
 |
(5) |
Using the three free parameters of the Calladine model to fit the measured pitches gives
 |
(6) |
 |
(7) |
 |
(8) |
See Fig. 3 D. These values for the model parameters differ from others' estimates in the literature by ∼10% (23). The model predicts the forms' radii; measured values agree to within 0.05 μm. In hybrid filaments containing two different polymorphic forms, one can predict the angle between the two helical axes (31); our measurements agree with such a calculation to within 6° (data not shown).
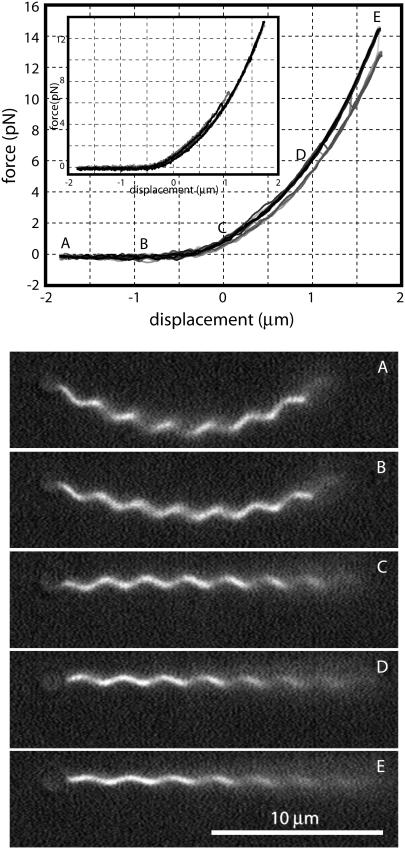
Repeatedly pulling on filaments in the neutral-pH/moderate-salt normal phase at room temperature gives the series of curves shown in Fig. 4. Under rapid pulling, the filament usually traces a simple, hysteresis-free curve (upper trace). Occasionally, however, the measured force will jump suddenly to a lower curve. This corresponds to a sudden twist of the filament as a portion transforms from the normal (n = 2) to the hyperextended (n = 1) form. Under rapid cycling conditions, the filament often (9 of 19 cycles) completes a complete elastic extension-compression cycle without performing a polymorphic transformation, but when the filament is extended more slowly, it always transforms (10 of 10 cycles), and the transformation generally occurs at lower force levels (Fig. 4, inset). When we attempt to compress the filament (z ≲ −0.5 μm), the helix buckles (frames A and B) rather than sustain any negative force. The polymorphic transformation that occurred during extension is reversed during this buckling, but because it occurs during a uniform zero-force regime, we do not detect it.
FIGURE 4.
Force-extension curves for pulling on a normal (n = 2) polymorphic form filament. The upper panel shows 10 force-extension measurements perfomed at an extension rate of 0.4 μm/s. During 6 of the 10 trials shown, the filament followed a simple elastic force-extension curve (upper trace, labeled A–E). During the other trials a polymorphic transformation to the hyperextended (n = 1) form occurred during the extension of the filament, dropping the force onto a lower curve. When the same filament was pulled at a 10-fold slower extension rate, it transformed during every trial (inset) at about half the force required during rapid pulling. Stills of the same filament (lower panels) were extracted from video at points on the force-extension curve labeled A–E. The flat near-zero portion corresponds to filament buckling (A and B). Trap stiffness was 90 pN/μm. The location of zero displacement is arbitrary. The trapped bead is visible at the left end of the filament.
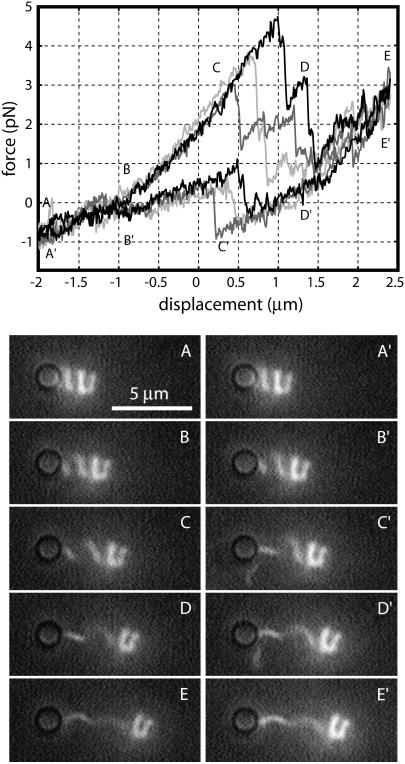
If we start from a coiled state, obtained by putting the filament in pH 4 buffer at 3°C, the transformation is more dramatic (Fig. 5). All the force-extension curves initially follow a single curve (A–E), but at different forces (between 3 and 5 pN; around D) a polymorphic transformation of the distal end of the filament occurs, releasing some of the stress accumulated in the stretching filament. After further stretching, this process repeats, with another portion the filament transforming, culminating in some five to eight transformations being visible in the force-extension record before the maximum extension is reached (E). After the first one, subsequent transformations typically occur at lower force levels, at least while the majority of the filament is still in the initial, coiled state. During the retraction stroke (E′–A′), the reverse polymorpic transformation occurs, resulting in a sudden increase in force (C′).
FIGURE 5.
Force-extension curves for pulling on a coiled (n = 3) polymorphic form. A typical force-extension measurement cycle begins with a compressed coiled form (A), which is elastically stretched (B and C) until a series of polymorphic transformations occurs (D), culminating in a filament that contains a substantial amount of normal (n = 2) form (E). During the retraction portion of the cycle this is reversed, with an initially smooth contraction (E′ and D′) followed by a normal-to-coiled transformation (around C′) and then gradual contraction (B′) back to the coiled starting state (A′). The video montage is of the same filament, although not taken at the same time as the force-extension data. The pitch of the left end of the filament changes abruptly during the polymorphic transformation; this occurs between frames C and D during extension and reverts between frames C′ and B′ during retraction. Trap stiffness was 150 pN/μm. The dark circle at the left end of the filament is the image of the trapped bead.
DISCUSSION
Between the sudden changes that signify polymorphic transformations, we can model the stretching filament as a simple elastic object. Kirchoff rod theory states that the elastic deformation of a thin rod requires an energy per length
 |
(9) |
where L is the total contour length, E and μ are the Young's and shear moduli, and I and J are cross-sectional moments with respect to bending and twisting axes (32, Chapter 18). κ and τ are the curvature and twist of the rod, which, under the application of some combination of torque and tension, may differ from their intrinsic, unstressed values κn and τn. It is more convenient to describe the helix by its length z and winding angle θ (= 2πz/p):
 |
(10) |
 |
(11) |
which allows us to compute the force and torque associated with an elastic deformation of the helix as F = ∂U(z, θ)/∂z and Γ = ∂U(z, θ)/∂θ. Because one end of the filament is attached to a spherical bead, the filament end rotates freely to relieve any torque. Solving Γ = 0 for the winding angle θ and substituting into the expression for F gives
 |
(12) |
where ζ ≡ z/L is the normalized length. For an isotropic solid −1 < E/μ < ½, and most common substances lie in the narrow region 0 < E/μ < ⅓, whereas a rod of circular cross section has J = 2I = πa4/2, where a is the radius. This suggests that 1 > EI/μJ > ¾, and we will make the simplifying assumption that EI/μJ = 1. For right-handed helices a positive force produces a positive extension ( ); for left-handed helices the convention is reversed, so a negative force produces an extension (
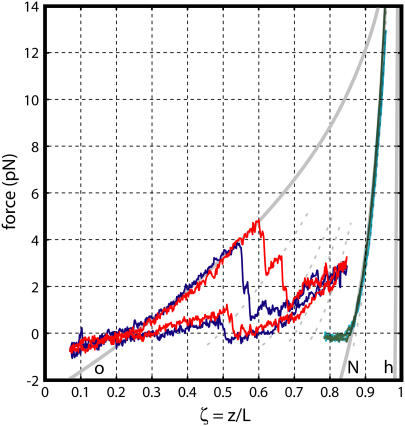
 ). In the following discussion, signs are reversed to make left-handed helices follow the more natural right-handed convention. Fig. 6 shows the data of Figs. 4 and 5 superimposed on a family of elastic force-extension curves given by Eq. 12 with τn and κn taken from Eqs. 6–8. For the normal:hyperextended and coiled:normal data, respectively, filament lengths are 19.5 and 7.6 μm, and fit parameters are Δ = 0.12 μm and Δ = 1.0 μm.
FIGURE 6.
Selections of data from the coiled-normal transformation of Fig. 5 (red and blue) and the normal-hyperextended transformation of Fig. 4 (green and cyan) superimposed on predicted elastic force-extension curves (solid gray) for coiled (o), normal (N), and hyperextended (h) polymorphic forms. Dotted lines are calculated curves for hybrid filaments containing (from left to right) 40:60, 65:35, 75:25, and 85:15 length fractions of coiled:normal filament, chosen to match the first four polymorphic transformations of the red data. These hybrid curves qualitatively match the progressively steepening sections of elastic stretching. Also shown is the calculated force-extension curve for 80:20 normal:hyperextended hybrid filament, chosen to match the polymorphic transformation of the green data. The deviation between data and theory for F < 0 is caused by filament buckling.
In both cases the best-fit stiffness was EI = 3.5 pN·μm2, which compares favorably with reported stiffness values of 1 to 3 pN·μm2 obtained by looking at thermal fluctuations (33–35). The slope of the elastic portion of the force-extension curve for the normal form is six times steeper than that for the coiled form, but that is entirely because of the difference in helical geometry between the two forms; the inherent stiffness of the filament itself is unchanged.
The derivation of Eq. 12 assumed that the bending and twisting stiffnesses (EI and μJ) are equal. If this were not the case, Eq. 12 would contain additional terms involving μJ and factors that depend on the helix geometry. A large difference between EI and μJ, as has been suggested (36), would have led to a different effective stiffness in our measurements. Because we do not observe any change in stiffness between forms, the approximation EI = μJ is probably quite good.
Equation 12 assumes that an axially aligned force produces a uniform extension or compression of the helix. Under compression, however, if the force is misaligned with the helical axis, then the filament will buckle. This problem is particularly severe with the normal form, which has a smaller radius, and as a result, the normal filament can sustain almost no compressive force before buckling into a flat, near-zero-force region.
Fig. 6 also shows intermediate curves corresponding to hybrid filaments, which are calculated by assuming that sections of different polymorphic forms act as springs connected in series. This formulation neglects the contact angle between the different forms, which varies from 20° (for normal:hyperextended) to 40° degrees (for coiled:normal). When a change in handedness occurs, the contact angle can be much larger. For instance, the coiled:semicoiled contact angle is 140° (Fig. 3 B), which is presumably why pulling on the coiled form triggers a transformation to the normal, rather than semicoiled, form, although both are more extended than the coiled form.
Polymorphic transformations occur in discrete, rapid steps, converting micrometer-long sections of filament at a time. In between transformations, the filament behaves as a linear elastic object that accumulates elastic strain energy, which is released during the next transformation. This phenomenon is consistent with some sort of activation energy or energy barrier because the transformation is not deterministic and is associated with a time scale, yielding force-extension curves that depend on strain rate as well as strain.
Acknowledgments
We thank Hirokazu Hotani for his guidance and for troubleshooting filament repolymerization, Jérome Robert and Svetlana Rojevsky for help with repolymerization, Will Ryu for the construction of the piezo stage, and Linda Turner for her general encouragement and wisdom. Shigeru Yamaguchi kindly provided the Salmonella strain used in this work.
This work was supported by National Institutes of Health grants AI016478 and AI065540.
References
- 1.Berg, H. C., and R. A. Anderson. 1973. Bacteria swim by rotating their flagellar filaments. Nature. 245:380–382. [DOI] [PubMed] [Google Scholar]
- 2.Namba, K., and F. Vonderviszt. 1997. Molecular architecture of bacterial flagellum. Q. Rev. Biophys. 30:1–65. [DOI] [PubMed] [Google Scholar]
- 3.Berg, H. C. 2003. The rotary motor of bacterial flagella. Annu. Rev. Biochem. 72:19–54. [DOI] [PubMed] [Google Scholar]
- 4.Calladine, C. R. 1978. Change of waveform in bacterial flagella: The role of mechanics at the molecular level. J. Mol. Biol. 118:457–479. [Google Scholar]
- 5.Samatey, F. A., K. Imada, S. Nagashima, F. Vonderviszt, T. Kumasaka, M. Yamamoto, and K. Namba. 2001. Structure of the bacterial flagellar protofilament and implications for a switch for supercoiling. Nature. 410:331–337. [DOI] [PubMed] [Google Scholar]
- 6.Kamiya, R., and S. Asakura. 1976. Helical transformations of Salmonella flagella in vitro. J. Mol. Biol. 106:167–186. [DOI] [PubMed] [Google Scholar]
- 7.Kamiya, R., and S. Asakura. 1977. Flagellar transformations at alkaline pH. J. Mol. Biol. 108:513–518. [DOI] [PubMed] [Google Scholar]
- 8.Hasegawa, E., R. Kamiya, and S. Asakura. 1982. Thermal transition in helical forms of Salmonella flagella. J. Mol. Biol. 160:609–621. [DOI] [PubMed] [Google Scholar]
- 9.Hotani, H. 1980. Micro-video study of moving bacterial flagellar filaments. II. Polymorphic transition in alcohol. Biosystems. 12:325–330. [DOI] [PubMed] [Google Scholar]
- 10.Seville, M., T. Ikeda, and H. Hotani. 1993. The effect of sugars on the morphology of the bacterial flagellum. FEBS Lett. 332:260–262. [DOI] [PubMed] [Google Scholar]
- 11.Macnab, R. M., and M. K. Ornston. 1977. Normal-to-curly flagellar transitions and their role in bacterial tumbling. Stabilization of an alternative quaternary structure by mechanical force. J. Mol. Biol. 112:1–30. [DOI] [PubMed] [Google Scholar]
- 12.Hotani, H. 1982. Micro-video study of moving bacterial flagellar filaments. III. Cyclic transformation induced by mechanical force. J. Mol. Biol. 156:791–806. [DOI] [PubMed] [Google Scholar]
- 13.Kanto, S., H. Okino, S.-I. Aizawa, and S. Yamaguchi. 1991. Amino acids responsible for flagellar shape are distributed in terminal regions of flagellin. J. Mol. Biol. 219:471–480. [DOI] [PubMed] [Google Scholar]
- 14.Yamashita, I., K. Hasegawa, H. Suzuki, F. Vonderviszt, Y. Mimori-Kiyosue, and K. Namba. 1998. Structure and switching of bacterial flagellar filaments studied by x-ray fiber diffraction. Nat. Struct. Biol. 5:125–132. [DOI] [PubMed] [Google Scholar]
- 15.Yonekura, K., S. Maki-Yonekura, and K. Namba. 2003. Complete atomic model of the bacterial flagellar filament by electron cryomicroscopy. Nature. 424:643–650. [DOI] [PubMed] [Google Scholar]
- 16.Morgan, D. G., C. Owen, L. A. Melanson, and D. J. DeRosier. 1995. Structure of bacterial flagellar filaments at 11 Å resolution: packing of the alpha-helices. J. Mol. Biol. 249:88–110. [DOI] [PubMed] [Google Scholar]
- 17.Calladine, C. R. 1975. Construction of bacterial flagella. Nature. 255:121–124. [DOI] [PubMed] [Google Scholar]
- 18.Calladine, C. R. 1976. Design requirements for the construction of bacterial flagella. J. Theor. Biol. 57:469–489. [DOI] [PubMed] [Google Scholar]
- 19.Asakura, S. 1970. Polymerization of flagellin and polymorphism of flagella. Adv. Biophys. 1:99–155. [PubMed] [Google Scholar]
- 20.Kamiya, R., S. Asakura, K. Wakabayashi, and K. Namba. 1979. Transition of bacterial flagella from helical to straight forms with different subunit arrangements. J. Mol. Biol. 131:725–742. [DOI] [PubMed] [Google Scholar]
- 21.Asakura, S., and T. Iino. 1972. Polymorphism of Salmonella flagella as investigated by means of in vitro copolymerization of flagellins derived from various strains. J. Mol. Biol. 64:251–268. [DOI] [PubMed] [Google Scholar]
- 22.Kamiya, R., S. Asakura, and S. Yamaguchi. 1980. Formation of helical filaments by copolymerization of two types of ‘straight’ flagellins. Nature. 286:628–630. [DOI] [PubMed] [Google Scholar]
- 23.Hasegawa, K., I. Yamashita, and K. Namba. 1998. Quasi- and nonequivalence in the structure of bacterial flagellar filament. Biophys. J. 74:569–575. [DOI] [PMC free article] [PubMed] [Google Scholar]
- 24.Asakura, S., G. Eguchi, and T. Iino. 1964. Reconstitution of bacterial flagella in vitro. J. Mol. Biol. 10:42–56. [DOI] [PubMed] [Google Scholar]
- 25.Yamaguchi, S., H. Fujita, K. Sugata, T. Taira, and T. Iino. 1984. Genetic analysis of H2, the structural gene for phase-2 flagellin in Salmonella. J. Gen. Microbiol. 130:255–265. [DOI] [PubMed] [Google Scholar]
- 26.Turner, L., W. S. Ryu, and H. C. Berg. 2000. Real-time imaging of fluorescent flagellar filaments. J. Bacteriol. 182:2793–2801. [DOI] [PMC free article] [PubMed] [Google Scholar]
- 27.Berry, R., and H. C. Berg. 1997. Absence of a barrier to backwards rotation of the bacterial flagellar motor demonstrated with optical tweezers. Proc. Natl. Acad. Sci. USA. 94:14433–14437. [DOI] [PMC free article] [PubMed] [Google Scholar]
- 28.Khan, S., and H. C. Berg. 1983. Isotope and thermal effects in chemiosmotic coupling to the flagellar motor of Streptococcus. Cell. 32:913–919. [DOI] [PubMed] [Google Scholar]
- 29.Berg-Sørensen, K., and H. Flyvbjerg. 2004. Power spectrum analysis for optical tweezers. Rev. Sci. Instr. 75:594–612. [Google Scholar]
- 30.Sokolnikoff, I. S., and R. M. Redheffer. 1958. Mathematics of physics and modern engineering. McGraw-Hill, New York.
- 31.Hotani, H. 1976. Light microscope study of mixed helices in reconstituted Salmonella flagella. J. Mol. Biol. 106:151–166. [DOI] [PubMed] [Google Scholar]
- 32.Love, A. E. H. 1944. A treatise on the mathematical theory of elasticity, 4th Ed. Dover Publications, New York.
- 33.Fujime, S., M. Maruyama, and S. Asakura. 1972. Flexural rigidity of bacterial flagella studied by quasielastic scattering of laser light. J. Mol. Biol. 68:347–359. [DOI] [PubMed] [Google Scholar]
- 34.Hoshikawa, H., and R. Kamiya. 1985. Elastic properties of bacterial flagellar filaments. II. Determination of the modulus of rigidity. Biophys. Chem. 22:159–166. [DOI] [PubMed] [Google Scholar]
- 35.Trachtenberg, S., and I. Hammel. 1992. The rigidity of bacterial flagellar filaments and its relation to filament polymorphism. J. Struct. Biol. 109:18–27. [DOI] [PubMed] [Google Scholar]
- 36.Flynn, T. C., and J. Ma. 2004. Theoretical analysis of twist/bend ratio and mechanical moduli of bacterial flagellar hook and filament. Biophys. J. 86:3204–3210. [DOI] [PMC free article] [PubMed] [Google Scholar]


