

Abstract
Taxanes are powerful chemotherapy agents that target the microtubule cytoskeleton, leading to mitotic arrest and cell death; however, their clinical efficacy has been hampered due to the development of drug resistance. Therefore, other proteins involved in spindle assembly are being examined as potential targets for anticancer therapy. The mitotic kinesin, Eg5 is critical for proper spindle assembly; as such, inhibition of Eg5 leads to mitotic arrest making it a potential anticancer target. We wanted to validate Eg5 as a therapeutic target and determine if Eg5 inhibitors retain activity in Taxol-resistant cells. Using affinity chromatography we first show that the compound HR22C16 is an Eg5 inhibitor and does not interact with other microtubule motor proteins tested. Furthermore, HR22C16 along with its analogs, inhibit cell survival in both Taxol-sensitive and -resistant ovarian cancer cells with at least 15-fold greater efficacy than monastrol, the first generation Eg5 inhibitor. Further analysis with HR22C16-A1, the most potent HR22C16 analog, showed that it retains efficacy in PgP-overexpressing cells, suggesting that it is not a PgP substrate. We further show that HR22C16-A1 induces cell death following mitotic arrest via the intrinsic apoptotic pathway. Interestingly, the combination of HR22C16-A1 with Taxol results in an antagonistic anti-proliferative and antimitotic effect, possibly due to the abrogation of Taxol-induced mitotic spindles by HR22C16-A1. Taken together, our results show that Eg5 inhibitors have promising anticancer activity and can be potentially used to overcome Taxol resistance in the clinical setting.
Taxanes represent one of the most successful classes of anticancer drugs and have validated microtubules as excellent chemotherapeutic targets (1). At the molecular level, taxanes bind microtubules directly leading to a potent suppression of microtubule dynamics, increased microtubule stabilization, and interphase microtubule bundling; consequently, cells undergo robust mitotic arrest and subsequent apoptotic cell death (2, 3). Despite their clinical success against several solid tumors including ovarian, breast, prostate, and non-small cell lung cancers (4), acquired drug resistance has hindered their clinical efficacy (5). Extensive preclinical studies have shown that taxane resistance is primarily caused by overexpression of the drug efflux pump, P-glycoprotein (PgP)1 (6), acquired mutations in β-tubulin (7), and increased microtubule dynamics (8). Thus, there is an urgent need to identify small molecule inhibitors that overcome taxane resistance. Because antimitotics have been so effective in clinical oncology, other proteins involved in the mitotic machinery represent desirable targets for anticancer therapy.
One such target is the microtubule-associated protein, Eg5 (9–12). This mitotic kinesin contains an N-terminal motor domain, which generates force along the microtubule, moving Eg5 to the microtubule plus end. During interphase in most epithelial cells, the plus ends of microtubules are oriented toward the plasma membrane while the minus ends are facing the nucleus. Upon entry into mitosis, microtubule plus ends reorient toward the chromosomes, while the minus ends are anchored at the spindle poles, forming a bipolar spindle. The homotetrameric structure of Eg5 has its motor domains arranged at two ends of a dumbbell such that it can bind and push apart spindle microtubules and generate an outward-directed force pushing spindle poles apart (13–15). Thus, Eg5 is critical for proper spindle formation during mitosis and therefore has become an attractive therapeutic target for rapidly dividing cancer cells.
The first small molecule inhibitor of Eg5 was identified in a phenotype-based screen and has been termed monastrol, because of the formation of monoastral spindles (16). Monastrol induces mitotic arrest without affecting interphase microtubules, and has been a useful tool for dissecting the mechanisms underlying spindle assembly (14); however, its clinical potential is limited because of its weak Eg5 inhibitory activity (IC50, 14 μM; Ref. 16). Recently, second generation Eg5 inhibitors have been discovered in drug screens. One such compound, CK0106023, is a specific allosteric inhibitor of Eg5 and possesses antitumor activity in an ovarian cancer xenograft (17). Another Eg5 inhibitor, HR22C16 was discovered in a microscopy-based forward chemical genetics screen of ~16,000 compounds (18). This compound has antimitotic activity and inhibits the Eg5 motor function in vitro with an IC50 of 800 ± 10 nM. Moreover, a variety of HR22C16 analogs with increased potency have also been developed.
Since HR22C16 and its analogs target Eg5 but not inter-phase microtubules, we wanted to assess their efficacy in Taxol-resistant and -sensitive human ovarian carcinoma cells. Our laboratory has established a model of Taxol resistance comprised of the 1A9 Taxol-sensitive human ovarian carcinoma cell line and its Taxol-resistant derivative line, 1A9/PTX10. Taxol resistance in this model is caused by an acquired tubulin mutation at the Taxol binding site and results in a 25-fold resistance to Taxol as compared with the parental 1A9 cells (7, 19).
Our results show that HR22C16 and its analogs, inhibit cell survival in both Taxol-sensitive and Taxol-resistant ovarian cancer cells, which either have PgP overexpression or acquired β-tubulin mutations. Furthermore, mechanistic evaluation of the most potent HR22C16 analog, HR22C16-A1 (termed A1), revealed that it induces apoptotic cell death via the intrinsic apoptotic pathway. Interestingly, the combination of A1 with Taxol results in an antagonistic effect on cell death and mitotic arrest, indicating that the combination of an Eg5 inhibitor with Taxol may not be of therapeutic use. In summary, we have identified a small molecule inhibitor of Eg5 with promising anticancer activity that retains the ability to induce cell death in cases where taxanes fail.
MATERIALS AND METHODS
Cell Culture
Cell lines were maintained in RPMI 1640 supplemented with 10% fetal calf serum, nonessential amino acids, and 0.1% penicillin/streptomycin. All lines were cultured at 37 °C in a humidified atmosphere with 5% CO2. The PTX10 Taxol-resistant cells were derived from 1A9 ovarian carcinoma cells as previously described (7).
Drug Compounds
Taxol was obtained from Calbiochem (580555), aliquoted to 10 μM in Me2SO and stored at 4 °C. Monastrol was obtained from AgScientific (M116) aliquoted to 10 mM in Me2SO and stored at − 20 °C. HR22C16, A1, and other analogs were previously synthesized and stored as described in Hotha et al. (18).
Preparation of HR22C16 Matrix for Affinity Chromatography
5.1 ml of Affi-Gel 10 (Bio-Rad) in 2-propyl alcohol was precipitated using a tabletop clinical centrifuge. The 2-propyl alcohol was carefully removed, and 8 ml of tetrahydrofuran (THF) was added. The THF was removed after pelleting the resin again and fresh THF was added. 51.2 mg of the HR22C16-amine in 200 μl of Me2SO and 25 μl of pyridine were added. After 4 h of incubation at room temperature, the reaction mixture was pelleted, and THF was removed. Fresh 2-propyl alcohol (10 ml) and 200 μl of TBSTX (14) were added to the resin and incubated for 2 h at room temperature.
Affinity Chromatography
Cytostatic factor-arrested Xenopus extracts were prepared as described (20). Extracts were then diluted 10-fold in dilution buffer (50 mM Hepes pH 7.7, 100 mM KCl, 1 mM EGTA, 11 mM MgCl2, 10 mg/ml LPC, 1 mM phenylmethylsulfonyl fluoride, 1 mM ATP, 7.5 mM creatine phosphate, 1 mM dithiothreitol), and spun for 1 h and 40 min at 52,000 rpm in a Ti70 rotor. Clarified extracts were then repeatedly passed over a column of 10 mg/ml bovine serum albumin coupled to Affi-Gel 10 (Bio-Rad) for 2 h. Either 200 μM of the HR22C16-amine or 0.1% Me2SO was then added to the clarified extract and it was repeatedly passed over the HR22C16 matrix for an additional 3 h. The flow-through was saved for Western blot analysis. The HR22C16 beads were then washed with 25 column volumes of wash buffer (10% glycerol, 50 mM Hepes pH 7.7, 100 mM KCl, 1 mM EGTA, 1 mM MgCl2, 1 mM dithiothreitol) and followed by 25 column volumes of wash buffer with 1 M KCl. Beads from the column were then added to SDS loading buffer and processed for Western blot analysis. Antibodies used were obtained as follows: pankinesin (gift from Dr. Timothy J. Mitchison; anti-Eg5 (as described in Ref. 9); Kin1: KCM1 (gift from Dr. C. Walczak); Kin 2: KLP1 (generated in the laboratory); Dyn1: p150glued dynactin and Dyn2: p50 dynamitin (BD Transduction Laboratories).
Cell Survival Assays and Combination Index
The sulforhodamine B (SRB) cytotoxicity assays were adapted from Skehan et al. (21). In brief, cells were plated in triplicate on 96 well plates (2500 cells/well), and the next day 1:3 serial dilutions of the drug were made and added to the cells. Cells were incubated with drug for 72 h, after which cells were fixed for 1 h with 50% cold trichloroacetic acid. Plates were washed five times in water, air-dried, then stained with 0.4% SRB for 30 min. Plates were then washed four times in 1% acetic acid, air-dried, and bound SRB was dissolved in 10 mM unbuffered Tris base (pH 10.5). Plates were read in a microplate reader by measuring A564. The percent survival was then calculated based upon the absorbance values relative to untreated samples. The combination index method described in Ref. 24 was employed to determine the interaction between A1 and Taxol, and the data were analyzed using Calcusyn software (Biosoft, Cambridge, UK). Briefly, the interaction of the two drugs was determined by calculating the CI as a function of the fraction affected (100 percent cell survival). A CI value of > 1 is antagonism, = 1 is additivity, and < 1 is synergy. Each CI value represents the mean of a least three independent experiments, whereby each data point was performed in triplicate.
Immunofluorescence
Immunofluorescence microscopy was performed as previously described (22). For tubulin staining an anti-α-tubulin antibody was used (Chemicon International, MAB1864; 1:500 dilution) and as a secondary antibody an Alexa 563-conjugated goat anti-rat IgG from Molecular Probes was used. Cells were imaged using a Zeiss LSM 510 Meta (Thornwood, NY) confocal microscope using either a × 63 (N.A. 1.4) or × 100 (N.A. 1.4) Apochromat objective. Images were acquired using Zeiss LSM 510 software and processed in Adobe Photoshop 7.0.
Flow Cytometry
For cell cycle analysis, cells were grown in 6-well plates and treated the next day. They were then scraped from plates using a rubber policeman, centrifuged at 1000 rpm for 5 min, and 1 ml of propidium iodide buffer containing 0.1 mg/ml propidium iodide and Nonidet P-40 (0.6%) was used to resuspend cells. Cell were incubated in this buffer for 30 min at room temperature in the dark, passed through a filter to remove cell clumps, and read in a BD Biosciences flow cytometer.
Western Blotting
1A9 ovarian carcinoma cells were plated in 6-well plates and treated the next day. Cells were lysed in TNES buffer containing 50 mM Tris (pH 7.5) 100 mM NaCl, 2 mM EDTA, 1% Nonidet P-40, and a 1× protease inhibitor mixture (Roche Applied Science). Lysates were centrifuged at 14,000 rpm for 15 min, and supernatants were loaded on a 7.5% SDS-PAGE gel (BCA assay was used to determine protein concentration). Protein was transferred (100 V for 1 h) and blotted with antibodies against PARP p85 (Cell Signaling), cleaved caspase-9 (Cell Signaling), cleaved caspase-8 (Cell Signaling), and actin (Cell Signaling).
Live Cell Imaging
MCF-7 cells stably transfected with GFP:tubulin (kind gift of Dr. Mary Ann Jordan) were imaged using a PerkinElmer Life Sciences Ultraview spinning disc microscope mounted on a Zeiss Axiovert 200 M microscope. A × 63 or × 100 Plan-Apochromat (N.A. = 1.4) was used to image cells, and the microscope was enclosed in a heating chamber (at 37 °C) and heated plate holder (at 37 °C) perfused with 5% CO2. Single image planes were acquired every 4 min with 2X2 binning and exposure times ranging from 300–600 ms.
RESULTS
HR22C16 Interacts with Eg5 but Not Other Microtubule-based Motor Proteins
The cell permeable small molecule inhibitor of cell division, HR22C16, was identified using a forward chemical genetic screen as previously described (18). Using in vitro assays it was previously shown that HR22C16 inhibits the mitotic kinesin, Eg5 with an IC50 of 800 ± 10 nM; however, it is not known if this compound binds and inhibits Eg5 specifically or if it also binds other microtubule motor proteins. Based on SAR (structure activity relationship) analysis (18), we designed a strategy to link HR22C16 to a solid-support compatible with affinity chromatography. HR22C16 was linked via an introduced terminal amine to Affi-Gel 10 resin (Fig. 1A). To assess whether HR22C16-beads bind Eg5, we incubated these beads with vertebrate cell-free extracts in the presence or absence of soluble HR22C16-amine. As shown in Fig. 1B, Eg5 was present in the bead-bound fractions confirming that Eg5 did indeed interact with the HR22C16 beads. Furthermore Western blot analysis of the flow-through (Fig. 1C) indicated that incubation with HR22C16 beads depleted Eg5 from the extract. The bulk of both the Eg5 binding and depletion was prevented when extracts were preincubated with 200 μM soluble HR22C16-amine, indicating these observations were in fact caused by Eg5 interaction with the small molecule, rather than nonspecific absorption by the beads. In contrast, when we examined a number of other microtubule-based motors important for cell division by Western blotting, they were neither significantly depleted by HR22C16 beads nor was there any effect on their relative protein levels in the flow-through in the presence or absence of soluble HR22C16 (Fig. 1C). These results indicate that HR22C16 binds to Eg5 and does not interact with other motor proteins that play key roles in cell division.
Fig. 1. HR22C16 interacts with the Eg5 mitotic kinesin.

Xenopus egg protein extracts were passed over HR22C16-coated beads and either the bound or unbound fraction was used for Western blotting. A, chemical structure of HR22C16, its analogs, and a schematic view of a HR22C16-coated bead used for affinity chromatography. B, Western blot of bead-bound fractions with an anti-Eg5 antibody without (lane 1) and with (lane 2) pretreatment of the protein extracts with free HR22C16-amine. C, Western blot of the flow-through fraction with specific anti-kinesin antibodies without (lane 1) and with (lane 2) pretreatment of the protein extracts with free HR22C16-amine.
HR22C16 and Its Analogs Have Antiproliferative Activity Against Both Taxol-resistant and -sensitive Cancer Cell Lines
Taxanes are one the most effective classes of anticancer agents with activity against a broad range of solid tumors; however, their clinical success has been limited because of acquired drug resistance (5). Our laboratory has established a model of Taxol resistance consisting of the parental Taxol-sensitive 1A9 human ovarian carcinoma cells and their Taxol-resistant counterparts, PTX10 and PTX22 cell lines. These cells are ~25-fold resistant to Taxol because of acquired mutations in the Taxol binding site (7). To test the efficacy of the Eg5 inhibitors, HR22C16 and two of its analogs (A1 and E1) (18) in these Taxol-resistant cell lines, we performed 72-h antiproliferative assays. Our results (Table I) show that all Eg5 inhibitors tested, including the first generation Eg5 inhibitor monastrol, are active against the Taxol-resistant cell lines, with relative resistance values ranging from 1.8–3.2-fold, in contrast to 21-fold resistance to Taxol. Furthermore, we show that the HR22C16 analog, A1, was the most effective antiproliferative agent, having an IC50 of 0.8 ± 0.1 μM and 2.3 ± 0.3 μM in 1A9 cells and PTX10 cells, respectively. These IC50 values are ~30-fold lower than monastrol (62 ± 5.6 μM in 1A9 and 57 ± 5.6 μM in PTX10) and ~3-fold lower than HR22C16. Overall, these results demonstrate that Eg5 inhibitors effectively inhibit cell growth in both Taxol-resistant and Taxol-sensitive cancer cells.
Table I.
Relative resistance of Taxol-resistant cells to Eg5 inhibitors
| 1A9 | PTX10 | PTX22 | Relative resistance | |
|---|---|---|---|---|
| HR22C16 | 2.5 ± 0.3 μM | 8.0 ± 0.4 μM | 7.7 ± 0.6 μM | 3.2 (3.1) |
| A1 | 0.8 ± 0.1 μM | 2.3 ± 0.3 μM | 2.2 ± 0.3 μM | 2.8 (2.8) |
| E1 | 2.5 ± 0.4 μM | 7.3 ± 0.5 μM | 8.1 ± 0.7 μM | 2.9 (3.2) |
| Monastrol | 31 ± 2.4 μM | 62 ± 5.6 μM | 57 ± 6.1 μM | 2.0 (1.8) |
| Taxol | 1.1 ± 0.2 nM | 23 ± 2.3 nM | 24 ± 2.9 nM | 20.9 (22) |
We next wanted to test if the most potent Eg5 inhibitor, A1, was also effective in cells that are resistant to Taxol because of overexpression of the drug efflux pump, PgP. Thus we used the ovarian carcinoma cell line A2780-AD10 (derived from 1A9 cells), which overexpresses PgP and is resistant to Taxol treatment (23). Our results (Table II) show that A1 retains its activity against the A2780-AD10 cells, displaying only a 2.4-fold relative resistance as compared with the parental 1A9 cells. In contrast, Taxol loses activity by at least 750-fold against the PgP-overexpressing A2780-AD10 cells. Furthermore, the mitotic index of A2780-AD10 cells following overnight treatment with 1 μM A1 was 62 ± 6.9%, whereas Taxol had no effect (mitotic index 3 ± 0.5%). This result demonstrates Eg5 inhibitors are effective in PgP-overexpressing cells suggesting that A1 is not a PgP substrate, and A1 activity is unaffected by taxane resistance caused by PgP overexpression.
Table II.
Relative resistance and mitotic index of the PgP− overexpressing cell line, A2780-AD10, treated with Taxol or A1
| 1A9 | A2780-AD10 | Relative resistance | Mitotic index of A2780-AD10 | |
|---|---|---|---|---|
| % | ||||
| Taxol | 1.2 ± 0.3 nM | > 900 nM | > 750 | 3 ± 0.5 |
| A1 | 1.25 ± 0.25 μM | 2.95 ± 0.65 μM | 2.4 | 62 ± 6.9 |
The Antiproliferative Activity of A1 Is Caused By Mitotic Arrest Followed by Apoptotic Cell Death
To confirm that the enhanced antiproliferative activity of A1 was reflected in its antimitotic activity, we quantitated the number of cells displaying monoastral spindles at various doses of both A1 and monastrol. We observed that 0.75 μM A1 resulted in ~10% of cells with monopolar spindles and that this effect was dose-dependent up until 10 μM, where nearly 85% of all cells had monopolar spindles (Fig. 2A). In comparison, 7.0 μM monastrol was necessary to produce only 5% of all cells having monopolar spindles, and it took 25 μM monastrol to give nearly 70% of all cells having monopolar spindles. Thus, A1 has greater antimitotic and antiproliferative activity compared with monastrol. These results show a tight correlation between the antimitotic and the cytotoxic effects of the Eg5 inhibitors. Since the HR22C16 analog, A1, displayed the most potent antiproliferative activity among all Eg5 inhibitors used here, we continued our mechanistic studies using this compound.
Fig. 2. A1 treatment (1 μM) induces mitotic arrest and cell death in Taxol-sensitive (1A9) and -resistant (PTX10) ovarian cancer cells.
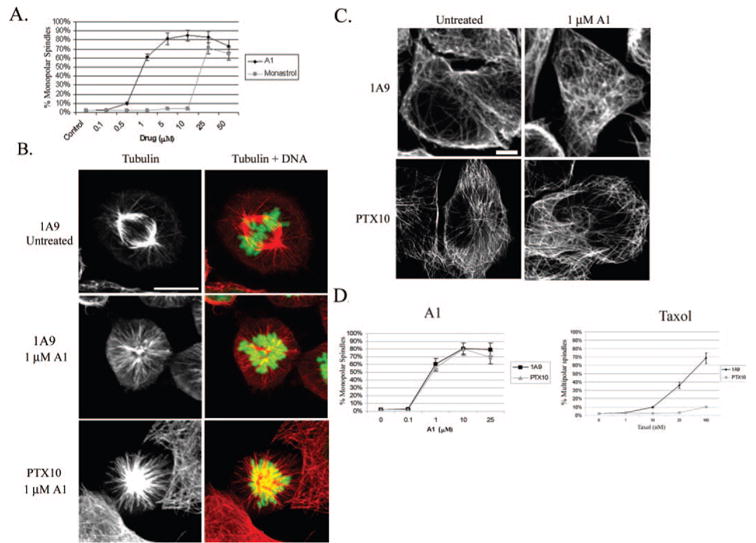
A, percentage of cells having monoastral spindles after 16 h treatment with varying doses of A1 or monastrol in 1A9 cells. B, immunofluorescence analysis of tubulin alone (left column) and tubulin (red) and DNA (green) merged (right column) in 1A9 and PTX10 cells. C, interphase microtubules are unaffected by A1 treatment (1 μM) in 1A9 and PTX10 cells. D, percentage of monoastral spindles induced by A1 or Taxol in 1A9 and PTX10 cells following a 16 h treatment with the different drug concentrations.
To precisely characterize the mechanism by which A1 induces cell death in Taxol-sensitive and -resistant 1A9 and PTX10 cells we first analyzed A1 effects on interphase and mitotic microtubules by confocal microscopy. As expected, untreated mitotic cells displayed normal bipolar metaphase spindles, with chromosomes aligned along the metaphase plate (Fig. 2B). In contrast, treatment of 1A9 and PTX10 cells with 1 μM A1 (~IC50 from 72 h antiproliferative assay) for 16 h resulted in the formation of monopolar spindles that were accompanied by a ring of chromosomes (Fig. 2B) This phenotype is indicative of Eg5 inhibition since cells are unable to form a normal bipolar spindle when Eg5 is non-functional. Furthermore, there were no detectable effects on interphase microtubules in both 1A9 and PTX10 cells (Fig. 2C), which is consistent with the fact that Eg5 functions only in spindle assembly. Similar results were observed in PTX22 cells (data not shown).
Our data shown in Table I demonstrate that A1 is equally effective against both 1A9 and PTX10 cells. We wanted to extend these observations to determine if A1 had similar Eg5 inhibitory activity in 1A9 and PTX10 cells, by quantitating the number of monopolar spindles produced in both cell lines at a range of doses. As shown in Fig. 2D, A1 induced a similar number of monopolar spindles in 1A9 and PTX10 cells at all concentrations tested. Thus, A1 is equally effective at inducing mitotic arrest in Taxol-resistant and -sensitive cell lines, suggesting that it is an effective antimitotic inhibitor in both cell lines. In contrast, Taxol was only effective in inducing aberrant mitotic spindles in 1A9 cells but lost efficacy in PTX10 cells, consistent with the Taxol-resistant phenotype of these cells.
To further examine the effects of A1 on mitotic arrest and apoptosis we employed live cell confocal imaging, which provides high spatiotemporal resolution of dynamic events. We imaged MCF-7 breast cancer cells stably expressing GFP-tubulin to observe microtubule spindle formation and cell division in untreated or A1-treated (1 μM) cells. In untreated cells, microtubules formed a normal bipolar spindle, underwent an-aphase, and cytokinesis within minutes upon entry in mitosis (see Supplemental Movie 1). In contrast, A1-treated cells were unable to form a bipolar spindle, and microtubules formed a monoastral configuration (n = 5). Specifically, a representative experiment (Fig. 3A and Supplemental Movie 2) shows two cells that were imaged 1 h after 1 μM A1 treatment. The cell on the left already has an A1-induced monopolar spindle and apoptosis is initiated at t = 100 and continues through t = 320 min (arrows indicating membrane blebbing). The cell on the right is imaged at interphase (t = 0) and begins to form a microtubule aster at t = 8 min. By t = 24 min the nuclear envelope has broken down, indicating chromosome condensation, (nucleus = N) and a monopolar spindle is observed. However, unlike control cells a bipolar spindle cannot be formed because of Eg5 inhibition by A1, and the monopolar configuration remains throughout the time lapse (t = 320 min).
Fig. 3. Time course analysis of A1 treatment (1 μM) on microtubule spindle formation and apoptosis.
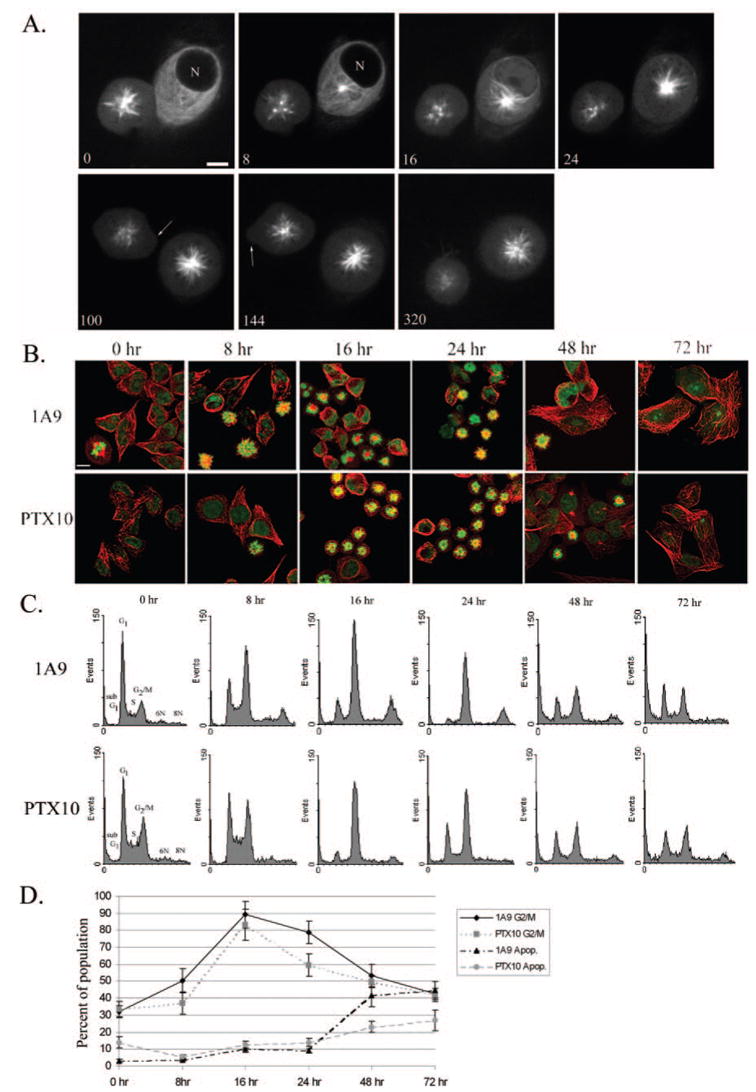
A, live cell confocal imaging of MCF-7 cells stably expressing GFP:tubulin. Cells were imaged 1 h after treatment with 1 μM A1 (n = nucleus). Cell on left already displays an A1-induced monoastral spindle and undergoes apoptosis (arrows indicate membrane blebbing). Cell on right forms an A1-induced spindle over time (time in minutes; scale bar, 10 μm). B, time course of mitotic arrest using immunofluorescence analysis of tubulin (red) and DNA (green) in 1A9 and PTX10 cells. C, cell cycle analysis of A1 treatment over time in 1A9 and PTX10 cells. D, graphical representation of mitotic arrest and cell death after A1 treatment in 1A9 and PTX10 cells.
Next, we performed a time course experiment to determine the temporal characteristics of monopolar spindle formation induced by A1, in a population of the Taxol-sensitive 1A9 and Taxol-resistant PTX10 cells (Fig. 3B). Confocal microscopy analyses show that monopolar spindles are evident at 8 h of A1 treatment, in both cell lines and their formation peaks at 16 h of treatment, in both 1A9 and PTX10 cell lines. By 48 and 72 h there appeared to be a decrease in the number of cells containing monopolar spindles in both cell lines, suggesting apoptotic cell death. Furthermore, we observed an increase in the number of multinucleated cells in both 1A9 and PTX10 (data not shown) indicating possible mitotic slippage.
To quantitatively examine the effect of A1 treatment on the cell cycle distribution and apoptosis we employed flow cytometry using DNA staining (Fig. 3, C and D). Our results show that the percentage of cells in G2/M increases in a time-dependent manner from 8 to 24 h, while the maximum mitotic arrest is reached at 16 h for both cell lines. These results are consistent with those obtained by confocal microscopy and also show a slow decrease of G2/M arrest at 48 and 72 h, by both assays. We also quantitated the number of apoptotic cells (sub-G1) and observed that in both cell lines the onset of apoptosis began at 48 h and significantly increased by 72 h. Finally, in both cell lines at 48 and 72 h there was a increase in the polyploid population, which may represent the aforementioned multinucleated cells observed by confocal microscopy.
A1 Induces Apoptosis Through the Intrinsic Apoptotic Pathway
To examine the mechanism by which A1 induces apoptotic cell death in 1A9 and PTX10 cells, we first measured cellular levels of PARP p85 cleavage, a downstream marker of both the intrinsic and extrinsic apoptotic pathways. Treatment of both 1A9 and PTX10 cells with A1 resulted in a similar dose-dependent increase in PARP cleavage, whereas Taxol treatment in PTX10 cells caused only a minimal increase in PARP cleavage (Fig. 4A), consistent with its lack of activity in these cells. These data further confirm that the apoptotic activity of A1 is equivalent in 1A9 and PTX10 cells.
Fig. 4. Eg5 inhibition induces apoptosis in 1A9 and PTX10 cells via the intrinsic apoptotic pathway.
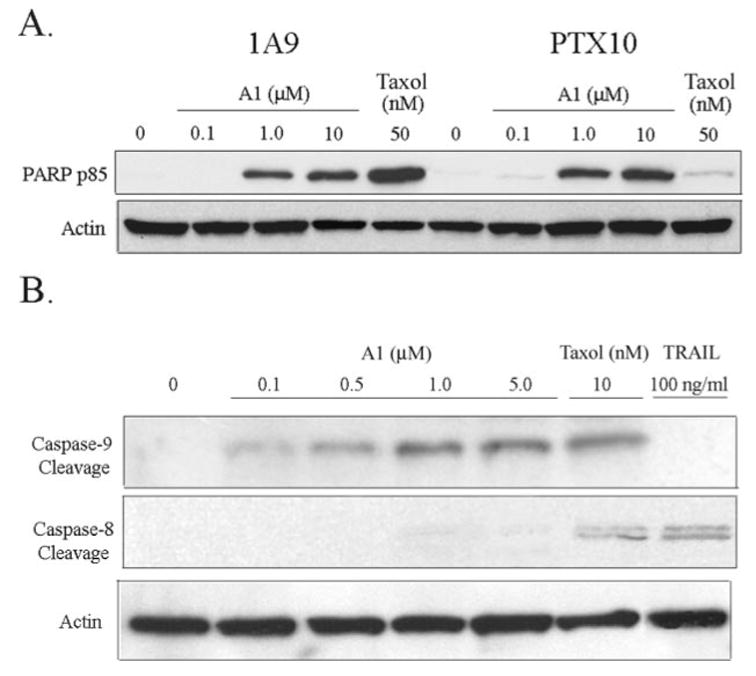
A, Western blot analysis of PARP p85 cleavage in 1A9 and PTX10 cells treated with varying doses of A1 and Taxol (50 nM) for 16 h. B, Western blot analysis of caspase-9, and caspase-8 cleavage after treatment with varying doses of A1, Taxol (10 nM), and TRAIL (100 ng/ml).
Next, we wanted to elucidate the mechanism of A1-induced apoptosis by determining if A1-treated cells activate the intrinsic (mitochondrial) or extrinsic apoptotic pathway. To do this we performed Western blot analysis for caspase-9 cleavage (only cleaved in the intrinsic pathway) and caspase-8 cleavage (only cleaved in the extrinsic pathway). Treatment with A1 led to a dose-dependent increase in both caspase-9 and PARP cleavage, but not caspase-8 cleavage (Fig. 4B), suggesting that A1 only activated the intrinsic apoptotic pathway. As a positive control for the extrinsic apoptotic pathway, we used the TRAIL ligand, a known activator of the extrinsic apoptotic pathway and caspase-8 cleavage. Treatment with the TRAIL ligand did induce capsase-8 but not cause caspase-9 cleavage (Fig. 4B), confirming previous studies with this compound. Furthermore, Taxol treatment caused caspase-9 and some caspase-8 cleavage, suggesting that it activates both the intrinsic and extrinsic apoptotic pathways in these cells. Overall, these results suggest that A1 induces apoptosis through the intrinsic apoptotic pathway.
A1 Is Antagonistic with Taxol Treatment
Both A1 and Taxol induce mitotic arrest, however A1 targets the microtubule-associated protein Eg5 leading to improper spindle formation, whereas Taxol binds microtubules directly, interfering with microtubule functionality. Regardless of their distinct mechanisms of action, they both cause mitotic arrest and ensuing apoptotic cell death. Thus, we wanted to determine if the combination of the two antimitotic agents would result in a synergistic enhancement of cell death. To do this we performed antiproliferative analysis with each drug alone and in combination and analyzed the results using the combination index (CI) analysis (24). In this type of analysis a CI less than 1 indicates synergy, greater than 1 is antagonism, and around 1 is additivity. As shown in Fig. 5A, the combination of the agents yielded a CI greater than 1, independently of sequential or concomitant administration of the two drugs, and therefore was antagonistic.
Fig. 5. The combination of Taxol and A1 has an antagonistic effect on cell proliferation and mitotic arrest.
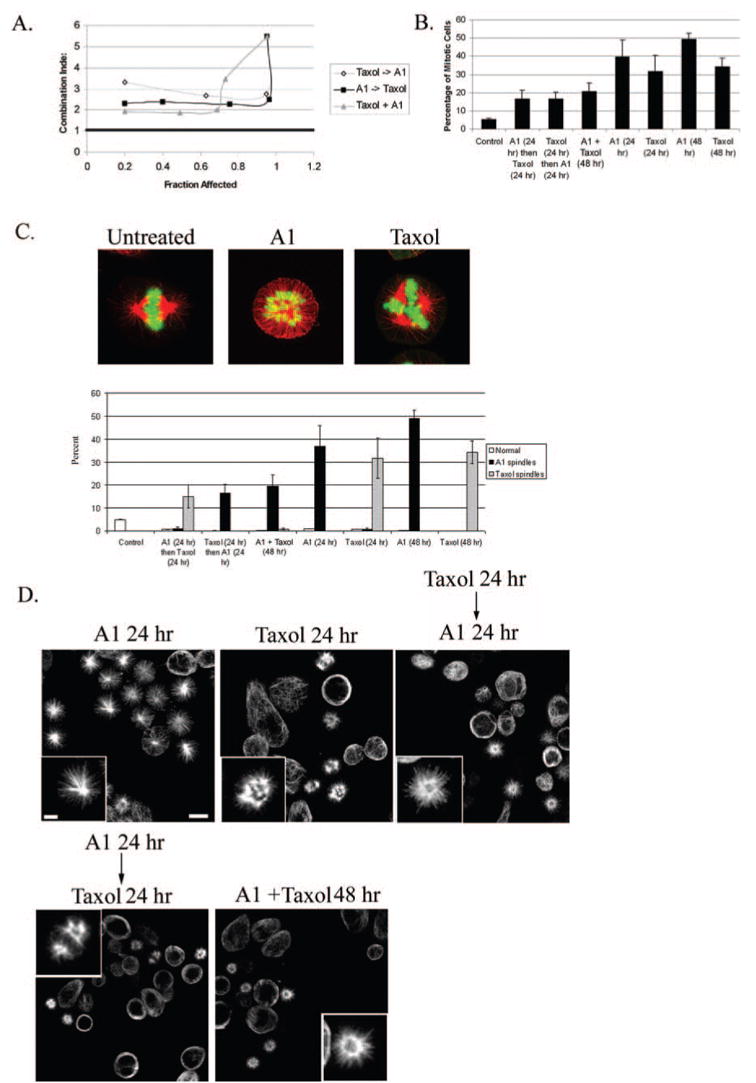
A, CI analysis of Taxol and A1 on cell survival for three different schedule regimes. A CI value of > 1 is antagonistic, < 1 is synergistic, and =1 is additive. B, quantitative analysis of mitotic arrest after the combination of Taxol (5 nM) and A1 (1 μM) compared with each drug alone. C, top, immunofluorescence analysis showing representative images of spindle architecture (red, tubulin; green, DNA) of untreated 1A9 cells or cells treated with Taxol or A1. C, bottom, bar graph showing the percent of cells having either normal, A1-, or Taxol-induced spindles for the different treatment schedules. D, tubulin staining of the various treatments shown above (scale bar, 10 μm). Insets are a higher magnification of individual spindles (scale bar, 3 μm).
To better understand the molecular basis of this antagonistic interaction, we examined the effect of their combined administration on mitotic arrest. The results of this experiment showed that the combination of these two agents resulted in a significant decrease in the number of cells arrested in mitosis compared with either drug alone (Fig. 5B), indicating that their antagonism likely stems from their decreased ability to cause mitotic arrest when the two agents are used in combination. A similar result was obtained with HR22C16, the parent compound of A1 (data not shown).
To further characterize the antagonistic nature of these two agents, we examined the morphology of aberrant spindles formed by each agent, both alone and in combination. We reasoned that we could distinguish each drug effect on mitotic arrest since Taxol mainly causes the formation of multipolar spindles, whereas A1 induces a monoastral-type spindle with a ring of chromosomes (Fig. 5C, top). Thus, we treated cells with various combinations of these agents and assayed the number of normal bipolar spindles, A1-type, or Taxol-type spindles. Our data show that concomitant administration of A1 (1 μM) and Taxol (5 nM) led to the formation of nearly all A1-type spindles (i.e. monopolar). Interestingly, when Taxol was administered first (24 h) followed by A1 (24 h), A1-type spindles were again observed predominantly, although Taxol alone (24 h) induced only Taxol-type spindles. On the other hand, when A1 (24 h) was followed by Taxol (24 h), most spindles formed a typical Taxol-like configuration (i.e. multipolar). Representative immunofluorescence images of the various treatments are also shown in Fig. 5D. Overall, these results show that the administration of A1 after, and during Taxol treatment, led to only A1-type spindles suggesting that A1 treatment forces spindles into a monoastral configuration.
To test the hypothesis that A1 treatment causes Taxol induced multipolar spindles to form a monoastral A1-type spindle, we employed live-cell confocal imaging of MCF-7 breast cancer cells stably expressing GFP-tubulin. This analysis will allow us to visualize the effects of A1 on Taxol-induced spindles with high spatiotemporal resolution. To perform this experiment, cells were first treated with Taxol (10 nM) for 16 h, which induced ~25% of cells to form multipolar spindles. A1 was then added (5 μM), and a cell having a multipolar spindle was immediately imaged (Fig. 6A). A time-lapse of one representative experiment (n = 5) is shown in Fig. 6B and Supplemental Movie 3; at t = 0 min after A1 treatment a multipolar Taxol-induced spindle is observed. After 36 min of A1 treatment the spindle begins to lose the distinct multipolar formation and appears to be collapsing. This pattern continues and by t = 100 min. the spindle forms a more circular pattern and microtubules emanate from a central microtubule ring. By t = 120 min the spindle has completely lost its original multipolar character and now appears more monopolar with microtubules radiating from the central portion of the aster. Overall, we observed this transition from multipolarity to monopolarity in ~90% of all spindles observed.
Fig. 6. A1 treatment disrupts Taxol-induced multipolar spindles.
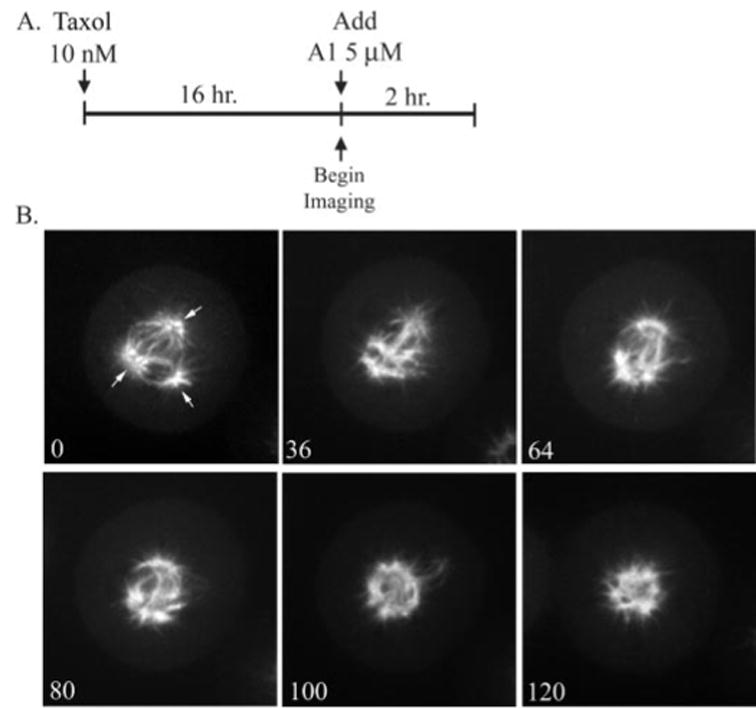
A, diagram outlining the drug treatments of the time course shown below. B, shown here is a representative experiment (n = 5) of live-cell confocal imaging of stably transfected GFP: tubulin MCF-7 cells. Cells were imaged once A1 was added (t = 0; time scale is in minutes). Arrows indicate spindle pole.
DISCUSSION
The clinical success of taxanes clearly validates microtubules as excellent anticancer targets; however, the ability of tumors to acquire resistance to taxane treatment is one of the most common causes of relapse in cancer patients (5, 25). Therefore, there is an urgent need for new small molecules with antimitotic activity that are able to combat taxane resistance. Thus, we sought to determine if small molecule inhibitors of the mitotic kinesin, Eg5, can overcome drug resistance in two model cancer cell lines of taxane resistance. Our results clearly show that Taxol-resistant cells, that either harbor a tubulin mutation at the Taxol-binding site, or overexpress PgP, undergo cell death after treatment with the potent Eg5 inhibitor HR22C16 and its analogs (Tables I and II). Furthermore, we show that A1, the most potent HR22C16 analog, exerts its anticancer activity via induction of mitotic arrest followed by cell death through the intrinsic apoptotic pathway (Figs. 3 and 4 and Ref. 26). Although Taxol-induced mitotic arrest stems from kinetic stabilization of mitotic spindles and A1-induced mitotic arrest stems from Eg5 inhibition, it appears that both classes of drugs trigger apoptosis via the intrinsic pathway. This result suggests that aberrant mitotic arrest triggers the intrinsic apoptotic pathway independently of the drug cellular target.
It is also important to note that in all cases and in all cell lines, we never observed any effects on interphase microtubules over a range of concentrations tested (0.5–10 μM) suggesting that these compounds are primarily active in dividing tissues. This is consistent with the fact that Eg5 is thought to only function in spindle assembly, when cells have entered mitosis (27, 28). In fact, preliminary data indicate that in breast tumors there is a positive correlation between mitotic index and Eg5 gene expression levels (29). In addition, preliminary data from our laboratory show that Eg5 inhibitors lose activity against cancer cells that are growth-arrested, either due to contact inhibition or due to adriamycin-induced cell cycle arrest (data not shown). Thus, we believe that Eg5 inhibitors are likely to be more selective for actively dividing cancer cells, sparing normal tissues from unnecessary side effects.
Interestingly we show that the combination of A1 with Taxol led to an antagonistic effect on cell survival (Fig. 5), such that exposing cells to both agents either sequentially or concomitantly reduces their antiproliferative and antimitotic effects. These results suggest that the combination of two drugs that both induce mitotic arrest by targeting either microtubules or Eg5 may not be favorable. This result is in sharp contrast with previous reports where the combination of antimitotic agents, such as Taxol with discodermolide or Taxol with vinca alkaloids, was shown to be synergistic (30, 31). These differences might be attributed to the fact that A1 and Taxol have different cellular targets whereas Taxol, discodermolide, and vinca alkaloids all share the same target, tubulin. Moreover, our data show that when Taxol is followed by A1 or when both drugs are present concomitantly, almost all cells displayed A1-type spindles (i.e. monopolar). Since we show that the same dose of Taxol (5 nM) alone for 24 h, induce multipolar Taxol-type spindles, it appears that these Taxol-induced spindles exist transiently in the Taxol/A1 sequential combination, but may transition to An A1-type configuration upon addition of A1 (Fig. 5, C and D). We went on to confirm this by showing in live cells that A1 treatment causes Taxol-induced multipolar spindle to collapse and form a more monopolar configuration (Fig. 6). An explanation for these observations is that Taxol-induced spindles cannot be maintained once A1 is added, implying that functional Eg5 is necessary to maintain this multipolar spindle configuration. In fact, it was shown that Eg5 is required for Taxol-induced microtubule aster formation in cell-free mitotic extracts (15). Thus, it is possible that the Taxol/A1 antagonism may stem from the fact that Eg5 functionality contributes to Taxol-induced mitotic arrest and cell death. Clearly, further studies investigating these observations and their impact on the antagonism of these two drugs are warranted.
Overall, our data show that Eg5 inhibition is likely to be an effective anticancer strategy and can be used to overcome taxane resistance. The development of new Eg5 inhibitors with potent anticancer activity, such as those described herein as well as in other reports (17), have enabled clinical development of these agents. Furthermore, our data suggest that the combination of Taxol and an Eg5 inhibitor is antagonistic, warranting caution of the combination of these two agents in the clinic. Thus further studies evaluating the clinical potential of these drugs are clearly necessary. Collectively, we show that Eg5 inhibitors are potent anticancer agents with a unique mechanism of action and activity in taxane-resistant cells, giving them the potential to be used clinically in cases where taxanes fail.
Acknowledgments
We thank Dr. Paula Vertino and Melissa Parsons for the TRAIL ligand. We would also like to thank the WCI Imaging and Microscopy Core for their support and service.
Footnotes
The on-line version of this article (available at http://www.jbc.org) contains Supplemental Movies.
The abbreviations used are: PgP, P-glycoprotein; THF, tetrahydrofuran; PARP, poly(ADP-ribose) polymerase; GFP, green fluorescent protein; CI, combination index; TRAIL, TNF-related apoptosis inducing ligand.
References
- 1.Jordan MA. Curr Med Chem Anti-Cancer Agents. 2002;2:1–17. doi: 10.2174/1568011023354290. [DOI] [PubMed] [Google Scholar]
- 2.Jordan MA, Wilson L. Nat Rev Cancer. 2004;4:253–265. doi: 10.1038/nrc1317. [DOI] [PubMed] [Google Scholar]
- 3.Wilson L, Panda D, Jordan MA. Cell Struct Funct. 1999;24:329–335. doi: 10.1247/csf.24.329. [DOI] [PubMed] [Google Scholar]
- 4.Rowinsky EK. Annu Rev Med. 1997;48:353–374. doi: 10.1146/annurev.med.48.1.353. [DOI] [PubMed] [Google Scholar]
- 5.Orr GA, Verdier-Pinard P, McDaid H, Horwitz SB. Oncogene. 2003;22:7280–7295. doi: 10.1038/sj.onc.1206934. [DOI] [PMC free article] [PubMed] [Google Scholar]
- 6.Geney R, Ungureanu M, Li D, Ojima I. Clin Chem Lab Med. 2002;40:918–925. doi: 10.1515/CCLM.2002.161. [DOI] [PubMed] [Google Scholar]
- 7.Giannakakou P, Sackett DL, Kang YK, Zhan Z, Buters JT, Fojo T, Poruchynsky MS. J Biol Chem. 1997;272:17118–17125. doi: 10.1074/jbc.272.27.17118. [DOI] [PubMed] [Google Scholar]
- 8.Goncalves A, Braguer D, Kamath K, Martello L, Briand C, Horwitz S, Wilson L, Jordan MA. Proc Natl Acad Sci U S A. 2001;98:11737–11742. doi: 10.1073/pnas.191388598. [DOI] [PMC free article] [PubMed] [Google Scholar]
- 9.Kapoor TM, Mitchison TJ. J Cell Biol. 2001;154:1125–1133. doi: 10.1083/jcb.200106011. [DOI] [PMC free article] [PubMed] [Google Scholar]
- 10.Garrett S, Kapoor TM. Curr Biol. 2003;13:R810–812. doi: 10.1016/j.cub.2003.09.052. [DOI] [PubMed] [Google Scholar]
- 11.Cassimeris L, Skibbens RV. Curr Issues Mol Biol. 2003;5:99–112. [PubMed] [Google Scholar]
- 12.Houliston E, Le Guellec R, Kress M, Philippe M, Le Guellec K. Dev Biol. 1994;164:147–159. doi: 10.1006/dbio.1994.1187. [DOI] [PubMed] [Google Scholar]
- 13.Sawin KE, Mitchison TJ. Proc Natl Acad Sci U S A. 1995;92:4289–4293. doi: 10.1073/pnas.92.10.4289. [DOI] [PMC free article] [PubMed] [Google Scholar]
- 14.Kapoor TM, Mayer TU, Coughlin ML, Mitchison TJ. J Cell Biol. 2000;150:975–988. doi: 10.1083/jcb.150.5.975. [DOI] [PMC free article] [PubMed] [Google Scholar]
- 15.Gaglio T, Saredi A, Bingham JB, Hasbani MJ, Gill SR, Schroer TA, Compton DA. J Cell Biol. 1996;135:399–414. doi: 10.1083/jcb.135.2.399. [DOI] [PMC free article] [PubMed] [Google Scholar]
- 16.Mayer TU, Kapoor TM, Haggarty SJ, King RW, Schreiber SL, Mitchison TJ. Science. 1999;286:971–974. doi: 10.1126/science.286.5441.971. [DOI] [PubMed] [Google Scholar]
- 17.Sakowicz R, Finer JT, Beraud C, Crompton A, Lewis E, Fritsch A, Lee Y, Mak J, Moody R, Turincio R, Chabala JC, Gonzales P, Roth S, Weitman S, Wood KW. Cancer Res. 2004;64:3276–3280. doi: 10.1158/0008-5472.can-03-3839. [DOI] [PubMed] [Google Scholar]
- 18.Hotha S, Yarrow JC, Yang JG, Garrett S, Renduchintala KV, Mayer TU, Kapoor TM. Angew Chem Int Ed Engl. 2003;42:2379–2382. doi: 10.1002/anie.200351173. [DOI] [PubMed] [Google Scholar]
- 19.Zhou J, Gupta K, Yao J, Ye K, Panda D, Giannakakou P, Joshi HC. J Biol Chem. 2002;277:39777–39785. doi: 10.1074/jbc.M203927200. [DOI] [PubMed] [Google Scholar]
- 20.Desai A, Murray A, Mitchison TJ, Walczak CE. Methods Cell Biol. 1999;61:385–412. doi: 10.1016/s0091-679x(08)61991-3. [DOI] [PubMed] [Google Scholar]
- 21.Skehan P, Storeng R, Scudiero D, Monks A, McMahon J, Vistica D, Warren JT, Bokesch H, Kenney S, Boyd MR. J Natl Cancer Inst. 1990;82:1107–1112. doi: 10.1093/jnci/82.13.1107. [DOI] [PubMed] [Google Scholar]
- 22.Mabjeesh NJ, Escuin D, LaVallee TM, Pribluda VS, Swartz GM, Johnson MS, Willard MT, Zhong H, Simons JW, Giannakakou P. Cancer Cell. 2003;3:363–375. doi: 10.1016/s1535-6108(03)00077-1. [DOI] [PubMed] [Google Scholar]
- 23.Safrit JT, Berek JS, Bonavida B. Gynecol Oncol. 1993;48:214–220. doi: 10.1006/gyno.1993.1036. [DOI] [PubMed] [Google Scholar]
- 24.Chou TC. In: Synergism and Antagonism in Chemotherapy. Chou TC, Rideout DC, editors. Academic Press; San Diego, CA: 1991. pp. 61–102. [Google Scholar]
- 25.Gottesman MM, Fojo T, Bates SE. Nat Rev Cancer. 2002;2:48–58. doi: 10.1038/nrc706. [DOI] [PubMed] [Google Scholar]
- 26.Yuan SY, Hsu SL, Tsai KJ, Yang CR. Urol Res. 2002;30:282–288. doi: 10.1007/s00240-002-0263-4. [DOI] [PubMed] [Google Scholar]
- 27.Uzbekov R, Prigent C, Arlot-Bonnemains Y. Microsc Res Tech. 1999;45:31–42. doi: 10.1002/(SICI)1097-0029(19990401)45:1<31::AID-JEMT3>3.0.CO;2-K. [DOI] [PubMed] [Google Scholar]
- 28.Whitehead CM, Rattner JB. J Cell Sci. 1998;111:2551–2561. doi: 10.1242/jcs.111.17.2551. [DOI] [PubMed] [Google Scholar]
- 29.Hegde PS, Cogswell J, Carrick K, Jackson J, Wood KW, Eng WK, Brawner M, Huang PS, Bergsma D. Proc Am Soc Clin Oncol. 2004;22:134. [Google Scholar]
- 30.Giannakakou P, Villalba L, Li H, Poruchynsky M, Fojo T. Int J Cancer. 1998;75:57–63. doi: 10.1002/(sici)1097-0215(19980105)75:1<57::aid-ijc10>3.0.co;2-a. [DOI] [PubMed] [Google Scholar]
- 31.Martello LA, McDaid HM, Regl DL, Yang CP, Meng D, Pettus TR, Kaufman MD, Arimoto H, Danishefsky SJ, Smith AB, 3rd, Horwitz SB. Clin Cancer Res. 2000;6:1978–1987. [PubMed] [Google Scholar]