

Abstract
We report for the first time the detection of membrane lipid rafts in mouse oocytes and cleaving preimplantation embryos. Cholera toxin β (CTβ), which binds to the raft-enriched ganglioside GM1, was selected to label rafts. In a novel application a Qdot reagent was used to detect CTβ labeling. This is the first reported use of nanocrystals in mammalian embryo imaging. Comparative membrane labeling with CTβ and lipophilic membrane dyes containing saturated or unsaturated aliphatic tails showed that the detection of GM1 in mouse oocytes and embryo membranes was consistent with the identification of cholesterol- and sphingolipid-enriched rafts in the cell membrane. Distribution of the GM1 was compared with the known distribution of non-raft membrane components, and disruption of membrane rafts with detergents confirmed the cholesterol-dependence of GM1 on lipid raft labeling. Complementary functional studies showed that cholesterol depletion using methyl-β-cyclodextrin inhibited preimplantation development in culture. Our results show that the membranes of the mouse oocyte and zygote are rich in lipid rafts, with heterogeneous and stage-dependent distribution. In dividing embryos, the rafts were clearly associated with the cleavage furrow. At the morula stage, rafts were also apically enriched in each blastomere. In blastocysts, rafts were detectable in the trophectoderm layer, but could not be detected in the inner cell mass without prior fixation and permeabilization of the embryo. Lipid rafts and their associated proteins are, therefore, spatio-temporally positioned to a play a critical role in preimplantation developmental events.
Keywords: cytokinesis, lipid rafts, oocytes, preimplantation embryos, quantum dots
Introduction
During preimplantation embryo development mammalian embryos undergo a series of cleavage divisions leading from a zygote to a blastocyst competent to implant in the maternal uterus and continue development. Cytokinesis, the creation of two daughter cells with a full complement of chromosomes and cytoplasmic organelles, is clearly a process fundamental to successful preimplantation embryonic development. The classical process of animal cell cytokinesis entails the formation of a cleavage furrow by an actomyosin-based contractile ring. The contracting furrow eventually comes into contact with and compresses the microtubule-based central spindle to form the mid-body. Fusion of membrane vesicles with the ingressing plasma membrane provides additional plasma membrane at the site of cell division. Upon completion of cytokinesis, the contractile ring and central spindle disassemble and the membranes of the daughter cells undergo scission to create two separate intact cells (reviewed in (Glotzer, 2001).
The complex protein machinery involved in cytokinesis and the molecular mechanisms of addition of membrane components at the cleavage furrow to provide sufficient membrane surface area for both daughter cells are gradually being revealed (reviewed in (Albertson et al., 2005; Glotzer, 2005; Matheson et al., 2005). There are evolutionarily conserved components of the cytokinetic machinery, discovered by the identification of proteins from mammalian cell mid-bodies that were subsequently shown to affect cleavage furrow formation or completion in Caenorhabditis elegans (Skop et al., 2004). Interestingly, unique lipid domains play a crucial role in the cleavage furrow membrane and in the process of cytokinesis in both mammalian cells (Emoto and Umeda, 2000; Emoto et al., 2005) and in yeast (Wachtler et al., 2003; Takeda et al., 2004). In theory, the lipid composition of the furrow membrane may contribute not only to the recruitment and formation of additional membrane, but to its capacity to be deformed during ingression, to the generation of signals regulating progression of cytokinesis, and to the delivery of proteins to the furrow (Matheson et al., 2005).
Lipid rafts are specialized membrane microdomains enriched in largely saturated sphingolipids and cholesterol. Lipid rafts are resistant to solubilization with non-ionic detergents, and they exhibit light buoyant density in sucrose gradients after ultracentrifugation (reviewed in (Brown and London, 1998; Pike, 2004). Aside from cytokinesis, lipid rafts play a role in signal transduction, acting as organizing centers or platforms for proteins involved in the initiation and propagation of signaling events (Simons and Toomre, 2000). Detection of lipid rafts in intact membranes is not a trivial matter and there are several technical challenges (comprehensively reviewed in (Lagerholm et al., 2005). The pentavalent cholera toxin β (CTβ) subunit specifically labels extracellular ganglioside GM1, a marker in most lipid rafts (Brown and London, 1998).
In this paper we report the use of CTβ to test for the presence of lipid rafts in mouse oocytes and preimplantation embryos. CTβ labeling was compared with labeling by other lipophilic dyes containing saturated (Vybrant DiO) or unsaturated (FAST DiO) aliphatic tails to confirm the association of CTβ with raft domains. In oocytes and early embryos we also compared CTβ labeling with that of the non-raft membrane protein actin and with the lectin ConA to verify that the CTβ labeling was raft-specific and developmental-stage specific. We used two methods to detect the CTβ. The first method used a semiconductor nanocrystal quantum dot (Qdot) secondary detection reagent to optimize the fluorescence output signal in our experiments. Quantum dots are an exciting new addition to the fluorescence microscopy armamentarium. They have a high extinction coefficient, exhibit bright and photo-stable fluorescence output and combine broad absorbance spectra with narrow emission spectra that are tunable based on the size of the quantum dot used (Medintz et al., 2005). There has been a description of the use of quantum dots in vital labeling of zebrafish embryos (Rieger et al., 2005), but to the best of our knowledge our study is the first to use Qdots to label mammalian embryos. The second method we used to detect CTβ was direct conjugation of CTβ with Alexa Fluor 594 (CTβ/AF594). We performed the experiments with CTβ/AF594 in order to compare the results with the Qdots. Both methods gave similar raft labeling results.
The functional importance of lipid rafts in preimplantation development was assessed in embryo culture experiments using methyl-β-cyclodextrin (MβCD), which extracts cholesterol from the cell membrane (Ilangumaran and Hoessli, 1998). The effects of MβCD concentration on preimplantation development compared with development of control cultured embryos was evaluated.
Materials and methods
Mice
CBA/Ca and C57BL/6 mice were purchased from the Jackson Lab, Bar Harbor, ME. They were maintained in a day-night controlled room (lights on 4 am to 6 pm EST), with food and water ad libitum. Mouse husbandry followed the National Institutes of Health guidelines and the animal facility was run with Association for the Assessment and Accreditation of Laboratory Animal Care approval.
Collection of oocytes
CBA/Ca female mice were injected at the 9th hour of the light cycle (1 pm EST) with 5 IU equine chorionic gonadotrophin (eCG) (Calbiochem, La Jolla, CA) followed 48 h later by 10 IU human chorionic gonadotrophin (hCG) (Sigma Aldrich, St.Louis, MO). The mice were sacrificed by cervical dislocation at 30 h post hCG. The clutch of ovulated eggs was released by teasing apart the oviduct, followed by treatment with 500 μg/mL hyaluronidase (Sigma Aldrich), for 5–15 minutes at room temperature to disperse the cumulus mass. The eggs were collected in KSOM with amino acids (KSOMAA) (Specialty Media, Phillipsburg, NJ).
Collection of embryos
In a first set of experiments, to determine the timing of the cleavage divisions of the embryos, C57BL/6 female mice were superovulated as described above, and mated with individual C57BL/6 male mice after the hCG injection. The female mice were checked for the presence of a vaginal plug the next morning. The plug-positive mice were sacrificed by cervical dislocation and embryos collected in KSOMAA at the following times post hCG injection (hours): 24, 27, 30, 33, 36, 61, 65, 69, 89, 91. Either the oviduct or the uterus was flushed depending on the developmental stage to be assayed (Nagy et al., 2003).
To generate embryos for lipid raft imaging, CBA/Ca female mice were superovulated, as described above, and mated individually with a single C57BL/6 male immediately after the hCG injection. Embryos were collected the same way as for the homozygous C57BL/6 x C57BL/6 cross. We used the heterozygous CBA/Ca x C57BL/6 cross for the imaging experiments because the embryos are hardy and remain intact during lengthy staining experiments, presumably due to heterosis (Bradford and Nott, 1969).
Preimplantation development kinetics
Time-points for raft labeling were chosen where active cleavage was predicted to be occurring based on retrieval of mixtures of cell numbers at that time point (e.g. both 1- and 2-cell embryos present at the same time point, or both 4- and 8-cell embryos present at the same time point post hCG). In order to determine when these points occurred, we performed a kinetics experiment following preimplantation development from 24 h (zygote stage) to 91 h (blastocyst stage) post hCG.
The number of 1- and 2-cell embryos was determined visually using a dissection microscope. Later stage embryos containing more than 2, but fewer than 8 cells were stained with 2 μg/ml Hoechst 33342 (Invitrogen/Molecular Probes, Eugene, OR) at room temperature for 15–20 minutes, then washed twice in KSOMAA. The stained embryos were imaged at 200X on a Nikon (Garden City, NY) Diaphot inverted microscope using a 2.2.1 Spot Camera (Diagnostic Instruments, Sterling Heights, MI). Hoechst-stained embryos were imaged using both ultraviolet epifluorescence and differerential interference contrast (DIC) microscopy. Embryos with more than 8 cells were subjected to the Tarkowski procedure (Tarkowski, 1966) to assess the cell number per embryo. Briefly, the embryos were washed twice in KSOMAA and placed in 0.8% sodium citrate for 5–15 minutes at room temperature. The embryos were then transferred to a clean slide in a minimal volume of sodium citrate solution and the cells dispersed by immediate addition of 0.02 mL drops of freshly prepared fixative (3 parts absolute ethanol:1 part glacial acetic acid). Where necessary, scattering of nuclei was assisted by blowing on the embryos during air drying. Finally, the preparations were stained in a 1:20 Giemsa solution for at least four hours, then destained for the same amount of time in distilled water. Embryos subjected to the Tarkowski procedure were imaged at 300X as described above, using DIC optics only. Stained nuclei in the embryo images were subsequently counted using the manual counting tool in Metamorph software (Molecular Devices, Downingtown, PA).
Staining of lipid rafts in oocytes and embryos using Qdots
In a second set of experiments lipid rafts in oocytes and embryos were labeled for lipid rafts. After collection, oocytes and embryos were washed twice in 200 μL KSOMAA. All subsequent steps were done in phosphate buffered saline with 1% bovine serum albumin (Sigma Aldrich) and 0.1% sodium azide (Fisher Scientific), pH 7.4 (PBSAZ) at room temperature unless otherwise stated. Staining steps were performed in 20 μL microdrops of PBSAZ in plastic petri dishes (Fisher Scientific), and shielded from light after addition of fluorescent reagents. Between each staining step the oocytes and embryos were washed in three sequential microdrops of PBSAZ for 10 minutes per drop at room temperature. To label the cell nuclei, the oocytes and embryos were incubated with Hoechst 33342 diluted to 1μg/mL in PBSAZ for ten minutes. The samples were washed in PBSAZ followed by incubation with 10 μg/mL biotinylated CTβ (Invitrogen/Molecular Probes) for 40 minutes. In some experiments, the oocytes and embryos were then washed and transferred into a solution of goat anti-CTβ (Calbiochem, San Diego, CA) at a 1:100 dilution for 30 minutes to enhance GM1 patching. After washing, the oocytes and embryos were transferred to microdrops containing 1 nM streptavidin-labeled Qdot 605 nanoparticles (Qdot 605) (Invitrogen/Qdot Corp, Carlsbad, CA) for one hour. The samples were then washed and finally fixed in 3.7% formaldehyde. In negative control samples no biotinylated CTβ was added, but all other steps in the protocol were followed. The results were similar whether or not anti-CTβ antibody was used.
Staining of lipid rafts in embryos using Alexa Fluor 594-conjugated CTβ
Blastocysts were retrieved as previously described. To label the cell nuclei, the embryos were incubated with Hoechst 33342 diluted to 1μg/mL in PBSAZ for ten minutes. The samples were washed in PBSAZ followed by incubation with 10 μg/mL CTβ/AF594 (Invitrogen/Molecular Probes) for 30–40 minutes. In some experiments, the embryos were then washed and transferred into a solution of goat anti-CTβ (Calbiochem, San Diego, CA) at a 1:100 dilution for 30 minutes to enhance GM1 patching. Finally the samples were washed and fixed in 3.7% formaldehyde. The results were similar whether or not anti-CTβ antibody was used.
Staining of lipid rafts in fixed and permeabilized blastocysts
As described above, PBSAZ buffer was used unless otherwise stated and staining was done at room temperature in 20 μL microdrops with three 10 minute washes in PBSAZ between each step. In this protocol, blastocysts were first washed three times in PBSAZ and then fixed in 3.7% formaldehyde for 30 minutes. After fixing, the embryos were permeabilized in 0.5% Triton X-100 for twenty minutes. Normal goat serum at 10% dilution was used for 40 minutes to block non-specific uptake of staining reagents. Nuclei were labeled with Hoechst 33342 as previously described and the embryos were then incubated either with 10 μg/mL biotinylated CTβ for 40 minutes or with 10 μg/mL CTβ/AF594. In some experiments, after washing, the embryos were incubated with goat anti-CTβ at a 1:100 dilution for 30 minutes. After washing, the Qdot treated embryos were transferred to microdrops containing 1 nM streptavidin labeled Qdot 605 for one hour. The samples were then washed. The Alexa Fluor 594 treated embryos required no further processing after the goat anti-CTβ step, except for a final washing step. In negative control samples no CTβ was added, but all other steps in the protocol were followed. The results were similar whether or not anti-CTβ antibody was used.
Staining of embryos using Vybrant DiO and FAST DiO
In a third set of experiments, we used Vybrant DiO (Invitrogen/Molecular Probes), a lipophilic dye containing saturated aliphatic tails, and FAST DiO (Invitrogen/Molecular Probes), a lipophilic dye containing unsaturated aliphatic tails, to confirm the association of CTβ with raft domains. Minimally fluorescent in aqueous solutions, these dyes became strongly fluorescent once incorporated in lipid membranes and can be visualized with fluorescein optical filter sets. As previously described cleaving 2-cell embryos were retrieved from CBA/Ca females. PBSAZ was used as the buffer for both Vybrant DiO and FAST DiO. Vybrant DiO was added to give a final concentration of 5 μL/mL in PBSAZ per the manufacturer’s instructions. The FAST DiO stock solution was prepared by dissolving in dimethylformamide (Sigma Aldrich) at 2.5 mg/mL, with sonication and heating to 50°C. The FAST DiO stock solution was then diluted with PBSAZ to give a final concentration of 25 μg/mL. Embryos were incubated with the dyes in 20 μL microdrops for 30 minutes at room temperature, followed by three 10 minute washes in PBSAZ. In one experiment, labeling with Vybrant DiO at room temperature was compared to labeling at 37°C. To label the cell nuclei, the embryos were incubated with Hoechst 33342 diluted to 1 μg/mL in PBSAZ for five to ten minutes. In some experiments, oocytes or embryos were co-stained with CTβ/AF594. Finally the samples were washed and fixed in 3.7% formaldehyde.
Staining of actin in 2-cell embryos using phalloidin
In a fourth set of experiments, we used phalloidin to label actin in order to compare the distribution of lipid rafts with that of a non-raft membrane protein of known distribution in cleaving 2-cell embryos (Gallicano, 2001). PBSAZ buffer was used and staining was done at room temperature in 20 μL microdrops with three 10 minute washes in PBSAZ between each step. Phalloidin conjugated with Alexa Fluor 488 (phalloidin/AF488) (Invitrogen/Molecular Probes) was prepared in accordance with the manufacturer’s instructions. Samples were fixed with 3.7% formaldehyde for 10 minutes at room temperature. To label the cell nuclei, the embryos were incubated with Hoechst 33342 diluted to 1 μg/mL in PBSAZ for five to ten minutes followed by a wash step. The samples were then permeabilized with 0.5% Triton X-100 in PBSAZ for three minutes, followed by another wash step. The stock of phalloidin/AF488 was diluted 1:40 in PBSAZ and the samples incubated for 20 minutes at room temperature. Where the embryos were co-stained with CTβ/AF594, the CTβ reagent was added at 10 μg/mL simultaneously with the phalloidin/AF488.
Staining of zygotes with ConA
In a fifth set of experiments, we decided to look at earlier zygotes (24 h post hCG compared with 30 h post hCG) to examine the pattern of distribution of CTβ in the membrane closer to the time of fertilization. As a comparative control marker, to ensure that the CTβ labeling was specific and to compare the distribution of CTβ with that of a non-raft membrane component, we used ConA conjugated with Alexa Fluor 488 (ConA/AF488, Invitrogen/Molecular Probes) to label lectin receptors. The distribution of the ConA receptor in zygotes has been documented and ConA labeling was shown to be heterogeneous in zygotes around the time of fertilization. Areas of the zygote membrane with lower concentrations of microvilli such as the nipple region overlying the egg chromosomes and the fertilization cone that forms at the site of sperm entry are reported to have reduced expression of ConA receptors (Maro et al., 1984). We used succinylated ConA because it is irreversibly converted to a dimer form that has the same specificity as the tetrameric form but it does not induce capping of cell surface glycoprotein receptors. Zygotes were retrieved from CBA/Ca females at 24 h post hCG as previously described. PBSAZ buffer was used and staining was done at room temperature in 20 μL microdrops with three 10 minute washes between each staining step. To label the cell nuclei, the embryos were incubated with Hoechst 33342 diluted to 1 μg/mL in PBSAZ for three to five minutes followed by a wash step. Samples were incubated in ConA/AF488 at 100 μg/mL for twenty minutes at room temperature. Where the zygotes were co-stained with CTβ/AF594, the CTβ reagent was added at 10 μg/mL simultaneously with the ConA/AF488. Finally the samples were washed and fixed in 3.7% formaldehyde. In additional experiments, zygotes were first fixed and then permeabilized with 0.02% saponin (from quillaja bark, Sigma Aldrich) for 30 minutes at room temperature prior to staining. Saponin is a mild detergent that specifically extracts cholesterol from the cell membrane (Lin et al., 1990).
Image acquisition and processing of stained embryos
Once staining of the oocytes and embryos had been completed, the samples were placed in 10 μL microdrops of PBSAZ on glass-bottomed dishes (MatTek Corporation, Ashland, MA) and the microdrops were covered in light mineral oil to prevent evaporation. Images were taken 24–72 h after completion of staining. Images were acquired using the differential interference contrast (DIC) and epifluorescence modalities of the unique Keck 3-D fusion microscope at Northeastern University, Boston, MA (Warner et al., 2004) and a 2.2.1 Spot Camera (Diagnostic Instruments). A 20X or 40X 0.8 NA, Fluor corrected water objective with a 2 mm WD was used for fluorescence imaging. For blue emission, the following filter parameters applied: excitation 360/40, dichroic 4001p, and emission 460/50. For green emission excitation was 480/30, dichroic 5051p, and emission 535/40. For red emission excitation was 540/25, dichroic 5651p, and emission 620/60. The images, representing a single focal plane, when the DIC image was in focus, were analyzed using Metamorph software. Given the clear localization and bright fluorescence of the Qdot 605 labeling reagent, image processing was limited to cropping of images and enhancement of the contrast of the Hoechst 33342 nuclear staining.
Embryo culture with and without methyl-β-cyclodextrin
In a final set of experiments the effect of methyl-β-cyclodextrin, a known disruptor of lipid rafts by the extraction of cholesterol, was tested for its effect on preimplantation embryo development. KSOMAA aliquots were prepared with 10.0 mM, 5.0 mM, 1.0 mM, 0.5 mM or 0.1 mM MβCD (Sigma Aldrich) and pre-warmed at 37° C, 7% CO2 until the reagent was completely dissolved before use. A control aliquot was also pre-warmed in the same conditions. Light mineral oil (Fisher Scientific, Pittsburgh, PA) was pre-equilibrated with a portion of each of the prepared media aliquots using a nutator for 2–4 hours and centrifuged before use of the equilibrated mineral oil to cover culture microdrops. Culture microdrops of each of the prepared media were placed on separate embryo tested plastic culture dishes (Fisher Scientific), covered with equilibrated mineral oil and placed in a water-jacketed incubator at 37° C, 7% CO2 for 2–4 hours before use. One-cell zygotes were retrieved at 24–30 h post hCG from plug positive CBA/Ca females that had been superovulated and mated with C57BL/6 males as described above. Where cumulus cells still surrounded the zygotes, they were treated with 500 μg/mL hyaluronidase as described for oocyte collection. The zygotes were collected in KSOMAA medium and following hyaluronidase treatment, the zygotes were washed twice in KSOMAA and then added to the microdrops of KSOMAA and KSOMAA with MβCD, with 10 zygotes per 20 μl drop. The cultures were examined 18 hours later and the numbers of 2-cell embryos present in each drop recorded. Thereafter, the cultures were checked at 24 h intervals for another 72 h and the numbers of four-cell embryos, 8 or higher cell embryos, and blastocysts were sequentially recorded. The drops containing 10.0 and 5.0 mM MβCD were clearly toxic to the embryos after the first 18 hours in culture and those concentrations were not repeated. Repeat experiments were performed for the 1.0 mM, 0.5 mM and 0.1 mM concentrations with appropriate controls. Thirty to forty embryos were cultured for each concentration of MβCD and each control plate in all of the experiments.
Results
Preimplantation development kinetics
In the first set of experiments we measured the rate of development of mouse preimplantation embryos from two mouse strains, C57BL/6 and CBA/Ca, to select time points for imaging of the embryos. Although we did not collect kinetic data for the CBA/Ca x C57BL/6 cross, we predicted that this cross would show the same kinetics as the C57BL/6 parent. The reason is that the C57BL/6 strain expresses the fast allele of the mouse preimplantation embryo development (Ped) gene and the fast allele is dominant over the slow allele that is expressed by the CBA/Ca strain (Goldbard et al., 1982). This prediction turned out to be true because the developmental time points chosen for imaging the heterozygous cross gave exactly the stages predicted.
Table 1 shows the kinetics of development of C57BL/6 embryos from the 1-cell to the 2-cell stage. Based on these data we selected 30 h post hCG as the time to find both fertilized zygotes and embryos undergoing cytokinesis at the 1- to 2-cell transition. Table 2 compares the numbers of cells in the C57BL/6 embryos at several subsequent time points post hCG. Based on these data, we selected 61 h post hCG to find cells undergoing the 4–8 cell transition, 89 h post hCG to assay morulae, and 91 h post hCG to examine blastocysts because the majority of embryos were at the desired stage at those times.
Table 1.
Time course of 1–2 cell transition in mouse embryos.
| h post hCG | # Mice (Plug +) | # Total Embryos | # 1-Cell Embryos | # 2-Cell Embryos | % 2-cell Embryos |
|---|---|---|---|---|---|
| 24 | 4 | 91 | 91 | 0 | 0 |
| 27 | 11 | 170 | 162 | 8 | 5 |
| 30 | 6 | 101 | 71 | 30 | 30 |
| 33 | 6 | 88 | 28 | 60 | 68 |
| 36 | 5 | 106 | 38 | 68 | 68 |
Table 2.
Time course of mouse preimplantation embryo development.
| h post hCG | Embryo Stage | # Mice (Plug +) | # Total Embryos | Mean Cell #/Embryo ± SEM |
|---|---|---|---|---|
| 61 | 4–8 cell | 7 | 68 | 6.5 (0.2) |
| 65 | 6–8 cell | 12 | 70 | 7.5 (0.3) |
| 69 | 8 cell-morula | 12 | 53 | 10.2 (0.4) |
| 89 | morula-blastocyst | 8 | 91 | 26.2 (0.6) |
| 91 | blastocyst | 7 | 22 | 31.3 (0.6) |
Staining of lipid rafts in oocytes and embryos using Qdots
In the second set of experiments we assayed embryos for the presence and location of lipid rafts by using Qdots. The imaging results are shown in Figures 1 (A–L), 2 (A–I), and 3 (A–I). The data are presented as rows of images of the same sample, where images on the left are the DIC images, the images in the middle are cell nuclei labeled with Hoechst 33342, and the images on the right are lipid raft labeling.
Figure 1.
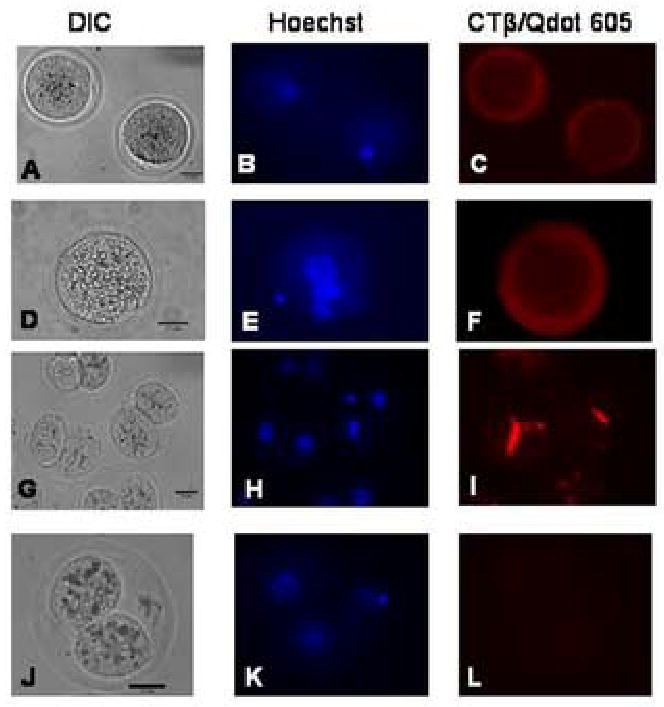
Lipid Rafts in oocytes, zygotes, and 2-cell embryos labeled with Qdots. The data are presented in rows of images from the same samples, where the image on the left is the DIC image, the image in the middle is cell nuclei labeled with Hoechst 33342, and the image on the right is lipid raft labeling using biotinylated CTβ and streptavidin-conjugated Qdot 605 nanoparticles. The scale bar (25 μm) is shown in the DIC image in each set of images.
A–C: Oocytes, showing uniform labeling of rafts in the cell membrane at 30–33 h post hCG. The images shown are representative of 12 oocytes from one experiment. Seven control oocytes were also labeled with Qdots in the absence of biotinylated CTβ to confirm the specificity of the staining.
D–F: Zygote, showing uniform labeling of the cell membrane, similar to that seen in oocytes. Eleven sample zygotes and ten controls were used for the experiment represented in the image, at 30 h post hCG.
G–I: 2-cell embryos completing the first cell division from zygote to 2-cell, showing enrichment of lipid rafts at the cleavage furrow. Twenty six sample embryos and 20 controls at 30 h post hCG were used for the experiment represented in the images.
J–L: Representative control staining of a 2-cell embryo labeled with Qdots in the absence of biotinylated CTβ to confirm the specificity of the staining.
Figure 2.
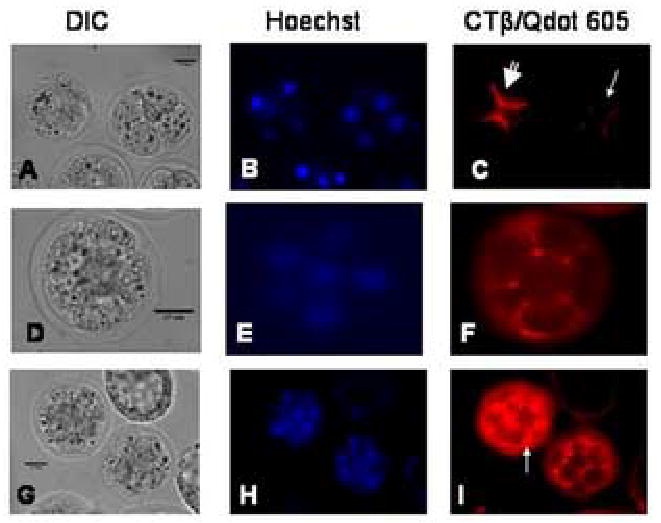
Lipid rafts in 4-cell, 6-cell, and morula stage embryos labeled with Qdots. Twelve sample embryos and six controls at 61 h post hCG were used for the experiment represented in the images. A–C: 4-cell embryos showing enrichment of lipid rafts at the cleavage furrow. In C, the large arrow indicates an embryo actively undergoing cytokinesis; the smaller arrow shows an embryo where cytokinesis is nearing completion. The scale bar (25 μm) is shown in the DIC image in each set of images.
D–F: A 6-cell embryo showing raft enrichment at the cleavage furrow.
G–I: Morula stage embryos showing lipid raft enrichment at the cleavage furrow and at the apical edge of the blastomeres (see arrow). Nine sample and 3 control morulae at 89 h post hCG were used for the experiment represented in the images.
Figure 3.
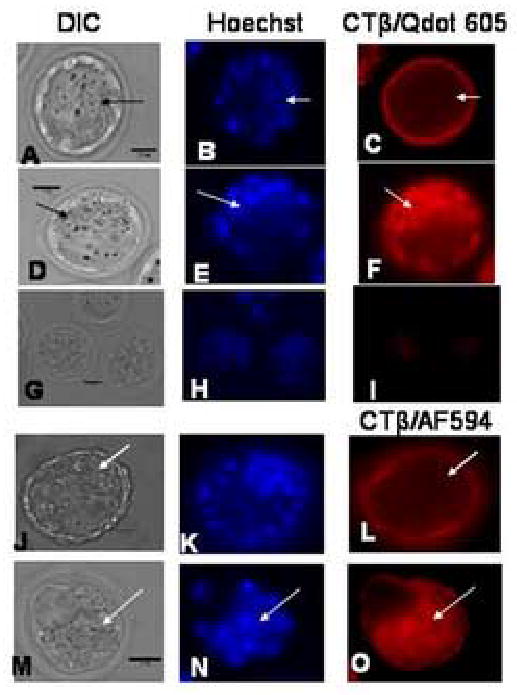
Lipid rafts in blastocyst stage embryos, non-permeabilized and permeabilized, labeled with Qdots and AF594. The scale bar (25 μm) is shown in the DIC image in each set of images.
A–C: Non-permeabilized blastocyst with lipid rafts imaged with Qdots. The lipid raft staining is confined to the trophectoderm (TE) with none apparent in the inner cell mass (ICM). The ICM is indicated by arrows. Seventeen blastocyst and five controls at 91 h post hCG were used for the experiment represented in the images.
D–F: Permeabilized blastocyst with lipid rafts imaged with Qdots. The lipid raft staining is found on both the TE and ICM. The ICM is indicated by arrows. Ten blastocyst and five controls at 91 h post hCG were used for the experiment represented in the images.
G–I: Representative control staining of blastocysts labeled with Qdots in the absence of biotinylated CTβ to confirm the specificity of the staining. Ten blastocyst and five controls at 91 h post hCG were used for the experiment represented in the images
J–L: Non-permeabilized blastocysts with lipid rafts imaged with CTβ/AF594. The lipid raft staining is confined to the TE with none apparent in the ICM. The ICM is indicated by arrows.
M–O: Permeabilized blastocyst with lipid rafts imaged with CTβ/AF594. The lipid raft staining is found on both the TE and ICM. The ICM is indicated by arrows. A total of 32 sample and 7 control blastocysts at 91 h post hCG were used for the experiment represented in the images.
Oocytes (Fig. 1 A–C) and zygotes (Fig. 1 D–F) both showed uniform distribution of lipid rafts throughout the cell membrane at 30 h post hCG. 2-cell embryos completing the first cleavage division showed clear enrichment of lipid rafts at the site of the cleavage furrow (Fig. 1 G–I). Negative control staining by incubation of embryos with streptavidin/Qdot 605 in the absence of CTβ biotin primary gave very low background at all stages of preimplantation development assayed, with the 2-cell stage shown as an example (Fig. 1 J–L). Additional negative controls were done using an irrelevant biotinylated goat anti-rat IgG instead of biotinlyated CTβ, and these controls also showed minimal background (data not shown).
Furrow membrane enrichment of lipid rafts was again seen in the second cleavage division to four cells (Fig. 2 A–C). Two embryos are shown in Fig. 2 A–C. The embryo on the left had no discernible interior blastomere cell membranes by DIC (Fig. 2 A), but showed strong staining of lipid rafts (Fig. 2 C, large arrow), implying that the cells of the embryo are actively undergoing cytokinesis. The embryo on the right had distinct interior cell membranes visible by DIC (Fig. 2 A), but the lipid rafts between the cells were much diminished (Fig. 2 C, small arrow), implying that the cells in this embryo had almost completed cytokinesis. A six cell embryo reiterated the pattern seen in the earlier stages and this is shown in Figure 2 (D–F).
In later stage preimplantation embryos, it can be difficult to visually discriminate individual blastomeres and cleavage furrows in DIC images due to increasing cell number and stacking. In Figure 2 (G–I) we show that morula stage embryos were also lipid raft enriched at the cleavage furrow, but we also noted that rafts were enriched at the outer (apical) edge of the blastomere membranes in morulae, where the trophectoderm (TE) layer will later be formed in the blastocyst (Fig. 2 I, see arrow).
Staining of lipid rafts in fixed and permeabilized blastocysts
Blastocysts, where cells have differentiated into the inner cell mass (ICM) and the TE layer, exhibited a striking pattern of raft labeling with all staining confined to the TE and none apparent in the ICM. This pattern is shown in Figure 3 A–C, with the ICM labeled by an arrow in each image. To determine whether epithelial tight junctions were preventing access of labeling reagents to the ICM in blastocysts, we fixed and permeabilized blastocysts before labeling the lipid rafts using the same staining protocol used for the non-permeabilized embryos. In Figure 3 (D–F), labeling of lipid rafts in the ICM (shown with arrows) is apparent in permeabilized embryos suggesting that an epithelial barrier was responsible for the lack of staining seen in the ICM of non-permeabilized blastocysts (Fig. 3A–C). Control staining of blastocysts with streptavidin Qdots in the absence of biotinlyated CTβ is shown in Figure 3 G–I.
Staining of lipid rafts in blastocysts using CTβ/AF594
We validated the staining of embryos with Qdots by repeating the imaging experiments with CTβ directly labeled with AF594 (CTβ/AF594). We labeled both non-permeabilized (Fig. 3 J–L) and permeabilized (Fig. 3 M–O) blastocysts with AF594 and got the same results as we did for labeling non-permeabilized (Fig. 3 A–C) and permeabilized (Fig. 3 D–F) blastocysts with Qdots. Given the similar results obtained with Qdots and CTβ/AF594, the inability to label GM1 in the ICM without permeabilization can not be attributed to the Qdots themselves.
Staining of of embryos with Vybrant DiO and FAST DiO
The purpose of the third set of experiments was to confirm that the CTβ labeling was diagnostic of the presence of lipid rafts containing cholesterol and sphingolipids. We performed experiments that probed the membrane of 2-cell embryos with other lipophilic dyes that contained either saturated or unsaturated lipid tails and compared the results with the CTβ labeling of GM1.
In Figure 4, we show the results of comparative staining of 2-cell embryos with CTβ/AF594 and either Vybrant DiO (unsaturated) or FAST DiO (saturated). The data are presented as rows of images of the same sample, where images on the left are the DIC images, followed sequentially by cell nuclei labeled with Hoechst 33342, the cell membrane labeled with CTβ/AF594, the cell membrane labeled with Vybrant DiO or FAST DiO and finally the overlay image of the nuclear and membrane stains. Figure 4 A–E shows a 2-cell embryo simultaneously labeled with CTβ/AF594 (Fig. 4 C) and Vybrant DiO (Fig. 4 D), with minimal co-localization apparent as a yellow color in the overlay image (Fig. 4 E). Consistent with our other experiments, the detection of GM1 by CTβ/AF594 showed predominantly surface labeling (Fig, 4 C). In this embryo, which had almost finished cytokinesis, CTβ labeling can be seen throughout the membrane although it is still more evident at the cleavage furrow. The Vybrant DiO dye did not label the cell membrane but instead labeled the endoplasmic reticulum as it was being redistributed along the spindle axis in the daughter cells (Fig. 4 D). The same results were obtained with Vybrant DiO in experiments done at room temperature and experiments done at 37μC (data not shown). This interesting result is addressed in the discussion.
Figure 4.
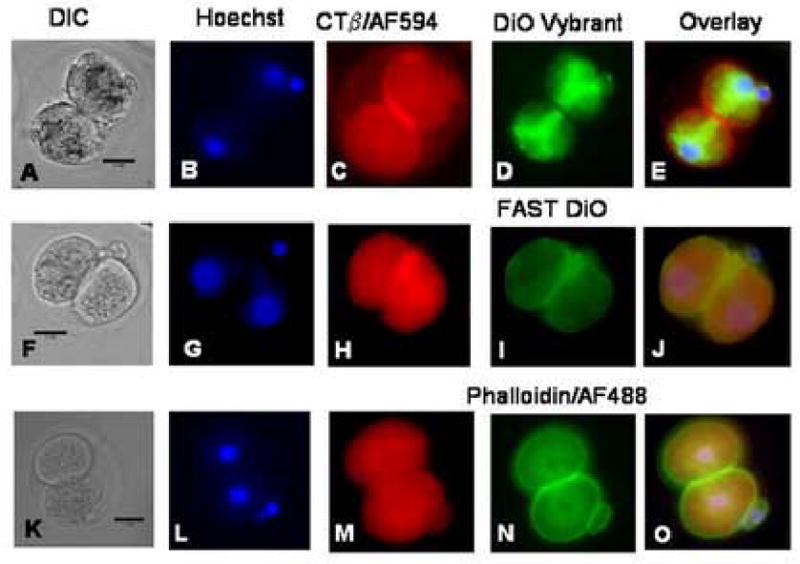
Lipid rafts in 2-cell embryos stained with Vybrant DiO, FAST DiO and phalloidin/AF488 reagents simultaneously with CTβ/AF594. The data are presented in rows of images from the same samples, where the image on the left is the DIC image, the second image is of the cell nuclei labeled with Hoechst 33342, the third image is lipid raft labeling using CTβ/AF594, the fourth image shows the Vybrant DiO, FAST DiO or phalloidin/AF488 labeling and the final image is an overlay of the three preceeding images. Co-localization of reagents is indicated in yellow in the overlay images. The scale bar (25 μm) is shown in the DIC image in each set of images.
A–E: 2-cell embryo labeled with Hoechst, CTβ/AF594 and Vybrant DiO reagent. The CTβ/AF594 labeling is in the cell membrane, and concentrated in the furrow region. The Vybrant DiO reagent did not label the cell membrane but instead labeled the endoplasmic reticulum, which is being distributed between the daughter cells after cytokinesis along the mitotic spindle (D). The absence of co-localization of the labeling reagents is apparent in the overlay image (E). Fifteen 2-cell embryos and ten controls at 30 h post hCG were used for the experiment represented in the images.
F–J: 2-cell embryo labeled with Hoechst, CTβ/AF 594 and FAST DiO reagent. Intracellular labeling with CTβ/AF 594 is apparent in this sample (H), and co-localization of the cholera toxin labeling and FAST DiO is seen in the cell membrane (J). The nuclei appear pink in this overlay image. Little intracellular staining with FAST DiO is visible (I). Thirteen 2-cell samples (30 h post hCG) and 18 controls were imaged for the experiment represented in the images.
K–O: 2-cell embryo labeled with Hoechst, CTβ/AF594 and phalloidin/AF488. The embryos were fixed and permeabilized with Triton X-100 before the labeling reagents were applied. CTβ/AF594 labeling in this experiment was more apparent intracellularly than in the cell membrane (M). The permeabilization with Triton X-100 effectively disrupted the membrane distribution of rafts labeled with GM1 (M). The expected predominantly cortical distribution of actin labeled with phalloidin/AF488 was seen (N). Fifteen two cell embryos and seven unpermeablized control embryos were imaged for the experiment shown.
Simultaneous staining with CTβ/AF594 and FAST DiO (Fig. 4 F–J) gave different results than simultaneous staining with CTβ/AF594 and Vybrant DiO (Fig. 4 A–E). First of all, the presence of FAST DiO altered the membrane staining pattern of CTβ/AF594 resulting in more intracytoplasmic staining (Compare Fig. 4 H with both Fig. 1 I and Fig. 4 C). Second, the FAST DiO showed a similar staining pattern to CTβ/AF594 staining in that both were concentrated in the cleavage cleft (yellow in overlay in Fig. 4 J), but FAST DiO showed little intracellular staining (Fig. 4 I).
Staining of embryos using phalloidin for actin staining
In the fourth set of experiments, to test the specificity of CTβ labeling of lipid rafts in oocytes and embryos, we labeled both GM1 and the non-raft associated membrane molecule actin. Actin is known to be cortically distributed in early embryos (Gallicano, 2001). In Figure 4 K–O, we show the results of simultaneous staining with CTβ/AF594 and phalloidin/AF488 in 2-cell embryos. The data are presented as rows of images of the same sample, where images on the left are the DIC images, followed sequentially by cell nuclei labeled with Hoechst 33342, the cell membrane labeled with CTβ/AF594, actin labeled with phalloidin/AF488 and finally the overlay image of the CTβ and actin stains with membrane co-localization shown in yellow and the nuclei shown in pink. The standard manufacturer’s protocol for labeling actin with phalloidin called for fixing of the membrane, then permeabilization with Triton X-100 before staining. Triton X-100 is a disruptor of lipid rafts, and it is apparent in Fig. 4 M that GM1 appeared to be redistributed into the cytoplasm after raft disruption with Triton X-100, with reduced concentration in the cell membrane. This is similar to the redistribution of CTβ/AF594 seen with FAST DiO in Fig. 4 H, and contrasts with the distribution seen in Figs. 1 I and 4 C in the absence of raft disruption. These results confirm that actin is located in a ring below he plasma membrane and show that embryo membrane labeling with CTβ is lipid dependent.
Staining of zygotes with ConA
In the fifth set of experiments the relative distribution patterns of rafts labeled with CTβ/AF594 and of non-raft lectins labeled with ConA/AF488 in a zygote shortly after fertilization were assayed. In Figure 5 A–E the data are presented as rows of images of the same sample, where images on the left are the DIC images, followed sequentially by cell nuclei labeled with Hoechst 33342, the cell membrane labeled with CTβ/AF594, the cell membrane labeled with ConA/AF388 and finally the overlay image of the CTβ and ConA stains with membrane co-localization shown in yellow. In the DIC image (Fig. 5 A), the sperm entry point is shown with a black arrowhead, and the nipple region that indicates the future site of polar body formation is shown with a white arrowhead. The sperm head and oocyte chromosomes are shown in the Hoechst-stained image in Fig. 5 B. CTβ/AF594 labeling in the zygote membrane at the time point assayed appears diffuse but with regions of very distinct labeling indicated with arrows in Fig. 5 C. ConA/AF488 staining appeared to be predominantly cytoplasmic (Fig. 5 D). Labeling was similar whether the samples had been fixed at the beginning or at the end of the staining process (data not shown).
Figure 5.
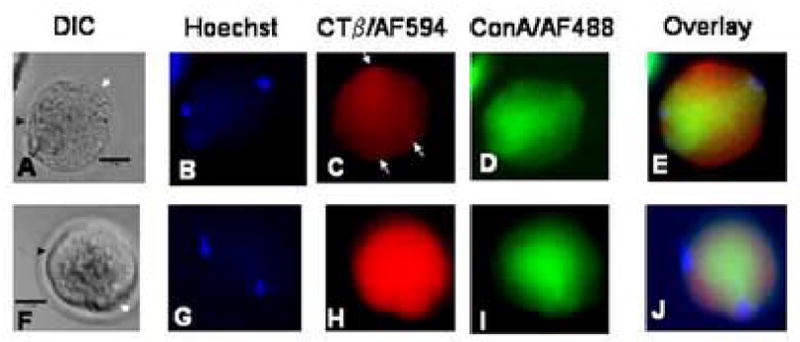
Lipid rafts in zygotes stained with ConA/AF488 for lectin simultaneously with CTβ/AF594. The data are presented in rows of images from the same samples, where the image on the left is the DIC image, the second image is of the cell nuclei labeled with Hoechst 33342, the third image is lipid raft labeling using CTβ/AF594, the fourth image shows staining with ConA/AF488 and the final image is an overlay of the three preceeding images. Co-localization of reagents labeled with CTβ/AF594 and ConA/AF488 is indicated in yellow in the overlay images. The scale bar (25 μm) is shown in the DIC image in each set of images.
A–E: Zygote labeled with Hoechst, CTβ/AF594 and ConA/AF488. In the DIC image (A), the sperm entry point is labeled with a black arrowhead, and the nipple region where the second polar body will be extruded is shown with a white arrowhead. In the Hoechst-labeled image (B), the metaphase plate under the nipple and the sperm head can be seen, corresponding with the arrows in A. CTβ/AF594 labeling appears diffuse in the membrane with some regions of strong focal staining in the cell membrane as shown by the arrows (C). Lectin labeling with ConA/AF488 was diffuse, and intracytoplasmic staining appears to predominate (D). In the overlay image (E), it is apparent that there are distinct patterns of distribution of lectin labeled with ConA/AF488 and lipid rafts labeled with CTβ/AF594.
F–J: Zygote labeled with Hoechst, CTβ/594 and ConA/AF488 after treatment with saponin. In the DIC image (F), the sperm entry point is labeled with a black arrowhead, and the nipple region with a white arrowhead. The oocyte metaphase plate and the sperm head are visible in the Hoechst-labeled image (G). CTβ/AF594 labeling is diffuse after saponin treatment (H), and no defined regions of stronger focal CTβ staining can be seen in the membrane, in contrast to the image in C in the absence of saponin. Lectin labeling with ConA/AF488 after saponin treatment is similar with that of the untreated sample (I), and in the overlay image it is apparent that the distribution of CTβ-labeled lipid rafts has been disrupted by the saponin treatment step (J). Twenty threes sample zygotes and 17 controls at 24–30 h post hCG were used for the experiments described.
To compare another detergent with the Triton X-100 shown in Fig. 4 K–O, we treated fixed zygotes with saponin, a specific disruptor of cholesterol in the membrane, prior to labeling with ConA/AF488 and CTβ/AF594 and these results are illustrated in Figure 5 F–J. A zygote shortly after sperm entry is again shown, with the nipple region in the DIC image labeled with a white arrowhead and the site of sperm entry labeled with a black arrowhead (Fig. 5 F). The sperm head and oocyte chromosomes are shown in the Hoechst-stained image in Fig. 5 G. The CTβ/AF594 staining in the saponin-treated sample appeared diffuse in the cytoplasm, with no focal staining regions noted (compare Fig. 5 H to Fig. 5 C). ConA labeling in the saponin-treated sample (Fig. 5 I), was similar to that of the untreated sample (Fig. 5 D). In comparison with the overlay image in Fig. 5 E, it was evident in the saponin treated overlay (Fig. 5 J) that saponin, like Triton X-100 in Figure 4 K–O, disrupted GM1-containing rafts and that the rafts in turn were cholesterol dependent.
Embryo culture with and without methyl-β-cyclodextrin
Finally, in the last set of experiments, we report the results of experiments where the effects of varying concentrations of MβCD on preimplantation development of cultured embryos was explored. Control embryos flushed at 30 h post hCG as zygotes, from plug positive superovulated CBA/Ca females mated with C57BL/6 males, and cultured in KSOMAA for 18 h at 37°C in 7% CO2 have either completed division to 2-cell or, if incompetent to develop further, remain at the one-cell stage (Fig. 6 A). Zygotes flushed at the same time and cultured for 18 h in 1 mM MβCD superficially appeared to have reached the 2-cell stage, but completion of cytokinesis was compromised in a majority of embryos (arrows, Fig. 6 B). Culture of zygotes for 18 h in 5 or 10 mM MβCD resulted in death of all of the embryos (Fig. 6 C), and indeed the embryos cultured in 1 mM MβCD also died after an additional 24 h in culture.
Figure 6.
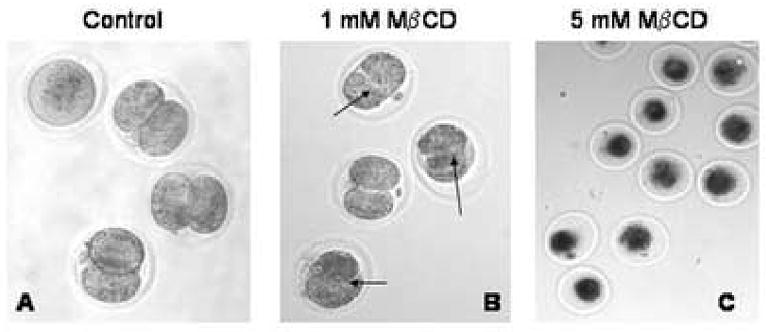
Effect of MβCD on preimplantation embryo development in culture.
A. Representative DIC image of control embryos after 18 h in culture in KSOMAA in the absence of MβCD.
B. Embryos after 18 h in culture in KSOMAA with 1mM MβCD, showing that cytokinesis was compromised compared with the controls in A.
C. Embryos after 18 h in culture in KSOMAA with 5 mM MβCD. This concentration of MβCD was clearly toxic to the embryos.
Additional embryos were cultured with concentrations of MβCD ranging from 0.1 mM to 10.0 mM and compared with control cultures. The results of the culture experiments are shown in Figure 7. Zygotes were flushed from the oviducts of CBA/Ca females mated with C57BL/6 males at 30 h post hCG and cultured in KSOMAA with or without MβCD as indicated. Results for control embryos are shown in white bars, embryos cultured in 0.1mM MβCD in grey bars, in 0.5 mM MβCD in striped bars, in 1.0 mM MβCD in black bars, in 5 mM MβCD in cross-hatched bars and 10 mM MβCD in checkered bars. The x-axis records the percentages of embryos that successfully completed the sequential transition from 1- to 2-cell, 2- to 4-cell, 4- to 8-cell, and 8-cell to blastocyst stage. The Y axis records the % of embryos undergoing cell division. The embryos were first evaluated after 18 h in culture, and thereafter at 24 h intervals until the control embryos had reached the expanded blastocyst stage. MβCD concentrations of 5.0 and 10.0 mM were toxic within the first 18 h as indicated above (Fig. 6 C) and no successful divisions to 2-cell were recorded. Given this toxicity, these concentrations were not repeated. The rest of the data were obtained from two independent culture experiments at the remaining concentrations. After 18 h, an average of 60% of control embryos was at the 2-cell stage (in one experiment the % development of controls was unusually low at 40%, bringing down the average). Zygotes cultured in 0.1 mM MβCD had an average of 79% development to 2-cell, while 72% of zygotes cultured in 0.5 mM MβCD developed to 2-cell. Zygotes in 1.0 mM MβCD had 81% development to 2-cell, although with the defects in completion of cytokinesis shown in Fig. 6 B. After another 24 h in culture, 100% of control embryos that had reached 2-cell successfully completed the transition to the four-cell stage, and 81% of embryos in 0.1 mM MβCD also made the transition. Embryos cultured in 0.5 mM MβCD had only 20% development to four-cell. No embryos in the 1.0 mM culture survived to the second time point. At the next time point, we evaluated transition from four-cell to 8 or more cells and 94% of controls, 66% of 0.1 mM cultures and 0% of 0.5 mM cultures made the transition. The critical transition to blastocyst was the last developmental stage assayed and while 97% of control 8-cell embryos developed to expanded blastocysts, only 16% of embryos cultured in 0.1 mM MβCD made the transition to blastocyst, and they were all early rather than expanded blastocysts at the end of the experiment.
Figure 7.
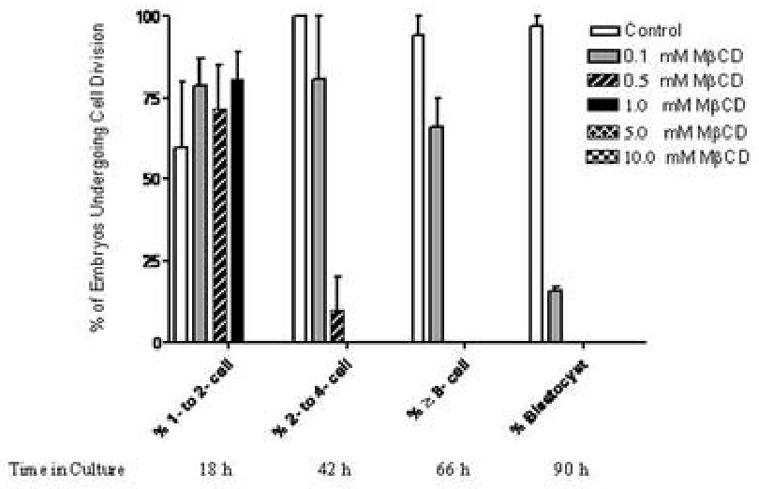
Effect of MβCD on preimplantation embryo development in culture. Results for control embryos are shown in white bars, embryos cultured in 0.1mM MβCD in grey bars, in 0.5 mM MβCD in striped bars, in 1.0 mM MβCD in black bars, in 5 mM MβCD in cross-hatched bars and 10 mM MβCD in checkered bars. The X-axis records the percentages of embryos that successfully completed the sequential transition from 1- to 2-cell, 2- to 4-cell, 4- to 8-cell, and 8-cell to blastocyst stage. Below the X-axis label, the time in culture is also noted. The Y-axis records the % of embryos undergoing cell division. Thirty to forty embryos were cultured for each concentration of MβCD and each control sample in each of the two experiments included in these data.
Discussion
This paper presents the first report that mouse oocytes and preimplantation embryos express lipid rafts. The lipid rafts were identified by labeling with CTβ, which binds to GM1 in lipid rafts. We used a Qdot secondary reagent to detect CTβ, a novel application of Qdots in mammalian embryos. Control experiments using lipophilic membrane dyes, detergents and comparison with non-raft associated membrane components confirmed that CTβ labeling was consistent with the detection of cholesterol- and sphingolipid-enriched lipid rafts. We found that lipid rafts were present throughout preimplantation development, with evident enrichment at the time of fertilization, at the cleavage furrow during cytokinesis and in the apical membranes of morula-stage blastomeres. Lipid rafts were also detected in the trophectoderm of blastocysts, but fixation and permeabilization of the embryo was required before rafts in the inner cell mass could be labeled. Experiments using a cholesterol-extracting reagent provided functional data showing that removal of cholesterol from the membrane inhibited preimplantation development in culture. Overall, our results indicate that lipid rafts and their associated proteins are spatio-temporally positioned to play a critical role in preimplantation developmental events. The identification of lipid rafts in oocytes and embryos is exciting because lipid rafts are the sites at which many proteins involved in cell signaling are constitutively located or to which they are recruited upon ligand binding in manyexperimental systems (Simons and Toomre, 2000).
The results reported in this paper continue an examination of the membrane structure of mouse oocytes and preimplantation embryos and its relationship to cell division. Our results expand upon and extend to intact membranes the results of prior studies on the cholesterol content of mouse oocyte and preimplantation embryo membranes that used the aggregation of cholesterol by filipin detected by examination of freeze fracture membrane replicas (Pratt, 1985).
We found a strong association of lipid rafts with the cleavage furrow in cleaving 2-cell embryos and cleaving 4-cell embryos (Fig. 1 I and Fig. 2 C). These results are in contrast with Pratt’s results where areas of cell apposition had a lower density of filipin labeling than other regions of the membrane at the same stage of development. In morulae, in addition to enrichment at the cleavage furrow, we saw clear enrichment of CTβ-labeled rafts at the apical membrane of the blastomeres (Fig. 2 I, see arrow) and this result was consistent with Pratt’s finding that the apical membranes of compacted 8-cell embryos reacted more intensely with filipin. We did note labeling of the basolateral membranes in morulae with CTβ (Fig, 2 I), whereas Pratt reported poor reactivity with filipin but strong reaction with the saponin tomatin. Overall, our results suggest that CTβ and filipin are labeling different structures in the cell membrane.
To confirm that our labeling using CTβ to detect GM1 was consistent with detection of cholesterol- and sphingolipid-enriched rafts, we compared the results of CTβ labeling with the distribution of fluorescent carbocyanine lipophilic dye analogs containing saturated (Vybrant DiO) or unsaturated (FAST DiO) acyl tails. Vybrant DiO exclusively labeled the endoplasmic reticulum in cleaving 2-cell embryos (Fig. 4 A–E) while CTβ/AF594 labeled the cell membrane only, and especially the cleavage furrow. In comparison, FAST DiO co-localized with CTβ in the cell membrane but also appeared to affect lipid rafts in the membrane as intracellular CTβ labeling was evident (Fig. 4 F–J).
Our results are different from those seen in sea urchin eggs. In cleaving sea urchin eggs (Ng et al., 2005), C18 DiL (which is equivalent to C18 Vybrant DiO but with different absorption and emission spectra) labeled the cleavage furrow while FAST DiL (equivalent to FAST DiO) was excluded from the furrow. It is possible that differences in the dye delivery methods contribute to the differences in labeling between cleaving sea urchin eggs and mammalian embryos. In the sea urchin study the reagents were applied to the egg surface as dye-saturated drops of vegetable oil while in our experiments they were applied in aqueous solution. These differences between sea urchin eggs and mammalian embryos may also, however, be due to differences in the membrane components and particularly in the cholesterol content of the membranes. Carbocyanine dyes with alkyl chains containing 12 to 22 carbons have been shown to preferentially associate with saturated long-tailed phospholipids (Spink et al., 1990). Other workers (Kahya et al., 2005) have found that in synthethic giant unilamellar vesicles composed of dioleoyl-phosphatidylcholine and sphingomyelin, addition of cholesterol causes a phase separation and preferential partitioning of DiL-C18 in the dioleoylphosphatidylcholine-rich phase and preferential partitioning of CTβ/AF488 with GM1 and cholesterol in the sphingomyelin-rich phase in the same experiments. Our results therefore suggest that the sphingomyelin and cholesterol content of the cell membrane in mouse cleaving 2-cell embryos is high enough to exclude Vybrant DiO from the membrane and is consistent with the specific labeling of cholesterol- and sphingolipid-enriched lipid rafts by CTβ in the cell membrane in our experiments. We also labeled a non-raft-associated membrane component, actin, and compared its distribution with the distribution of CTβ in 2-cell mouse embryos. The expected cortical distribution of actin was clearly visible (Fig. 5 D), while CTβ labeling was displaced from the membrane by Triton X-100 used in the labeling protocol (Fig. 5 C).
As a comparative control marker for CTβ labeling in zygotes near the time of sperm entry, we used ConA/AF488 to label lectin receptors. Shortly after sperm entry, at 24 h post hCG, we observed that there were areas of the zygote membrane that stained more intensely with CTβ (Fig. 5 C, arrows), which may correspond with the areas of cortical granule fusion and increased filipin staining after fertilization described by Pratt (Pratt, 1985). This result also differed from the quite uniform labeling of rafts in zygotes noted at 30 h post hCG (Fig. 1 C and F). Our ConA/AF88 distribution results were consistent with earlier studies (Allworth and Ziomek, 1988) (Fig. 5 A–E). ConA/AF488 distribution, unlike CTβ labeling, was not disrupted by treatment with saponin which extracts membrane cholesterol (Fig. 5 F–J). Studies using MβCD in embryo culture experiments confirmed that in addition to the disruption of lipid raft labeling with CTβ noted after treatment with Triton X-100 and saponin, removal of cholesterol from the cell membrane of preimplantation embryos functionally inhibits development from zygote to blastocyst stage (Fig. 6–7).
We were interested in investigating the potential of Qdots as a tool in mammalian embryo fluorescence experiments, and here we tested a Qdot secondary reagent to detect CTβ raft labeling, the first report of the use of Qdots in mammalian embryos. Q-dots have tremendous potential applications in fluorescence studies using multiple sizes of Qdots to generate different colors, or using Qdots in combination with other available labeling techniques (Giepmans et al., 2006). Qdots are now available with a variety of polymer coatings that make them stable and soluble in aqueous buffers. Qdots conjugated with biomolecules are also commercially available. Qdots are larger than many flurophores in common use. Our results indicate that the relatively large size of Qdots does not appear to limit their potential use in preimplantation embryos in comparison to standard fluorescent reagents such as AF594. We observed the same staining patterns with both Qdots and AF594 for cell surface and for intracellular staining (Fig. 3).
There is accumulating evidence that lipid rafts have a biological function in reproduction. The presence of lipid rafts and the importance of cholesterol efflux during sperm capacitiation in preparation for fertilization have been reported for several mammalian species (Travis and Kopf, 2002). Xenopus laevis eggs have also been shown to contain lipid rafts associated with signaling molecules (Sato et al., 2002). Lipid rafts have been reported in sea urchin eggs, with a suggested possible physiological role in fertilization (Belton et al., 2001), and in cleaving sea urchin eggs with suggested roles in cytokinesis and cell signaling pathways (Ng et al., 2005). These data suggest, therefore, that in several species lipid rafts are important in gamete maturation, in fertilization and in early cleavage events.
Lipid rafts and their associated proteins have been implicated in many normal cellular functions including cell signal transduction in immunocytes (Dykstra et al., 2003) and transcytosis and apical sorting of proteins (Nyasae et al., 2003). They have been described as playing a “crucial role at the interface between signaling, membrane trafficking and cell polarization” (Rajendran and Simons, 2005). An accumulating body of biochemical evidence from a variety of experimental cell systems (Rajendran and Simons, 2005) and from model membrane and computational modeling work (Hancock, 2006) is being used to establish and refine a consensus model of lipid raft structure, content and function. Due to the limited amount of material available from mouse oocytes and embryos we have taken an imaging rather than a biochemical approach for the analysis of the possible presence and location of lipid rafts in oocytes and embryos.
Our results indicate that lipid rafts are strategically located in embryonic space and time in a manner suggestive of a functional role for rafts and their associated proteins in cytokinesis in early cleaving mammalian embryos. In morulae, apico-lateral enrichment of rafts may also indicate a role in the early stages of trophectoderm differentiation and in cavitation, both critical prerequisites for formation of the blastocyst (Watson, 1992; Sheth et al., 1997). Functional data from embryo culture experiments support the concept of a critical role for lipid rafts in development as removal of cholesterol from the cell membrane by MβCD slows the rate of cleavage in culture and ultimately inhibits progression to the blastocyst stage. Based on the timing of the raft distribution patterns reported in this study and on the functional inhibition results with MβCD, we hypothesize that lipid raft structures and their associated proteins are important in cytokinesis and in the development of the blastocyst during mammalian preimplantation embryo development. The long-range challenge will be to identify the proteins that are located in the embryonic lipid rafts and to understand their role in cytokinesis and cell signaling events in the context of their location in lipid rafts.
Acknowledgments
Supported by National Institutes of Health grants HD 39215 and HD 40309 and by the Gordon Center for Subsurface Sensing and Imaging Systems, under the Engineering Research Centers Program of the National Science Foundation (award number EEC-9986821).
Footnotes
Publisher's Disclaimer: This is a PDF file of an unedited manuscript that has been accepted for publication. As a service to our customers we are providing this early version of the manuscript. The manuscript will undergo copyediting, typesetting, and review of the resulting proof before it is published in its final citable form. Please note that during the production process errors may be discovered which could affect the content, and all legal disclaimers that apply to the journal pertain.
References
- Albertson R, et al. Membrane traffic: a driving force in cytokinesis. Trends Cell Biol. 2005;15:92–101. doi: 10.1016/j.tcb.2004.12.008. [DOI] [PubMed] [Google Scholar]
- Allworth A, Ziomek CA. Filipin-labelled complexes are polarized in their distribution in the cytoplasm of meiotically mature mouse eggs. Gamete Res. 1988;20:475–89. doi: 10.1002/mrd.1120200408. [DOI] [PubMed] [Google Scholar]
- Belton RJ, Jr, et al. Isolation and characterization of sea urchin egg lipid rafts and their possible function during fertilization. Mol Reprod Dev. 2001;59:294–305. doi: 10.1002/mrd.1034. [DOI] [PubMed] [Google Scholar]
- Bradford GE, Nott CF. Genetic control of ovulation rate and embryo survival in mice. II. Effects of crossing selected lines. Genetics. 1969;63:907–18. doi: 10.1093/genetics/63.4.907. [DOI] [PMC free article] [PubMed] [Google Scholar]
- Brown DA, London E. Functions of lipid rafts in biological membranes. Annu Rev Cell Dev Biol. 1998;14:111–36. doi: 10.1146/annurev.cellbio.14.1.111. [DOI] [PubMed] [Google Scholar]
- Dykstra M, et al. LOCATION IS EVERYTHING: Lipid Rafts and Immune Cell Signaling. Annu Rev Immunol. 2003;21:457–81. doi: 10.1146/annurev.immunol.21.120601.141021. [DOI] [PubMed] [Google Scholar]
- Emoto K, et al. Local change in phospholipid composition at the cleavage furrow is essential for completion of cytokinesis. J Biol Chem. 2005;280:37901–7. doi: 10.1074/jbc.M504282200. [DOI] [PubMed] [Google Scholar]
- Emoto K, Umeda M. An essential role for a membrane lipid in cytokinesis. Regulation of contractile ring disassembly by redistribution of phosphatidylethanolamine. J Cell Biol. 2000;149:1215–24. doi: 10.1083/jcb.149.6.1215. [DOI] [PMC free article] [PubMed] [Google Scholar]
- Gallicano GI. Composition, regulation, and function of the cytoskeleton in mammalian eggs and embryos. Front Biosci. 2001;6:D1089–108. doi: 10.2741/gallican. [DOI] [PubMed] [Google Scholar]
- Giepmans BN, et al. The fluorescent toolbox for assessing protein location and function. Science. 2006;312:217–24. doi: 10.1126/science.1124618. [DOI] [PubMed] [Google Scholar]
- Glotzer M. Animal cell cytokinesis. Annu Rev Cell Dev Biol. 2001;17:351–86. doi: 10.1146/annurev.cellbio.17.1.351. [DOI] [PubMed] [Google Scholar]
- Glotzer M. The molecular requirements for cytokinesis. Science. 2005;307:1735–9. doi: 10.1126/science.1096896. [DOI] [PubMed] [Google Scholar]
- Goldbard SB, et al. Genetic analysis of H-2 linked gene(s) affecting early mouse embryo development. J Immunogenet. 1982;9:77–82. doi: 10.1111/j.1744-313x.1982.tb00966.x. [DOI] [PubMed] [Google Scholar]
- Hancock JF. Lipid rafts: contentious only from simplistic standpoints. Nat Rev Mol Cell Biol. 2006;7:456–62. doi: 10.1038/nrm1925. [DOI] [PMC free article] [PubMed] [Google Scholar]
- Ilangumaran S, Hoessli DC. Effects of cholesterol depletion by cyclodextrin on the sphingolipid microdomains of the plasma membrane. Biochem J. 1998;335(Pt 2):433–40. doi: 10.1042/bj3350433. [DOI] [PMC free article] [PubMed] [Google Scholar]
- Kahya N, et al. Raft partitioning and dynamic behavior of human placental alkaline phosphatase in giant unilamellar vesicles. Biochemistry. 2005;44:7479–89. doi: 10.1021/bi047429d. [DOI] [PubMed] [Google Scholar]
- Lagerholm BC, et al. Detecting microdomains in intact cell membranes. Annu Rev Phys Chem. 2005;56:309–36. doi: 10.1146/annurev.physchem.56.092503.141211. [DOI] [PubMed] [Google Scholar]
- Lin A, et al. Imaging cytoskeleton--mitochondrial membrane attachments by embedment-free electron microscopy of saponin-extracted cells. Proc Natl Acad Sci U S A. 1990;87:8565–9. doi: 10.1073/pnas.87.21.8565. [DOI] [PMC free article] [PubMed] [Google Scholar]
- Maro B, et al. Changes in actin distribution during fertilization of the mouse egg. J Embryol Exp Morphol. 1984;81:211–37. [PubMed] [Google Scholar]
- Matheson J, et al. Membrane traffic in cytokinesis. Biochem Soc Trans. 2005;33:1290–4. doi: 10.1042/BST0331290. [DOI] [PubMed] [Google Scholar]
- Medintz IL, et al. Quantum dot bioconjugates for imaging, labelling and sensing. Nat Mater. 2005;4:435–46. doi: 10.1038/nmat1390. [DOI] [PubMed] [Google Scholar]
- Nagy A, et al. Manipulating the Mouse Embryo. Cold Spring Harbor Laboratory Press; Cold Spring Harbor: 2003. Recovery and In Vitro Culture of Preimplantation-stage embryos; pp. 166–171. [Google Scholar]
- Ng MM, et al. Movement of membrane domains and requirement of membrane signaling molecules for cytokinesis. Dev Cell. 2005;9:781–90. doi: 10.1016/j.devcel.2005.11.002. [DOI] [PubMed] [Google Scholar]
- Nyasae LK, et al. Transcytotic efflux from early endosomes is dependent on cholesterol and glycosphingolipids in polarized hepatic cells. Mol Biol Cell. 2003;14:2689–705. doi: 10.1091/mbc.E02-12-0816. [DOI] [PMC free article] [PubMed] [Google Scholar]
- Pike LJ. Lipid rafts: heterogeneity on the high seas. Biochem J. 2004;378:281–92. doi: 10.1042/BJ20031672. [DOI] [PMC free article] [PubMed] [Google Scholar]
- Pratt HP. Membrane organization in the preimplantation mouse embryo. J Embryol Exp Morphol. 1985;90:101–21. [PubMed] [Google Scholar]
- Rajendran L, Simons K. Lipid rafts and membrane dynamics. J Cell Sci. 2005;118:1099–102. doi: 10.1242/jcs.01681. [DOI] [PubMed] [Google Scholar]
- Rieger S, et al. Quantum dots are powerful multipurpose vital labeling agents in zebrafish embryos. Dev Dyn. 2005;234:670–81. doi: 10.1002/dvdy.20524. [DOI] [PubMed] [Google Scholar]
- Sato K, et al. Low density detergent-insoluble membrane of Xenopus eggs: subcellular microdomain for tyrosine kinase signaling in fertilization. Development. 2002;129:885–96. doi: 10.1242/dev.129.4.885. [DOI] [PubMed] [Google Scholar]
- Sheth B, et al. Tight junction assembly during mouse blastocyst formation is regulated by late expression of ZO-1 alpha+ isoform. Development. 1997;124:2027–37. doi: 10.1242/dev.124.10.2027. [DOI] [PubMed] [Google Scholar]
- Simons K, Toomre D. Lipid rafts and signal transduction. Nat Rev Mol Cell Biol. 2000;1:31–9. doi: 10.1038/35036052. [DOI] [PubMed] [Google Scholar]
- Skop AR, et al. Dissection of the mammalian midbody proteome reveals conserved cytokinesis mechanisms. Science. 2004;305:61–6. doi: 10.1126/science.1097931. [DOI] [PMC free article] [PubMed] [Google Scholar]
- Spink CH, et al. Partitioning behavior of indocarbocyanine probes between coexisting gel and fluid phases in model membranes. Biochim Biophys Acta. 1990;1023:25–33. doi: 10.1016/0005-2736(90)90005-9. [DOI] [PubMed] [Google Scholar]
- Takeda T, et al. Organization of a sterol-rich membrane domain by cdc15p during cytokinesis in fission yeast. Nat Cell Biol. 2004;6:1142–4. doi: 10.1038/ncb1189. [DOI] [PubMed] [Google Scholar]
- Tarkowski AK. An air-drying method for chromosome preparations from mouse eggs. Cytogenetics. 1966;5:394–400. [Google Scholar]
- Travis AJ, Kopf GS. The role of cholesterol efflux in regulating the fertilization potential of mammalian spermatozoa. J Clin Invest. 2002;110:731–6. doi: 10.1172/JCI16392. [DOI] [PMC free article] [PubMed] [Google Scholar]
- Wachtler V, et al. Sterol-rich plasma membrane domains in the fission yeast Schizosaccharomyces pombe. J Cell Sci. 2003;116:867–74. doi: 10.1242/jcs.00299. [DOI] [PubMed] [Google Scholar]
- Warner CM, et al. Genetics and imaging to assess oocyte and preimplantation embryo health. Reprod Fertil Dev. 2004;16:729–41. doi: 10.1071/rd04088. [DOI] [PubMed] [Google Scholar]
- Watson AJ. The cell biology of blastocyst development. Mol Reprod Dev. 1992;33:492–504. doi: 10.1002/mrd.1080330417. [DOI] [PubMed] [Google Scholar]