

Abstract
Objective
Our objective was to examine serum leptin prospectively as a predictor of weight and body fat growth in children at high risk for adult obesity. We hypothesized that leptin measurements would be positively associated with increased growth of adipose tissue because children with high baseline leptin for their body fat mass have greater leptin resistance and thus would have greater susceptibility to weight gain.
Methods
Children ages 6–12 yr at high risk for adult obesity because of early-onset childhood overweight and/or parental overweight were recruited from 1996–2004. Growth in body mass index (BMI) was studied in 197 children, and growth in total body fat mass was examined in 149 children over an average follow-up interval of 4.4 yr (range, 1–8 yr). Longitudinal analyses accounted for sex, race, socioeconomic status, initial body composition, age, skeletal age, and physical activity and included all available interim visits for each individual so that a total of 982 subject visits were included in the analysis.
Results
At baseline, 43% of children studied were overweight (BMI ≥ 95th percentile); during follow-up, an additional 14% became overweight. Independent of initial body composition, baseline leptin was a statistically significant positive predictor of increased BMI (P = 0.0147) and increased total body fat mass (P < 0.007).
Conclusions
High serum leptin, independent of body fat, may be an indicator of increased leptin resistance, which predisposes children at high risk for adult obesity to somewhat greater growth in weight and body fat during childhood.
The adipocyte-derived hormone leptin is an important regulator of food intake and energy expenditure (1). Soon after its discovery in 1994, leptin was shown to be positively related to fat mass. It was theorized that the presence of chronically high leptin concentrations in overweight individuals was a result of resistance to the effects of leptin in these individuals (2), even though relatively few were found to have function-altering genetic defects of the leptin receptor itself (3).
The cross-sectional, positive relationship between body adiposity and serum leptin is well documented in both children and adults (2, 4). However, the influence of leptin on changes in weight over time is far less clear. In adults, both low (5) and high (6–9) circulating leptin (adjusted for body size at baseline) have been reported to predict increased weight longitudinally; other studies have found no evidence of leptin predicting weight gain (10–14). Similarly, in children, both low (15, 16) and high baseline leptin (17–19) have been suggested to predict greater weight gain over time. However, previous pediatric studies have used relatively small cohorts and are somewhat difficult to evaluate and compare for several reasons. First, the studies used different outcome measures including body mass index (BMI), BMI Z-score, BMI percentile, total body fat mass, and percent total body fat. For studies in which fat mass was an outcome measure, two measured it using dual-energy x-ray absorptiometry (17, 18), one by skinfold thickness (15), one by bioelectrical impedance (16), and one by 18O dilution (18). Second, the studies each accounted for a different combination of potentially confounding variables. Third, these studies used a variety of statistical evaluations, with only one study (17) including interim follow-up visits in the analysis to model the pattern of adipose growth. Finally, only two studies (14, 15) have examined children at high risk for adult obesity, despite the fact that this represents a group in which better predictors of excessive fat gain are needed to assist clinicians in determining which children should be especially targeted for early intensive interventions. These fragmented and limited previous observations suggested the need to study a larger cohort of children with a long follow-up interval and inclusion of a greater number of potentially confounding variables as well as interim visits into a model of longitudinal weight change.
Based on the limitations of previous studies and the importance of evaluating a high-risk population, we conducted a prospective study of children at high risk for development of adult obesity to determine the influence of serum leptin as a predictor of growth in BMI and adiposity during childhood. We hypothesized that there would be a positive association between baseline serum leptin and increased fat mass over time in children at high risk for adult obesity because many such children would manifest leptin resistance out of proportion to their fat mass. We expected that children with the most severe leptin resistance would be relatively insensitive to leptin’s weight-regulating effects throughout childhood and would therefore have increased BMI and fat mass over time compared with children with leptin concentrations more commensurate with their fat mass.
Subjects and Methods
Subjects
Children aged 6–12 yr old were recruited by mailings sent to Washington, D.C., metropolitan area schools, by advertisements in local newspapers, and from referral by local physicians for participation in non-intervention studies of healthy volunteers (20) between 1996 and 2004. Recruitment efforts specifically targeted children who were at risk for adult obesity by virtue of their own overweight (BMI for age and sex ≥ 95th percentile for National Health and Nutrition Examination Survey standards) (21) or because of their parents’ overweight (at least one parent with BMI ≥ 25 kg/m2). To be recruited for the study, subjects were required to be medication-free for at least 2 wk before evaluation and to be in good general health. Exclusion criteria included current involvement in a weight-loss program and significant renal, hepatic, endocrinological, pulmonary (with the exception of asthma), and psychiatric disorders (with the exclusion of binge eating disorder) as determined by history and physical examination. These studies were carried out in accordance with the Declaration of Helsinki and were approved by the National Institute of Child Health and Human Development (NICHD) Institutional Review Board, which serves as the ethics committee for pediatric studies conducted by NICHD investigators. Each participant gave written assent, and each parent gave written consent for participation.
Procedures
Participants each underwent a structured history and physical examination including weight and height measurements at baseline and annually thereafter. Weight was obtained to the nearest 0.1 kg using a calibrated digital scale (Scale-Tronix, Wheaton, IL), and the average of three heights was obtained to the nearest 1 mm using a stadiometer calibrated before each set of measurements (Holtain Ltd., Crymych, UK). For height and weight determination, children were clothed with shoes removed, and measurements were obtained in the morning after a 12-h fast. Parental overweight was determined by measurement in the clinic for at least one parent and by parental report of weight and height for parents who did not attend the visit. Approximately three fourths of all children also underwent dual-energy x-ray absorptiometry (DEXA) scans for total body fat mass determination at baseline and annually or semiannually thereafter (QDR 2000 pencil beam or 4500A fan beam densitometer; Hologic, Waltham, MA). The pencil beam mode and the fan beam mode instruments are both highly correlated with fat mass (22–24); however, compared with the pencil beam mode, the fan beam mode underestimates body fat mass in overweight children by approximately 2.47 kg (25). Therefore, in this study, 2.47 kg was added to all total body fat mass measurements determined by the fan beam mode. At baseline, roentgenograms of the left wrist were also obtained and skeletal age was evaluated by the method of Greulich and Pyle (26). Skeletal maturation has been shown to be a good proxy for pubertal maturation even in those with an abnormal tempo of growth (27). DEXA and skeletal age measurements were performed by members of the radiology staff who did not have access to information other than basic demographics of the subject. One radiologist determined all bone age readings. Socioeconomic status (SES) at baseline was determined by Hollingshead’s two-factor index of social status (28).
At baseline, subjects also completed physical activity questionnaires to document their volitional physical activity during the past year. This questionnaire was developed for the Massachusetts Institute of Technology Growth and Development Study to assess physical activity level (29–31). Questionnaires listed 33 common activities including sports such as baseball, basketball, gymnastics, and swimming as well as more childhood-specific activities such as climbing ropes/monkey bars and playing on a playground. Metabolic equivalent (MET) values were assigned to the activities based on Ainsworth’s updated compendium (32). For cases in which the description of the activity in the questionnaire did not specifically match the description of an activity listed in the updated compendium, a consensus among the researchers determined the most closely matched activity for MET value determination, with the majority view accepted. On the questionnaire, subjects were instructed to mark the number of seasons per year, days per week, and minutes per day during which they participated in a given activity so that MET hours per week could be estimated.
Serum samples for determination of leptin were obtained between 0800 and 1000 h after an overnight fast. A fasted state was encouraged to be reported truthfully by providing compensation for the visit regardless of whether the subject reported having fasted. Leptin was measured by commercially available assays [Linco Diagnostics, St. Charles, MO (n = 187), or Mayo Medical Laboratories New England, Wilmington, MA (n = 10)] that were found not to differ significantly in the relationship between measured value and body fat mass (data not shown). The functional sensitivity for the leptin assay was 0.4–0.5 ng/ml; intraassay and interassay variabilities were less than 8% and less than 18%, respectively.
Statistical analysis
Longitudinal analyses assessed the function of baseline leptin concentration to predict BMI and total body fat mass over time. BMI, rather than BMI SD score, was modeled as the primary outcome measure based on the data of Cole et al. (33) showing that when children are followed longitudinally, BMI is a superior measure to assess changes in adiposity. A secondary analysis modeled BMI SD score calculated according to the Centers for Disease Control LMS method (34). Correlation between measures taken on the same individual at different times was modeled using a spatial model with exponentially decreasing correlation as the time interval increases. The analyses accounted for sex, race, socioeconomic status, age, skeletal age, and physical activity level and included all available interim visits for each individual. Baseline BMI and total fat mass were included as independent variables in their respective analyses. Leptin concentration, BMI, and fat mass showed positively skewed distributions and were therefore log-transformed for all analyses. To model leptin and total body fat, we created a repeated-measures model (35) using SAS PROC MIXED. Initially, all variables (including powers of age up to fourth order) and their interactions with age were included in the model. Terms were removed sequentially according to highest P value until only terms with P < 0.05 remained. Main effects for categorical factors were retained until all interactions with the factor were removed.
Results
A total of 283 children completed an initial visit for determination of BMI. During that visit, 263 had a baseline leptin value, and of those with a baseline leptin value, 218 had a baseline fat mass measurement. At their baseline visit, fasting leptin was significantly related to both BMI (Fig. 1A) and fat mass (Fig. 1B). However, there was considerable variability in these relationships, such that some children had much higher leptin concentrations than predicted by the line of association.
Fig. 1.
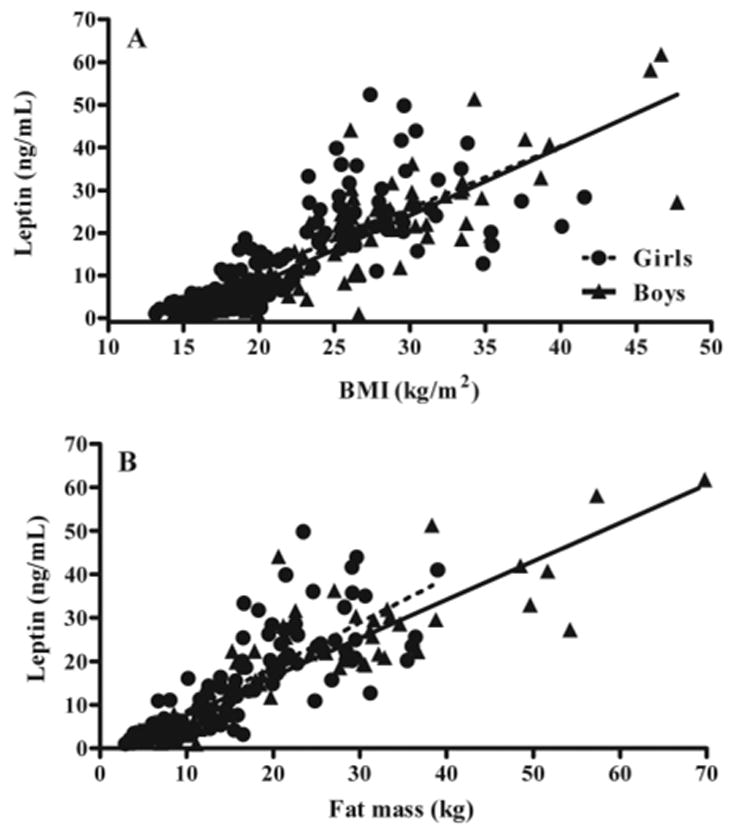
Fasting leptin as a function of BMI (A) and fat mass (B) in girls and boys. Leptin was positively associated with BMI (P < 0.0001; r2 = 0.70) and fat mass (P < 0.0001; r2 = 0.70). Leptin levels tended to be higher in girls than in boys, although this relationship did not reach significance based on the 95% confidence interval of the intercept for BMI (1.56–1.91 for girls and 1.24–1.85 for boys) or for fat mass (0.78–1.29 for girls and 0.88–1.09 for boys).
Of 263 children with baseline leptin and BMI measurements, 197 returned for at least one follow-up visit and thus met the inclusion criteria for BMI analysis; of 218 children with baseline leptin and fat mass measurements, 149 children had follow-up data available for fat mass analysis (Table 1). Children not included in the follow-up analysis were not significantly different from those included with regard to follow-up age, SES, BMI Z-score, sex, or race distribution (all P > 0.10, data not shown).
TABLE 1.
Subject characteristics at baseline
| BMI follow-up cohort (n = 197) | Body fat mass follow-up cohort (n = 149) | |
|---|---|---|
| Sex, n (%) | ||
| Female | 99 (50) | 76 (51) |
| Male | 98 (50) | 73 (49) |
| Race, n (%) | ||
| Caucasian | 120 (61) | 92 (62) |
| African-American | 70 (36) | 50 (34) |
| Other | 7 (4) | 7 (5) |
| Age (yr) | 9.0 ± 1.7 | 9.0 ± 1.5 |
| Skeletal age (yr) | 9.8 ± 2.1 | 9.9 ± 1.9 |
| SES (median) | 3.0 | 3.0 |
| BMI (kg/m2) | 22.3 ± 6.5 | 22.2 ± 6.4 |
| BMI Z-score | 1.3 ± 1.1 | 1.3 ± 1.1 |
| Weight status by percentile, n (%) | ||
| Non-overweight (<85th percentile) | 79 (40) | 60 (40) |
| At risk for overweight (85–95th percentile) | 33 (16) | 23 (15) |
| Overweight (≥95th percentile) | 85 (43) | 66 (44) |
| Total body fat mass (kg) | 15.9 ± 11.2a | 15.9 ± 11.2 |
| Physical activity (MET h/wk) | 70.7 ± 46.1 | 69.2 ± 43.1 |
| Girls’ Tanner stage, n (%) | ||
| Tanner I | 120 (61) | 92 (62) |
| Tanner II or III | 71 (36) | 22 (15) |
| Tanner IV or V | 6 (3) | 2 (1) |
| Boys’ testicular size (ml) | 2.6 ± 1.9 | 2.6 ± 2.0 |
Results are mean ± SD unless otherwise indicated.
n = 149.
Longitudinally, a total of 982 subject visits were included in the final analysis. Follow-up interval ranged from 0.6–8.7 yr (mean, 4.4; SE, 1.5 yr), with 58% of all subjects having at least 4 yr of follow-up and 13% having less than 2 yr of follow-up. Study children gained, on average, 5.0 pounds of fat mass and 15.0 pounds of body weight per year. Among the 102 children who were not overweight at study entry (i.e. children who had BMI less than the 95th percentile for age and sex), 24% (14% of all subjects) became overweight during follow-up.
For the longitudinal analysis modeling baseline serum leptin as a predictor of change in BMI (Table 2), baseline leptin (P = 0.0147) significantly predicted increased BMI over time in both girls (Fig. 2A) and boys (Fig. 2B). This result was found after taking into account correlations between annual BMI measurements and baseline BMI (P < 0.0001), baseline age (P < 0.0001), follow-up age (P < 0.0001), sex by follow-up age (P < 0.0001), and baseline leptin by follow-up age (P = 0.0022). After accounting for these factors, race, SES, and reported physical activity did not significantly impact growth in BMI nor were their interactions with other variables significant; therefore, they were not included in the final model. Compared with those with baseline leptin measurements in the lowest tertile, children with baseline leptin in the highest tertile were estimated by the model to have gained an additional 1.2 kg/m2 between age 8 and 18 yr (Fig. 2). When this analysis was used to model change in BMI Z-score over time, baseline leptin remained a significant predictor (P = 0.0005) of increased BMI Z-score over time, as did baseline BMI Z-score, baseline age, follow-up age, and baseline leptin by follow-up age. Sex no longer impacted the model, because it was incorporated into the baseline BMI Z-score measurement.
TABLE 2.
Mixed regression models for predicting increase in natural log of BMI and increase in natural log of body fat mass
| Effect | Estimate | SE | P value |
|---|---|---|---|
| Model predicting increase in natural log of BMI | |||
| Intercept | −0.1672 | 0.1419 | 0.2401 |
| Follow-up age to the third order | −6.67e−5 | 1.43e−5 | <0.0001 |
| Sex (0 girls, 1 boy) | −0.05628 | 0.04751 | 0.2376 |
| Baseline age | −0.05776 | 0.00443 | <0.0001 |
| Baseline BMI (log) | 0.9806 | 0.04878 | <0.0001 |
| Baseline leptin (log) | 0.06673 | 0.02711 | 0.0147 |
| Follow-up age × sex (girls) | 0.0921 | 0.007663 | <0.0001 |
| Follow-up age × sex (boys) | 0.08541 | 0.007277 | <0.0001 |
| Baseline leptin (log) × follow-up age | −0.00599 | 0.001948 | 0.0022 |
| Model predicting increase in natural log of body fat mass | |||
| Intercept | −0.913 | 1.1232 | 0.4176 |
| Follow-up age to the third order | −0.00174 | 4.83e−4 | 0.0004 |
| Follow-up age to the fourth order | 5.3e−5 | 1.8e−5 | 0.0039 |
| Sex (0 girls, 1 boy) | −0.3271 | 0.1492 | 0.03 |
| Race (0 Caucasian, 1 other ethnicity) | 0.4818 | 0.1522 | 0.0019 |
| Baseline age | −0.1561 | 0.01557 | <0.0001 |
| Baseline total fat (log) | 0.8561 | 0.1253 | <0.0001 |
| Baseline leptin (log) | 0.1423 | 0.04099 | 0.0007 |
| Baseline fat mass (log) × follow-up age | −0.0257 | 0.009007 | 0.0046 |
| Follow-up age × sex (girls) × race (Caucasian) | 0.7164 | 0.1092 | <0.0001 |
| Follow-up age × sex (girls) × race (other ethnicity) | 0.7598 | 0.1087 | <0.0001 |
| Follow-up age × sex (boys) × race (Caucasian) | 0.6928 | 0.107 | <0.0001 |
| Follow-up age × sex (boys) × race (other ethnicity) | 0.7264 | 0.1061 | <0.0001 |
Fig. 2.
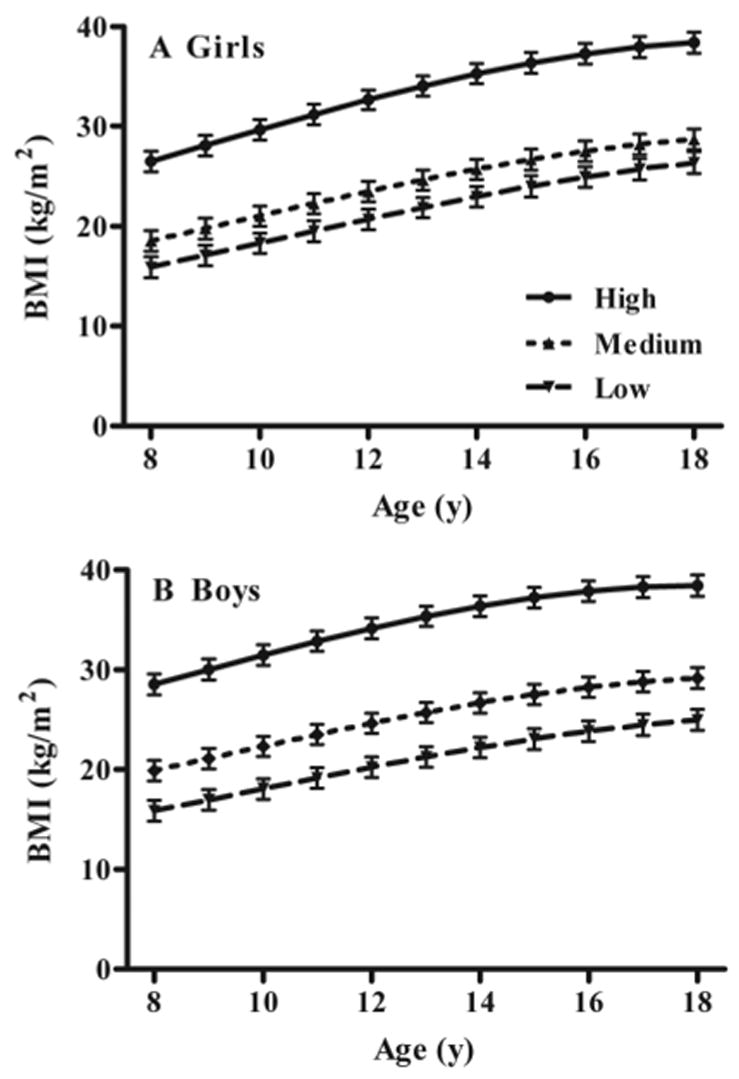
Associations between low, medium, and high baseline fasting leptin and gain in BMI in girls (A) and boys (B). Children with high baseline leptin gained significantly more BMI over time, independent of baseline BMI and other covariates (see Subjects and Methods).
For the longitudinal analysis modeling baseline serum leptin as a predictor of change in total body fat mass (Table 2), baseline leptin (P < 0.0007) significantly predicted increased total fat mass over time in girls (Fig. 3, A and B) and boys (Fig. 3, C and D). This result was found after taking into account correlations between annual total fat mass measurements and baseline total fat mass (P < 0.0001), baseline age (P < 0.0001), follow-up age (P < 0.0001), race (P = 0.0019), sex (P = 0.03), baseline fat mass by follow-up age (P = 0.0046), and sex by race by follow-up age (P < 0.0001). Reported physical activity and SES were not significant predictors of growth in fat mass, nor did they interact with any of the other variables, and therefore were not included in the final model. Compared with those with baseline leptin measurements in the lowest tertile, girls with baseline leptin in the highest tertile were estimated by the model to have gained an average of 11.8 kg additional fat mass between age 8 and 18 yr, whereas boys were estimated by the model to have gained an average of 5.2 kg additional fat mass (P = 0.03; Fig. 3). Leptin, however, appeared to have had somewhat less influence in nonwhite participants, particularly among boys (Fig. 3D).
Fig. 3.
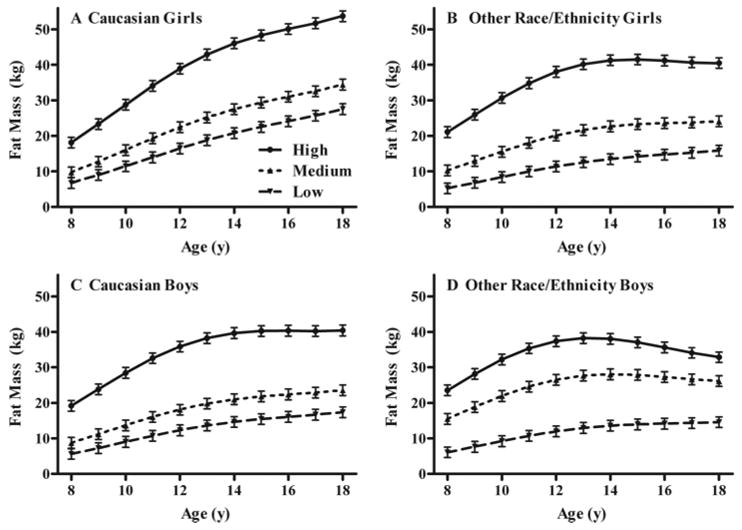
Associations between low, medium, and high baseline fasting leptin and gain in body fat mass in white girls (A), girls of other race/ethnicity (B), white boys (C), and boys of other race/ethnicity (D). For all four groups, those with high baseline leptin gained significantly more fat mass over time, independent of baseline fat mass and other covariates (see Subjects and Methods).
Discussion
We found that for children at high risk for adult obesity, high BMI and fat mass were associated with greater gain in body mass, but high baseline serum leptin concentration, independent of baseline BMI/fat mass, also predicted greater BMI and fat mass over time. We hypothesize that children who had high leptin at baseline were at increased risk for gain in fat mass due to inherent leptin resistance above that expected to be generated by their body fat mass. Although unlikely to be due to function-altering defects of the leptin receptor itself (3), this inherent leptin resistance could conceivably reflect deleterious alterations downstream of the leptin receptor that could promote excessive weight gain.
This study confirms and extends previous observations of obese children (n = 68) (19), obese Pima Indian children (n = 132) (18), and African-American and Caucasian children of typical weight distribution (n = 85) (17) that have found higher leptin to predict increased weight over time and contrasts with other smaller investigations (n < 40) that found the reverse relationship (15, 16). In addition to its larger sample size, the present investigation was strengthened compared with previous studies by separate modeling according to gender and race, a statistical analysis that incorporated multiple potentially confounding variables, and fat mass measured by DEXA as an outcome variable. Particularly during childhood and adolescence when muscle, organ, and bone mass may be changing at varying rates, body fat mass is a more accurate measure of adiposity than BMI (36, 37). The only other pediatric leptin study that measured fat mass by DEXA (17) also found a positive relationship between leptin and adiposity growth over time.
In contrast to two other pediatric studies (15, 17) that found leptin to predict weight gain only in females, we found that high serum leptin predicted increased weight in both males and females. These previous studies used total sample sizes that may have been too small (n = 40 and n = 68) to permit reliable subdivision by sex, although somewhat smaller effects of high leptin in males (+5.2 kg additional fat mass) than in females (+11.8 kg additional fat mass) were estimated by the model in the current study. It also appeared that there was a diminished impact of baseline serum leptin to predict adiposity growth during puberty particularly among the non-Caucasian boys in the study (Fig. 3). However, additional research is necessary to confirm this relationship, as the interaction term for leptin by race by follow-up age did not reach significance in the model (Table 2). Our models also suggest a decreased velocity of growth in fat mass in late puberty, particularly in boys (Fig. 3), which is consistent with increased deposition of muscle mass during this time period and is in concordance with the existing literature (38). As has also been found previously (39), this postpubertal decline in fat mass growth appears to be less pronounced in Caucasian girls. However, from these models, which were formulated to test the role of leptin on weight change, firm conclusions cannot be drawn about the influence of sex and ethnicity on overall fat mass trajectory.
Skeletal age, physical activity, and SES did not independently predict increases in BMI or fat mass in these models. The physical activity measures obtained via questionnaire relied on subjects’ responses, which may not have accurately represented their physical activity (40) and might thus have affected the questionnaire’s ability to predict growth of BMI or fat mass. However, several other previous studies have likewise found physical activity, assessed either by questionnaire (41) or estimated using stable isotope methods (30, 41–44), not to predict weight change during adolescence. Measures of fitness, rather than of actual physical activity may ultimately be seen as superior for the purpose of assessing how activity impacts weight change (44). Larger sample sizes or approaches that can reliably estimate activity over very long periods of time may be needed before activity measurements can be shown to contribute to weight change in children. Similarly, a considerably larger sample size may be needed to separate the effects of age from those of skeletal age. In addition to the need for a larger sample size and better methods to estimate physical activity to answer some research questions, there are other limitations of the study. These include the recruitment only of subjects living near Washington, D.C., and the fact that, in some instances, more than one child in a single family was enrolled in the study and that virtually all children had at least one overweight parent. Finally, because of limitations related to sample size, analyses of the associations between leptin and weight gain could not be performed separately for the non-overweight and overweight children in the study.
The ability of serum leptin to predict increases in body fat mass in children at high risk for adult obesity contrasts with studies in adults in which leptin was not a good predictor of future weight change (10–14). In children, inherent leptin resistance may be a more salient indicator of risk for greater adipose growth than it is in adults, who have had a larger period of exposure to environmental conditions that predispose to weight gain and have had an opportunity to manifest the effects of genes affecting body weight that may have a later onset of action. This study thus also demonstrates that caution must be exercised when extrapolating data from adults to children or from normal-weight children to children at high risk for obesity, highlighting the potential differences in the control mechanisms for energy intake and expenditure that may be present in those with early-onset overweight.
There is a need for additional prospective, longitudinal studies to explore the role of leptin to predict weight gain in children who are not already identified as at risk for overweight by their own or their parents’ weight status. If leptin concentration in these non-overweight children is associated with the development of overweight, it could be used as a biomarker to identify at-risk children. Furthermore, additional studies are warranted to evaluate the predictive role of leptin compared with other known predictors of weight gain such as birth weight, maternal smoking during pregnancy, history of breastfeeding, time spent watching television, parental obesity (45, 46), and insulin concentration (47–50). Indeed, there is an established relationship between hyperleptinemia and hyperinsulinemia (51, 52). A few (53–57), but not all (58, 59), longitudinal studies in adults have actually suggested that high insulin sensitivity and low fasting plasma insulin are associated with increased weight gain, whereas insulin resistance may protect against weight gain. Conflicting data also exist for children, with both positive (47, 50) and negative (48, 49) associations reported between insulin and changes in fat mass. Thus, there is a clear need for future studies to elucidate the relationship between insulin and leptin as predictors of changes in weight over time. Future studies should also examine the role of insulin and how it relates to leptin as a predictor of increases in weight and body fat mass in both overweight and non-overweight children.
The present study may be of particular clinical interest because it is specifically applicable to elementary school-aged children believed to be at risk for adult obesity. As children pass through adolescence to adulthood and height stabilizes, weight status becomes even more tightly correlated to the comorbidities associated with obesity. Where previous research has been limited and contradictory, this study more definitively documents the importance of serum leptin as a marker that predicts future weight in children already identified as at risk for adult obesity and may assist in selecting the subset of those who are most in need of weight monitoring and early, intensive intervention.
Acknowledgments
This work was supported by the Intramural Research Program of the National Institutes of Health (NIH), Grant ZO1-HD-00641 (NICHD, NIH; to J.A.Y.). A.F.F. was supported by the NIH Clinical Research Training Program, a public-private partnership funded jointly by the NIH, and a grant to the Foundation for the NIH from Pfizer Pharmaceuticals Group.
J.A.Y. and J.C.H. are Commissioned Officers in the U.S. Public Health Service, Department of Health and Human Services.
Disclosure Statement: The authors have nothing to disclose.
Abbreviations
- BMI
Body mass index
- DEXA
dual-energy x-ray absorptiometry
- MET
metabolic equivalent
- SES
socioeconomic status
References
- 1.Zhang Y, Proenca R, Maffei M, Barone M, Leopold L, Friedman JM. Positional cloning of the mouse obese gene and its human homologue. Nature. 1994;372:425–432. doi: 10.1038/372425a0. [DOI] [PubMed] [Google Scholar]
- 2.Considine RV, Sinha MK, Heiman ML, Kriauciunas A, Stephens TW, Nyce MR, Ohannesian JP, Marco CC, McKee LJ, Bauer TL, Caro JF. Serum immunoreactive-leptin concentrations in normal-weight and obese humans. N Engl J Med. 1996;334:292–295. doi: 10.1056/NEJM199602013340503. [DOI] [PubMed] [Google Scholar]
- 3.Echwald SM, Sorensen TD, Sorensen TI, Tybjaerg-Hansen A, Andersen T, Chung WK, Leibel RL, Pedersen O. Amino acid variants in the human leptin receptor: lack of association to juvenile onset obesity. Biochem Biophys Res Commun. 1997;233:248–252. doi: 10.1006/bbrc.1997.6430. [DOI] [PubMed] [Google Scholar]
- 4.Garcia-Mayor RV, Andrade MA, Rios M, Lage M, Dieguez C, Casanueva FF. Serum leptin levels in normal children: relationship to age, gender, body mass index, pituitary-gonadal hormones, and pubertal stage. J Clin Endocrinol Metab. 1997;82:2849–2855. doi: 10.1210/jcem.82.9.4235. [DOI] [PubMed] [Google Scholar]
- 5.Ravussin E, Pratley RE, Maffei M, Wang H, Friedman JM, Bennett PH, Bogardus C. Relatively low plasma leptin concentrations precede weight gain in Pima Indians. Nat Med. 1997;3:238–240. doi: 10.1038/nm0297-238. [DOI] [PubMed] [Google Scholar]
- 6.Chessler SD, Fujimoto WY, Shofer JB, Boyko EJ, Weigle DS. Increased plasma leptin levels are associated with fat accumulation in Japanese Americans. Diabetes. 1998;47:239–243. doi: 10.2337/diab.47.2.239. [DOI] [PubMed] [Google Scholar]
- 7.Lissner L, Karlsson C, Lindroos AK, Sjostrom L, Carlsson B, Carlsson L, Bengtsson C. Birth weight, adulthood BMI, and subsequent weight gain in relation to leptin levels in Swedish women. Obes Res. 1999;7:150–154. doi: 10.1002/j.1550-8528.1999.tb00696.x. [DOI] [PubMed] [Google Scholar]
- 8.Chu NF, Spiegelman D, Yu J, Rifai N, Hotamisligil GS, Rimm EB. Plasma leptin concentrations and four-year weight gain among US men. Int J Obes Relat Metab Disord. 2001;25:346–353. doi: 10.1038/sj.ijo.0801549. [DOI] [PubMed] [Google Scholar]
- 9.van Rossum CT, Hoebee B, van Baak MA, Mars M, Saris WH, Seidell JC. Genetic variation in the leptin receptor gene, leptin, and weight gain in young Dutch adults. Obes Res. 2003;11:377–386. doi: 10.1038/oby.2003.51. [DOI] [PubMed] [Google Scholar]
- 10.Folsom AR, Jensen MD, Jacobs DR, Jr, Hilner JE, Tsai AW, Schreiner PJ. Serum leptin and weight gain over 8 years in African American and Caucasian young adults. Obes Res. 1999;7:1–8. doi: 10.1002/j.1550-8528.1999.tb00384.x. [DOI] [PubMed] [Google Scholar]
- 11.Haffner SM, Mykkanen LA, Gonzalez CC, Stern MP. Leptin concentrations do not predict weight gain: the Mexico City Diabetes Study. Int J Obes Relat Metab Disord. 1998;22:695–699. doi: 10.1038/sj.ijo.0800619. [DOI] [PubMed] [Google Scholar]
- 12.Hodge AM, de Courten MP, Dowse GK, Zimmet PZ, Collier GR, Gareeboo H, Chitson P, Fareed D, Hemraj F, Alberti KG, Tuomilehto J. Do leptin levels predict weight gain? A 5-year follow-up study in Mauritius. Mauritius Non-communicable Disease Study Group. Obes Res. 1998;6:319–325. doi: 10.1002/j.1550-8528.1998.tb00358.x. [DOI] [PubMed] [Google Scholar]
- 13.Langenberg C, Bergstrom J, Laughlin GA, Barrett-Connor E. Ghrelin, adiponectin, and leptin do not predict long-term changes in weight and body mass index in older adults: longitudinal analysis of the Rancho Bernardo cohort. Am J Epidemiol. 2005;162:1189–1197. doi: 10.1093/aje/kwi338. [DOI] [PubMed] [Google Scholar]
- 14.Nagy TR, Davies SL, Hunter GR, Darnell B, Weinsier RL. Serum leptin concentrations and weight gain in postobese, postmenopausal women. Obes Res. 1998;6:257–261. doi: 10.1002/j.1550-8528.1998.tb00347.x. [DOI] [PubMed] [Google Scholar]
- 15.Ahmed ML, Ong KK, Morrell DJ, Cox L, Drayer N, Perry L, Preece MA, Dunger DB. Longitudinal study of leptin concentrations during puberty: sex differences and relationship to changes in body composition. J Clin Endocrinol Metab. 1999;84:899–905. doi: 10.1210/jcem.84.3.5559. [DOI] [PubMed] [Google Scholar]
- 16.Byrnes SE, Baur LA, Bermingham M, Brock K, Steinbeck K. Leptin and total cholesterol are predictors of weight gain in pre-pubertal children. Int J Obes Relat Metab Disord. 1999;23:146–150. doi: 10.1038/sj.ijo.0800783. [DOI] [PubMed] [Google Scholar]
- 17.Johnson MS, Huang TT, Figueroa-Colon R, Dwyer JH, Goran MI. Influence of leptin on changes in body fat during growth in African American and white children. Obes Res. 2001;9:593–598. doi: 10.1038/oby.2001.78. [DOI] [PubMed] [Google Scholar]
- 18.Salbe AD, Weyer C, Lindsay RS, Ravussin E, Tataranni PA. Assessing risk factors for obesity between childhood and adolescence: I. Birth weight, childhood adiposity, parental obesity, insulin, and leptin. Pediatrics. 2002;110:299–306. doi: 10.1542/peds.110.2.299. [DOI] [PubMed] [Google Scholar]
- 19.Savoye M, Dziura J, Castle J, DiPietro L, Tamborlane WV, Caprio S. Importance of plasma leptin in predicting future weight gain in obese children: a two-and-a-half-year longitudinal study. Int J Obes Relat Metab Disord. 2002;26:942–946. doi: 10.1038/sj.ijo.0802018. [DOI] [PubMed] [Google Scholar]
- 20.National Institutes of Health. NIH clinical research studies. Bethesda, MD: National Institutes of Health; 1996. Metabolic differences of overweight children and children of overweight parents. [Google Scholar]
- 21.Frisancho AR. Anthropometric standards for the assessment of growth and nutritional status. Ann Arbor, MI: The University of Michigan Press; 1990. [Google Scholar]
- 22.Brunton JA, Bayley HS, Atkinson SA. Validation and application of dual-energy x-ray absorptiometry to measure bone mass and body composition in small infants. Am J Clin Nutr. 1993;58:839–845. doi: 10.1093/ajcn/58.6.839. [DOI] [PubMed] [Google Scholar]
- 23.Ellis KJ, Shypailo RJ, Pratt JA, Pond WG. Accuracy of DXA-based body composition measurements for pediatric studies. Basic Life Sci. 1993;60:153–156. doi: 10.1007/978-1-4899-1268-8_34. [DOI] [PubMed] [Google Scholar]
- 24.Figueroa-Colon R, Mayo MS, Treuth MS, Aldridge RA, Weinsier RL. Reproducibility of dual-energy x-ray absorptiometry measurements in pre-pubertal girls. Obes Res. 1998;6:262–267. doi: 10.1002/j.1550-8528.1998.tb00348.x. [DOI] [PubMed] [Google Scholar]
- 25.Robotham DR, Schoeller DA, Mercado AB, Mirch MC, Theim KR, Reynolds JC, Yanovski JA. Estimates of body fat in children by Hologic QDR-2000 and QDR-4500A dual-energy x-ray absorptiometers compared with deuterium dilution. J Pediatr Gastroenterol Nutr. 2006;42:331–335. doi: 10.1097/01.mpg.0000189373.31697.15. [DOI] [PMC free article] [PubMed] [Google Scholar]
- 26.Greulich WW, Pyle SI. Radiographic atlas of skeletal development of the hand and wrist. 2. Stanford, CA: Stanford University Press; 1950. [Google Scholar]
- 27.Flor-Cisneros A, Leschek EW, Merke DP, Barnes KM, Coco M, Cutler GB, Jr, Baron J. In boys with abnormal developmental tempo, maturation of the skeleton and the hypothalamic-pituitary-gonadal axis remains synchronous. J Clin Endocrinol Metab. 2004;89:236–241. doi: 10.1210/jc.2002-021954. [DOI] [PubMed] [Google Scholar]
- 28.Hollingshead AB. Hollingshead two factor index of social position, 1957. In: Miller DC, editor. Handbook of research design and social measurement. 5. Newbury Park, CA: Sage Publications; 1991. pp. 351–359. [Google Scholar]
- 29.Ching PLYH, Dietz WH. Reliability and validity of activity measures in preadolescent girls. Pediatr Exerc Sci. 1995;7:89–399. [Google Scholar]
- 30.Bandini LG, Must A, Phillips SM, Naumova EN, Dietz WH. Relation of body mass index and body fatness to energy expenditure: longitudinal changes from preadolescence through adolescence. Am J Clin Nutr. 2004;80:1262–1269. doi: 10.1093/ajcn/80.5.1262. [DOI] [PubMed] [Google Scholar]
- 31.Anderson SE, Bandini LG, Must A. Child temperament does not predict adolescent body composition in girls. Int J Obes (Lond) 2005;29:47–53. doi: 10.1038/sj.ijo.0802844. [DOI] [PubMed] [Google Scholar]
- 32.Ainsworth BE, Haskell WL, Whitt MC, Irwin ML, Swartz AM, Strath SJ, O’Brien WL, Bassett DR, Jr, Schmitz KH, Emplaincourt PO, Jacobs DR, Jr, Leon AS. Compendium of physical activities: an update of activity codes and MET intensities. Med Sci Sports Exerc. 2000;32:S498–504. doi: 10.1097/00005768-200009001-00009. [DOI] [PubMed] [Google Scholar]
- 33.Cole TJ, Faith MS, Pietrobelli A, Heo M. What is the best measure of adiposity change in growing children: BMI, BMI %, BMI z-score or BMI centile? Eur J Clin Nutr. 2005;59:419–425. doi: 10.1038/sj.ejcn.1602090. [DOI] [PubMed] [Google Scholar]
- 34.Kuczmarski RJ, Ogden CL, Guo SS, Grummer-Strawn LM, Flegal KM, Mei Z, Wei R, Curtin LR, Roche AF, Johnson CL. 2000 CDC growth charts for the United States: methods and development. Vital Health Stat. 2002;11:1–190. [PubMed] [Google Scholar]
- 35.Crowder M, Hand DJ. Analysis of repeated measures. New York: Chapman and Hall; 1990. [Google Scholar]
- 36.Frankenfield DC, Rowe WA, Cooney RN, Smith JS, Becker D. Limits of body mass index to detect obesity and predict body composition. Nutrition. 2001;17:26–30. doi: 10.1016/s0899-9007(00)00471-8. [DOI] [PubMed] [Google Scholar]
- 37.Dietz WH, Bellizzi MC. Introduction: the use of body mass index to assess obesity in children. Am J Clin Nutr. 1999;70:123S–125S. doi: 10.1093/ajcn/70.1.123s. [DOI] [PubMed] [Google Scholar]
- 38.Schaefer F, Georgi M, Wuhl E, Scharer K. Body mass index and percentage fat mass in healthy German schoolchildren and adolescents. Int J Obes Relat Metab Disord. 1998;22:461–469. doi: 10.1038/sj.ijo.0800608. [DOI] [PubMed] [Google Scholar]
- 39.Freedman DS, Khan LK, Serdula MK, Dietz WH, Srinivasan SR, Berenson GS. Racial differences in the tracking of childhood BMI to adulthood. Obes Res. 2005;13:928–935. doi: 10.1038/oby.2005.107. [DOI] [PubMed] [Google Scholar]
- 40.Sallis JF, Saelens BE. Assessment of physical activity by self-report: status, limitations, and future directions. Res Q Exerc Sport. 2000;71:S1–S14. [PubMed] [Google Scholar]
- 41.Parsons TJ, Manor O, Power C. Physical activity and change in body mass index from adolescence to mid-adulthood in the 1958 British cohort. Int J Epidemiol. 2006;35:197–204. doi: 10.1093/ije/dyi291. [DOI] [PubMed] [Google Scholar]
- 42.Salbe AD, Weyer C, Harper I, Lindsay RS, Ravussin E, Tataranni PA. Assessing risk factors for obesity between childhood and adolescenc. II. Energy metabolism and physical activity. Pediatrics. 2002;110:307–314. doi: 10.1542/peds.110.2.307. [DOI] [PubMed] [Google Scholar]
- 43.Goran MI, Shewchuk R, Gower BA, Nagy TR, Carpenter WH, Johnson RK. Longitudinal changes in fatness in white children: no effect of childhood energy expenditure. Am J Clin Nutr. 1998;67:309–316. doi: 10.1093/ajcn/67.2.309. [DOI] [PubMed] [Google Scholar]
- 44.Johnson MS, Figueroa-Colon R, Herd SL, Fields DA, Sun M, Hunter GR, Goran MI. Aerobic fitness, not energy expenditure, influences subsequent increase in adiposity in black and white children. Pediatrics. 2000;106:E50. doi: 10.1542/peds.106.4.e50. [DOI] [PubMed] [Google Scholar]
- 45.Reilly JJ, Armstrong J, Dorosty AR, Emmett PM, Ness A, Rogers I, Steer C, Sherriff A. Early life risk factors for obesity in childhood: cohort study. BMJ. 2005;330:1357. doi: 10.1136/bmj.38470.670903.E0. [DOI] [PMC free article] [PubMed] [Google Scholar]
- 46.Velasquez-Mieyer P, Perez-Faustinelli S, Cowan PA. Identifying children at risk for obesity, type 2 diabetes, and cardiovascular disease. Diabetes Spectr. 2005;18:213–220. [Google Scholar]
- 47.Odeleye OE, de Courten M, Pettitt DJ, Ravussin E. Fasting hyperinsulinemia is a predictor of increased body weight gain and obesity in Pima Indian children. Diabetes. 1997;46:1341–1345. doi: 10.2337/diab.46.8.1341. [DOI] [PubMed] [Google Scholar]
- 48.Travers SH, Jeffers BW, Eckel RH. Insulin resistance during puberty and future fat accumulation. J Clin Endocrinol Metab. 2002;87:3814–3818. doi: 10.1210/jcem.87.8.8765. [DOI] [PubMed] [Google Scholar]
- 49.Maffeis C, Moghetti P, Grezzani A, Clementi M, Gaudino R, Tato L. Insulin resistance and the persistence of obesity from childhood into adulthood. J Clin Endocrinol Metab. 2002;87:71–76. doi: 10.1210/jcem.87.1.8130. [DOI] [PubMed] [Google Scholar]
- 50.Johnson MS, Figueroa-Colon R, Huang TT, Dwyer JH, Goran MI. Longitudinal changes in body fat in African American and Caucasian children: influence of fasting insulin and insulin sensitivity. J Clin Endocrinol Metab. 2001;86:3182–3187. doi: 10.1210/jcem.86.7.7665. [DOI] [PubMed] [Google Scholar]
- 51.Segal KR, Landt M, Klein S. Relationship between insulin sensitivity and plasma leptin concentration in lean and obese men. Diabetes. 1996;45:988–991. doi: 10.2337/diab.45.7.988. [DOI] [PubMed] [Google Scholar]
- 52.Boden G, Chen X, Kolaczynski JW, Polansky M. Effects of prolonged hyperinsulinemia on serum leptin in normal human subjects. J Clin Invest. 1997;100:1107–1113. doi: 10.1172/JCI119621. [DOI] [PMC free article] [PubMed] [Google Scholar]
- 53.Swinburn BA, Nyomba BL, Saad MF, Zurlo F, Raz I, Knowler WC, Lillioja S, Bogardus C, Ravussin E. Insulin resistance associated with lower rates of weight gain in Pima Indians. J Clin Invest. 1991;88:168–173. doi: 10.1172/JCI115274. [DOI] [PMC free article] [PubMed] [Google Scholar]
- 54.Valdez R, Mitchell BD, Haffner SM, Hazuda HP, Morales PA, Monterrosa A, Stern MP. Predictors of weight change in a bi-ethnic population. The San Antonio Heart Study. Int J Obes Relat Metab Disord. 1994;18:85–91. [PubMed] [Google Scholar]
- 55.Hoag S, Marshall JA, Jones RH, Hamman RF. High fasting insulin levels associated with lower rates of weight gain in persons with normal glucose tolerance: the San Luis Valley Diabetes Study. Int J Obes Relat Metab Disord. 1995;19:175–180. [PubMed] [Google Scholar]
- 56.Folsom AR, Jacobs DR, Jr, Wagenknecht LE, Winkhart SP, Yunis C, Hilner JE, Savage PJ, Smith DE, Flack JM. Increase in fasting insulin and glucose over seven years with increasing weight and inactivity of young adults. The CARDIA Study. Coronary Artery Risk Development in Young Adults. Am J Epidemiol. 1996;144:235–246. doi: 10.1093/oxfordjournals.aje.a008918. [DOI] [PubMed] [Google Scholar]
- 57.Folsom AR, Vitelli LL, Lewis CE, Schreiner PJ, Watson RL, Wagenknecht LE. Is fasting insulin concentration inversely associated with rate of weight gain? Contrasting findings from the CARDIA and ARIC study cohorts. Int J Obes Relat Metab Disord. 1998;22:48–54. doi: 10.1038/sj.ijo.0800542. [DOI] [PubMed] [Google Scholar]
- 58.Wing RR, Matthews KA, Kuller LH, Smith D, Becker D, Plantinga PL, Meilahn EN. Environmental and familial contributions to insulin levels and change in insulin levels in middle-aged women. JAMA. 1992;268:1890–1895. [PubMed] [Google Scholar]
- 59.Lakka HM, Salonen JT, Tuomilehto J, Kaplan GA, Lakka TA. Obesity and weight gain are associated with increased incidence of hyperinsulinemia in non-diabetic men. Horm Metab Res. 2002;34:492–498. doi: 10.1055/s-2002-34788. [DOI] [PubMed] [Google Scholar]