

Abstract
Mitochondrial genomic mutations are found in a variety of human cancers; however, the frequency of mitochondrial DNA (mtDNA) mutations in coding regions remains poorly defined, and the functional effects of mitochondrial mutations found in primary human cancers are not well described. Using MitoChip, we sequenced the whole mitochondrial genome in 83 head and neck squamous cell carcinomas. Forty-one of 83 (49%) tumors contained mtDNA mutations. Mutations occurred within noncoding (D-loop) and coding regions. A nonrandom distribution of mutations was found throughout the mitochondrial enzyme complex components. Sequencing of margins with dysplasia demonstrated an identical nonconservative mitochondrial mutation (A76T in ND4L) as the tumor, suggesting a role of mtDNA mutation in tumor progression. Analysis of p53 status showed that mtDNA mutations correlated positively with p53 mutations (P < 0.002). To characterize biological function of the mtDNA mutations, we cloned NADH dehydrogenase subunit 2 (ND2) mutants based on primary tumor mutations. Expression of the nuclear-transcribed, mitochondrial-targeted ND2 mutants resulted in increased anchorage-dependent and -independent growth, which was accompanied by increased reactive oxygen species production and an aerobic glycolytic metabolic phenotype with hypoxia-inducible factor (HIF)-1α induction that is reversible by ascorbate. Cancer-specific mitochondrial mutations may contribute to development of a malignant phenotype by direct genotoxic effects from increased reactive oxygen species production as well as induction of aerobic glycolysis and growth promotion.
Keywords: p53, reactive oxygen species, MitoChip
Since the initial description by Warburg 70 years ago (1) that cancer cells had impaired mitochondrial respiratory function, the role of aberrant mitochondrial function in tumor development has been suspected. The interest in mitochondrial genomic alterations in cancer has been renewed in recent years because of studies demonstrating mitochondrial DNA (mtDNA) mutations in a variety of solid tumors (2–6). However, many of these investigations are restricted to the mitochondrial noncoding D-loop region. Although a few studies have sequenced the whole mitochondrial genome (2, 7), the mutation frequency and pattern in the entire mitochondrial genome remain poorly defined, particularly in a specific type of tumors, because of the limited sample sizes.
A commonly proposed hypothesis for the role of mtDNA mutations in primary cancers is that mtDNA mutations cause increased reactive oxygen species (ROS) generation, which in turn alters signal transduction pathways, resulting in activation of oncogenes or inactivation of tumor suppressor genes. However, direct cloning of mitochondrial genes into conventional expression vectors is not possible, because direct translation of mitochondrial sequences results in multiple amino acid alterations or premature truncation attributable to differences in translation between the mitochondrial and nuclear genetic code. Therefore, although mtDNA mutations are widely reported, only a few studies explored the biological mechanism of mtDNA mutations in cancer. Murine studies with knockout of MnSOD have shown increased DNA damage and cancer incidence, which suggests a role of ROS in tumor development (8). The potential for mtDNA mutations to influence tumor development has been demonstrated by the finding that ATP/6 mutant cybrids induce an increase in ROS generation with increased tumorigenicity when placed into prostate cancer cell lines (9). However, this mutation was originally derived from a Leigh syndrome patient and was not found in a primary tumor. Definitive evidence of the contribution of mitochondrial genomic mutations found in primary cancers to development of a malignant phenotype has yet to be demonstrated.
We recently have developed an oligonucleotide microarray (MitoChip version 2.0) for rapid and accurate sequencing of the entire mitochondrial genome (10). Using this platform, we report the whole mitochondrial sequences of 83 primary head and neck carcinomas. Because p53 frequently is present in head and neck cancers (11), we analyzed the correlation between the p53 status and mtDNA mutations, and we found a positive association between p53 mutations and mtDNA mutations. In an effort to describe the function of mtDNA mutation in tumorigenesis, we have applied the long-range gene synthesis technique to convert the mitochondrial NADH dehydrogenase subunit 2 (ND2) gene directly into nuclear code and subcloned the gene into a vector containing mitochondrial target sequence. We further demonstrate that nuclear-transcribed, mitochondrial-targeted mutant mitochondrial ND2 proteins based on primary tumor mutants resulted in increased anchorage-dependent and -independent growth, ROS production, and an aerobic glycolytic metabolic phenotype with hypoxia-inducible factor (HIF)-1α induction that is reversible by ascorbate.
Results
mtDNA Mutations in Primary Tumor and Margin Tissues.
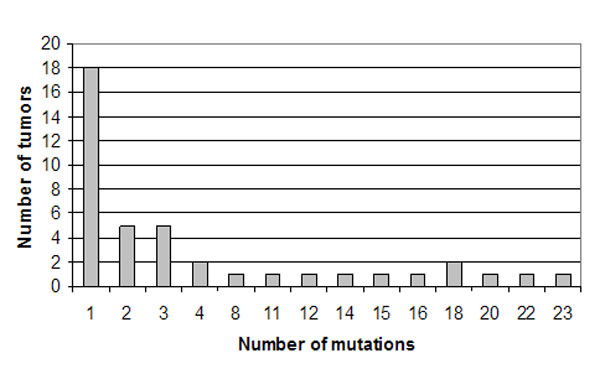
To define the pattern and frequency of mtDNA mutations, we sequenced the entire mitochondrial genome of 83 primary head and neck tumor samples. All samples were sequenced with a mitochondrial microarray-based technique (MitoChip version 2.0), which provides rapid and high-throughput sequencing of mtDNA with >99.99% reproducibility (10, 12). Sequencing results of tumor DNA were compared with those from matching peripheral white blood cells from these patients, and 228 mutations were identified in primary head and neck tumors when compared with matched normal blood leukocyte DNA [supporting information (SI) Table 2]. Mutations were found throughout the D-loop and coding region. We found proportionally more nonsynonymous amino acid-changing mutations in ND2, ND5, COIII, CYTB, and ATP6 genes and, in general, found a nonrandom distribution of mutations throughout the mitochondrial enzyme complex components, as shown in Fig. 1A. Results showed that 49% (41/83) of primary tumors contained at least one mitochondrial genomic mutation, and 29% (24/83) of tumors had nonsynonymous mutations, which were confirmed by conventional PCR-based sequencing. In addition, 14 of 83 tumors contained an alteration in tRNA sequence, 24 of 83 tumors had an alteration in the D-loop sequence of the mitochondrial genome, and 14 of 83 tumors had an alteration in mitochondrial ribosomal RNA sequence. Almost all tumors with mitochondrial mutations contained mutations with potential for altering mitochondrial function via alterations in transcription, translation, or replication: 47% (39/83) of all tumors contained at least one of a D-loop, tRNA, ribosomal RNA, or nonsynonymous coding mutation. Although more mutations were identified in ND2, ND5, COIII, CYTB, and ATP6 genes, no obvious hot spots were found in these genes. The majority of tumors contained from 1 to 4 mutations, with one tumor containing up to 23 mutations (SI Fig. 6).
Fig. 1.

mtDNA mutations in primary tumor and margin tissues. (A) Frequency of mtDNA mutations in mitochondrial genes. Mutations were found in all coding genes and noncoding genes, including D-loop, 12S rRNA, 16S rRNA, and tRNA. All mutations are graphed in gray. Nonsynonymous mutations are shown in black (dAA). (B) An identical mutation in gene ND4L (G-A, at position 10695) was identified in margins with dysplasia adjacent to primary tumor 2232. Mutations were found in margin 3 (M3) having moderate and high-grade dysplasia and margin 4 (M4) having mild dysplasia. Margin 1 (M1) and margin 2 (M2) had no dysplastic changes showing no mutations. Arrows indicate mutations.
Studies on mtDNA alterations revealed that the mtDNA D-loop alterations correlate with the development of head and neck cancer with increasing frequency of the mtDNA alterations paralleling histological severity (13), suggesting that such alterations in mtDNA may play a role in tumor development and transformation. To explore the role of mtDNA in cancer progression, we therefore examined margins harvested adjacent to primary head and neck tumors at the time of tumor resection. From this cohort, one patient had dysplasia at two margins. The remaining patients had no evidence of dysplasia. These two margins with dysplasia demonstrated the same nonconservative mitochondrial mutation (A76T in ND4L) as in the tumor (Fig. 1B).
Association of p53 Mutations and mtDNA Mutations.
We analyzed the correlation between p53 status and mtDNA mutations. All 83 patients previously had undergone sequencing of exons 2–10 of the p53 gene by using array-based sequencing, and detected mutations were confirmed with conventional PCR-based cycle sequencing. Results showed that 53% (44/83) patients had a p53 mutant tumor (SI Table 3), and 69% (57/83) of patients had a tumor that contained either a p53 or mitochondrial mutation. Clinical variables, including age, gender, race, site, stage, clinical outcome, smoking, and ethanol intake, also were analyzed. We found that mitochondrial mutation was associated with p53 mutation status (P = 0.01) (odds ratio: 95%; confidence interval: 1.4, 8.4) and weakly associated with male gender (P = 0.06) and Caucasian race (P = 0.14) (SI Table 4). By using a multivariate model adjusting for race and gender, p53 positive patients are 5.7 times (odds ratio: 95%; confidence interval: 1.9, 17.0) as likely to have a mitochondrial mutation (P = 0.002) (Table 1). Mutation in the p53 gene is associated with tobacco exposure in head and neck cancer (14); however, we did not find an association between p53 or mitochondrial mutation and tobacco exposure in this cohort (SI Table 4).
Table 1.
Multivariate logistic regression analysis for mtDNA mutations and p53 status
| Variable | Odds ratio | Odds ratio 95% confidence limits |
P value | |
|---|---|---|---|---|
| Lower | Upper | |||
| Male | 0.218 | 0.07 | 0.70 | 0.010 |
| White | 0.37 | 0.12 | 1.14 | 0.080 |
| p53 | 5.73 | 1.93 | 17.01 | 0.002 |
Anchorage-Dependent and -Independent Growth.
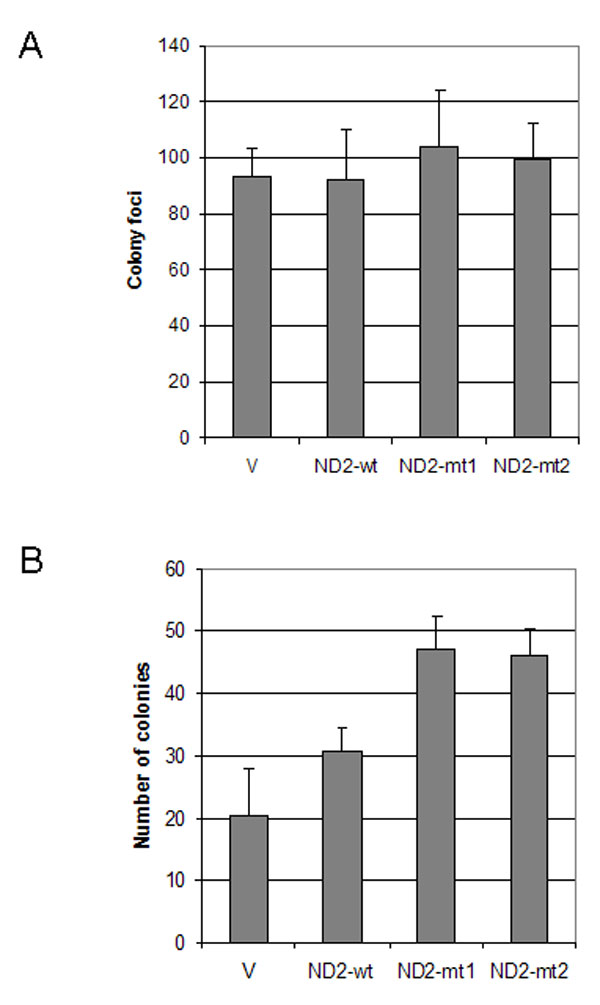
The nonrandom nature of nonsynonymous mitochondrial mutations, association with premalignant precursors, and association with other gene alterations in mitochondrial genes may suggest that nonsynonymous mitochondrial mutations provide a selective advantage during tumor development and progression. To determine the role of mtDNA mutation in tumorigenesis, we cloned ND2 mutants found in primary head and neck squamous cell carcinomas (HNSCC). Using long-range gene synthesis (Genscript, Piscataway, NJ), we converted the ND2 gene directly into nuclear code and subcloned the gene into a vector containing mitochondrial target sequence (pCMV/myc/mito). We transfected wild-type and mutant nuclear versions of mutant ND2 found during sequencing of the primary tumors into HeLa cells and performed RT-PCR to confirm the expression of the transfected gene (Fig. 2A). We chose HeLa cells for our experiments because we had sequenced the entire mitochondrial genome of this cell line and found that it has no mutations in ND2. We performed standard colony focus assays and found a significant increase in colony formation in both mutants when compared with wild type (P < 0.05) (Fig. 2B). A significant increase in anchorage-independent growth also was seen in mutants when compared with vector alone and wild type (P < 0.05) (Fig. 2 C and D). We then assessed the ability of these ND2 mutants to proliferate in an anchorage-independent manner. We performed experiments on normal human oral immortalized keratinocytes OKF6 and head and neck squamous cancer cell line O19. However, soft-agar assay revealed that OKF6 cells transfected with ND2 mutants were not able to form colonies. In contrast, O19 cells transfected with ND2 mutants formed significantly more colonies in soft agar compared with wild type, although no difference was observed in colony focus assays (SI Fig. 7).
Fig. 2.

ND2 mutants induced increased anchorage-dependent and -independent growth. (A) RT-PCR showing expression of vector (V), wild-type (wt), and mutant (mt1 and mt2) constructs after transient transfection. (B) Colony focus assay showing increased colony formation in ND2 mutants (mt1 and mt2) compared with vector and wild type (mt1: ND2-G4831A, amino acid change G-D; mt2: ND2-A4605G, amino acid change K-E). The numbers represent the total number of colonies per dish. Data represent mean ± SD of three independent experiments. Student's t test showed significance between mutants and wild type (P < 0.05). (C) Soft-agar assay showing increased anchorage-independent growth in mutants 1 and 2 compared with vector and wild-type construct. Data represent mean ± SD of three independent experiments. Student's t test showed significance between mutants and wild type (P < 0.05). (D) Representative pictures of colonies in soft agar for the different vector (Upper Left), wild-type (Upper Right), and mutant 1 (Lower Left) and 2 (Lower Right) constructs.
Mutant-Induced ROS Generation.
To explore mechanism by which these mutations contributed to the phenotypic expression of malignancy, we measured ROS production in HeLa cells transfected with mutant mitochondrial-coded ND2. As shown in Fig. 3, ROS production was markedly increased in cells transfected with mutants when compared with wild-type and vector-alone transfected cells.
Fig. 3.

ROS generation in transfected HeLa cells measured by flow cytometer. Forty-eight hours posttransfection, cells were harvested, and ROS was measured with a fluorescence probe 2′,7′-dichlorodihydrofluorescein diacetate (DCFH-DA). Significant increase in ROS was detected in mutants compared with wild type and vector as indicated by the counts in the M1 region. As a positive control, ROS was measured in cells pretreated with 100 μM H2O2 for 30 min. Image represents two individual experiments.
Induction of HIF-1α and Elevated Pyruvate and Lactate Production.
Recently, the cancer-specific aerobic glycolytic metabolism reported by Warburg (1) 70 years ago has been linked to impairment of HIF-1α degradation induced by 2-oxoglutarate analogs, including pyruvate and lactate, which can be reversed by addition of ascorbate and other agents (15). We hypothesized that the identified mutations in mitochondrial complex I subunit 2 (ND2) also may result in impaired respiration, resulting in accumulation of reduced NADH and pyruvate and HIF-1α stabilization. We created stably transfected HeLa cells and found elevated pyruvate and lactate when comparing mutant-transfected cell lines with wild type (Fig. 4). We further examined the expression level of HIF-1α in cells transfected with mutant and wild type. To maximize the effect of ND2 mutants, cells transfected with ND2 were incubated with Krebs buffer for 4 h. As shown in Fig. 5, transfection of mutant ND2 constructs resulted in HIF-1 stabilization in one of the mutant transfectants, and stabilization was abolished by the addition of ascorbate.
Fig. 4.

Pyruvate (A) and lactate (B) measurement. HeLa cells stably transfected with ND2 mutants and wild-type constructs were plated in a six-well plate (1.5 × 10⁵ per well). The cells were allowed to grow in pyruvate- and lactate-free media for 24 h, then media were collected and assayed for concentrations of pyruvate and lactate. Data represent mean ± SD of three individual experiments. Student's t test showed significance between mutants and wild type (P < 0.05).
Fig. 5.

Western blot for HIF-1α. HIF-1α stabilization induced by mutant 1 (mt1) transfection of HeLa cells compared with vector alone (V) and wild type (wt), with reversal by addition of 100 μM ascorbate (+). After 48 h of transfection, cells were incubated with glucose-free Krebs buffer for 4 h with or without ascorbate. The cells then were harvested for Western blotting as described in Materials and Methods. Ctrl, positive control from cells treated with 100 μM cobalt chloride for 24 h. Densitometric analysis from replicate experiments is shown below a representative Western blot.
Discussion
Although mtDNA mutations are reported in a variety of human cancers, the pattern and frequency of mtDNA mutations are poorly defined in any given type of human tumors. In this study, we have sequenced a total of 83 primary head and neck cancers. This represents a large cohort of the entire mitochondrial sequencing in head and neck cancers. Of 83 tumors, 41 (49%) contain mtDNA mutations. Although mutations occur throughout the entire mitochondrial genome, most mutations are in the D-loop region. Because of its unique triple-stranded DNA structure, the D-loop region is hypervariable and susceptible to somatic mutations. In the coding region, we found proportionally more nonsynonymous amino acid-changing mutations in ND2, ND5, COIII, CYTB, and ATP6 genes (Fig. 1A). It should be noted here that the deletion of the mitochondrial genome, particularly the common 4,977-bp deletion, has been reported in oral cancer (16). However, we were unable to detect such a deletion with the current assay. Comprehensive analysis of this common deletion in head and neck cancers may be important because controversial reports exist on the mutation rate of this common deletion between normal and tumor tissues (17, 18). Nevertheless, we found a nonrandom distribution of mutations throughout the mitochondrial enzyme complex components in this relatively large cohort of tumors, and we found no mutational hot spots in these genes. We found that almost all of the tumors with mtDNA mutations contained at least one of a D-loop, tRNA, ribosomal RNA, or nonsynonymous coding mutation, thus possessing a potential for altering mitochondrial function via alterations in transcription, translation, or replication. In addition, an identical mutation in gene ND4L (Fig. 1B) was identified in margins with dysplasia adjacent to the primary tumor, indicating that mitochondrial mutation occurred early in cancer progression in this tumor, before the development of an invasive phenotype. All of these results suggest that mitochondrial mutations may play a role in tumor development. Although nonsynonymous amino acid-changing mutations may possess a biological function, most mutations were synonymous mutations in this cohort. A nonrandom distribution of synonymous mutations was observed throughout coding regions. In general, more synonymous mutations were found in ND2, ND5, COI, and CYTB. It recently has been demonstrated that variations in synonymous codons in a defined gene can affect in vivo protein structure and thus alter function (19, 20). If this is the case for mitochondrial genes, the role of synonymous mtDNA mutations in cancer may not be neglected, given the fact that most mutations are synonymous mutations.
In contrast to previous studies, a high proportion of heteroplasmic mutations were identified in the present study, which may reflect the high sensitivity of the MitoChips compared with conventional sequencing assays (10, 21). The predominant mutations are G-A and T-C transitions, which often are induced by oxidative exposure (22). Like any other sequencing technology, accuracy is an important concern in mtDNA sequencing. Particularly, sample contamination has been increasingly gaining attention when analyzing mtDNA sequences, as criticized in a recent report (23). This problem was excluded in the present study because contamination or sample mix-up would result in identification of same mutations in distinct samples. Of the 228 mutations identified, only 4 were repeated in the 83 tumors, a D-loop mutation was shared among three tumors with additional discordant mutations in these three samples, and a single ATP6 mutation was shared between two tumors with other discordant mutations found in these two samples.
Because of its limited repair ability and lack of histone protection, mtDNA is vulnerable to endogenous and exogenous ROS (24–26). Yet, the mechanisms leading to high mutation rate of mtDNA in tumors are not fully understood. It has been known that p53 possesses antioxidant functions through up-regulating other antioxidant genes (27–29). Given the frequent occurrence of p53 mutations in head and neck cancers (14, 30, 31), we therefore analyzed the association between the mtDNA mutations and p53 status. We demonstrate that there is a positive correlation between mtDNA mutations and p53 mutations. The lack of an association between mtDNA mutations and tobacco exposure suggests that mitochondrial mutations are more likely to be caused by a deficiency in p53-facilitated base-excision repair and/or an increased oxidative stress in cells with mutant p53, rather than by tobacco smoking itself. We propose that, in addition to other mechanisms, p53 mutations may participate in tumor progression through regulation of mitochondrial genomic integrity. Indeed, it has been demonstrated experimentally that p53 is involved in maintaining base-excision repair and genetic stability (32–34).
Another important finding in the present study is that we demonstrate that transfection of mutant mitochondrial gene ND2 induces increased anchorage-dependent and -independent growth in cancer cell lines (Fig. 2), accompanied by an increased ROS production (Fig. 3) and an aerobic glycolytic metabolic phenotype (Fig. 4) together with HIF-1α induction (Fig. 5). However, these mutants were not able to induce cell growth in immortalized OKF6 cells, which suggests that these mitochondrial mutations by themselves may not be powerful enough to cause malignant transformation but may promote the expression of a malignant phenotype in conjunction with other alterations. As mentioned previously, the potential for mtDNA mutations to influence tumor development has been demonstrated by a previous study that ATP6 mutant induces an increase in ROS generation with increased tumorigenicity when placed into prostate cancer cell lines (9). However, this mutation was not originally found in primary tumor. It is worth noting that functional analysis of mtDNA mutations largely is limited by the difficulty in cloning mitochondrial genes, which requires broad conversions of mitochondrial sequence to nuclear codes. In the present study, we used long-range gene synthesis to directly convert the ND2 gene to nuclear universal codes. Application of the long-range gene synthesis technique is of particular significance in mitochondrial gene cloning. In addition to the differences between mitochondrial genetic codes and universal codes, frequent polymorphisms exist in a variety of cell lines. Using long-range gene synthesis thus has become extremely helpful in cloning the mitochondrial genes according to varying background sequences of individual host cells.
Our functional data demonstrate a link between mitochondrial genomic mutations found in primary human cancers and induction of an aerobic, glycolytic, and malignant phenotype that has been a known feature of most solid tumors for over half a century. Mitochondrial mutations may provide a dual role in tumor development. Mitochondrial mutations may activate pathways involved in development and maintenance of a malignant phenotype, including HIF-1α induction, via a conversion to a glycolytic metabolism. In addition, generation of increased cellular ROS results in a continuous genomic insult that may induce mutations and chromosomal alterations in both nuclear and mitochondrial genomes. In this manner, mitochondrial mutations may alter the role of a functional oxidative phosphorylation chain as both a metabolic gatekeeper to prevent inappropriate conversion to a glycolytic metabolic phenotype and a caretaker to prevent inappropriate production of genotoxic ROS.
Mitochondrial respiratory chain protein mutations may have alternative mechanisms in contributing to malignant phenotypes outside of these described pathways (35). For example, ND2 interacts with Src outside of the mitochondrion, and differences in HIF-1α stabilization by the studied mutations may be caused by effects of ND2 mutations outside respiratory chain function. Because of the ability to express mutant mitochondrial-encoded genes in nuclear-translated constructs, the functional effects of cancer-specific mutations in other mitochondrial-encoded genes are of significant interest, and further characterization of the effects of other mutations may define other means by which mitochondrial mutations induce a malignant phenotype.
Materials and Methods
Tissue Samples and DNA Isolation.
Eighty-three primary head and neck tumor tissues and matched normal specimens (lymphocytes) were collected after surgical resections with prior consent from patients in The Johns Hopkins University Hospital as per institutional review board approved protocols. Tumor specimens were frozen and microdissected on a cryostat so that the tumor samples contained >70% neoplastic cells. Tissues were digested with 1% SDS/proteinase K, and DNA was extracted by phenol-chloroform and ethanol-precipitated. Control DNA from matched peripheral lymphocytes was processed in the same manner as described in ref. 36.
Sequencing of DNA Samples.
All of the DNA samples were sequenced with MitoChip version 2.0, an oligonucleotide microarray. Briefly, the entire mtDNA sequence was amplified in three overlapping long PCR fragments, with each reaction containing 50 ng of genomic DNA. The amplified PCR products then were fragmented and labeled with GeneChip DNA labeling reagent and 3.4 μl of 30 units/μl terminal deoxynucleotidyl transferase (both from Affymetrix, Santa Clara, CA). Prehybridization, hybridization, washing, and scanning of the MitoChip were performed as described in the Affymetrix CustomSeq Resequencing protocol. The entire procedure was described in detail in ref. 10.
GeneChip p53 Assay.
The p53 mutations were detected by the GeneChip p53 assay (Affymetrix). The whole procedure was described in ref. 37. All mutations detected by GeneChip p53 assay or Surveyor/denaturing HPLC analysis were identified and confirmed by automatic (ABI BigDye cycle sequencing kit; Applied Biosystems, Foster City, CA) or direct dideoxynucleotide sequencing.
Cell Culture.
Human HeLa cell line was purchased from the American Type Culture Collection (Manassas, VA). HeLa cells were grown in DMEM supplemented with 10% FBS containing penicillin/streptomycin in a humidified incubator at 37°C, 5% CO2. Head and neck squamous cancer cell line O19 was established in The Johns Hopkins University Department of Otolaryngology–Head and Neck Surgery. O19 cells were grown in RPMI medium 1640 supplemented with 10% FBS containing penicillin/streptomycin in a humidified incubator at 37°C, 5% CO2.
Plasmid Construction.
We converted the ND2 gene into nuclear code directly by using long-range gene synthesis (Genscript). With this long-range gene synthesis technique, we synthesized ND2 wild type and two mutants, mt1 (ND2-G4831A; amino acid change G-D) and mt2 (ND2-A4605G; amino acid change K-E). The synthesized wild type and mutants then were subcloned into SalI and NotI sites of plasmid pCMV/myc/mito (Invitrogen, Carlsbad, CA). Plasmids then were resequenced with conventional sequencing to confirm results.
Transfection of ND2 Constructs.
HeLa cells were transfected with empty vector, wild-type, or mutant constructs at 40–60% confluence by using FuGENE 6 (Roche, Basel, Switzerland) according to product protocols.
RNA Extraction, cDNA Synthesis, and RT-PCR.
Total cellular RNA was isolated with the RNeasy kit (Qiagen, Valencia, CA) according to the manufacturer's instructions. Total RNA was measured and adjusted to the same amount for each cell line, and then cDNA synthesis was performed by using random hexamers with the SuperScript First-Strand Synthesis kit (Invitrogen). The final cDNA products were used as the templates for subsequent RT-PCR. GAPDH was used as reference. The RT-PCR primer pair sequences for the ND2 construct were forward, 5′-GCCCAAATGGGCCATTATC-3′, and reverse, 5′-TCAGATCCTCTTCTGAGATGG-3′. The primer pair sequences for GAPDH were forward, 5′-CAACTACATGGTTTACATGTTC-3′, and reverse, 5′-GCCAGTGGACTCCACGAC-3′.
Colony Formation Assay.
Forty-eight hours after transfection with wild-type, mutant, or control constructs, cells (1 × 10⁵) were seeded into 100-mm Petri dishes with 10 ml of DMEM supplemented with 10% FBS and 1,000 μg/ml G418. After 14 days, the resulting colonies were rinsed with PBS, fixed with methanol, and stained with Giemsa (Sigma, St. Louis, MO). The number of colonies per dish was counted. All experiments were performed in triplicate, and standard deviations were calculated.
Soft-Agar Assay.
Soft-agar assays were performed on six-well plates. Forty-eight hours after transfection with wild-type, mutant, or control constructs, cells (5 × 10³) were mixed with 1 ml of DMEM with 0.3% low-melting agarose and 10% FBS supplemented with 1,000 μg/ml G418 and poured onto a bed of 1 ml per well DMEM with 0.5% agarose and 10% FBS supplemented with 1,000 μg/ml G418. After 18 days, colonies were counted with the Nikon SMZ1500 microscope and photographed with the Nikon DXM camera. All experiments were performed in triplicate, and standard deviations were calculated.
Assessment of ROS Generation.
Cellular production of ROS was detected with a cell-permeable probe, 2′,7′-dichlorodihydrofluorescein diacetate (DCFH-DA). The probe is oxidized to yield high-intensity fluorescence in the presence of simple (hydrogen peroxide) and more complex related peroxides. The DCF fluorescence intensity therefore is proportional to the amount of ROS formed and was used here to assess total ROS production. In brief, cultured cells were harvested, washed with PBS, and resuspended in serum-free medium. The cells then were incubated with 5 μM DCFH-DA for 45 min at 37°C, washed with PBS, and placed on ice. Fluorescence was measured by flow cytometry. As a positive control, cells were pretreated with 100 μM H2O2 for 30 min.
Pyruvate and Lactate Measurement.
To measure pyruvate and lactate, 50 μl of medium was taken from cells grown in 2 ml of medium in six-well cell culture plates and frozen until the time of measurement. Before measurement, samples were centrifuged to remove any microbubbles. Pyruvate and lactate content was measured by the enzymatic method using a pyruvate and lactate kit (Sigma). Metabolite measurements were performed with the CMA 600 Analyzer (CMA/Microdialysis, Acton, MA).
Western Blot.
The cultured cells were scraped in PBS and centrifuged at 670 × g for 5 min. Cell pellets were lysed in 1× RIPA buffer [25 mM Tris·HCl (pH 7.6), 150 mM NaCl, 1% Nonidet P-40, 1% sodium deoxycholate, and 0.1% SDS] supplemented with protease inhibitor. The total lysate was centrifuged at 17,900 × g for 10 min, and supernatant was collected. Western blot analysis was performed by using standard techniques. For each sample, 30 μg of protein was separated on 4–12% NuPAGE gel (Invitrogen) and electroblotted onto poly(vinylidene difluoride) membranes. Membranes then were incubated in PBS supplemented with 5% nonfat dry milk for 1 h at room temperature. The HIF-1α was probed with anti-HIF-1α antibody (1:1,500; BD Bioscience, San Jose, CA) at 4°C overnight. The blots were visualized by using a peroxidase substrate system and ECL Western blotting detection reagents (Amersham Biosciences, Piscataway, NJ). Control of protein loading was achieved by reprobing with anti-β-actin (Sigma).
Statistical Analysis.
Tumor samples were classified into different categories according to age, race, tumor sites, smoking history, and p53 status. Univariate and multivariate logistic regression analyses were performed to determine the associations between mtDNA mutations and the clinical characteristics with the SAS system. Student's t test was used to compare the difference in two groups.
Supplementary Material
Acknowledgments
J.A.C. is a Damon Runyon-Lilly Clinical Investigator supported by the Damon Runyon Cancer Research Foundation (CI#9) and by a Clinical Innovator Award from the Flight Attendant Medical Research Institute. Support for this study was provided by National Institute of Dental and Craniofacial Research Grant R01 DE015939-01, National Cancer Institute Head and Neck SPORE Grant P50 CA96784, and National Institute of Dental and Craniofacial Research Grant R01 DE013152. S.K. is an AEGON International fellow.
Abbreviations
- ND2
NADH dehydrogenase subunit 2
- HIF
hypoxia-inducible factor
- ROS
reactive oxygen species.
Footnotes
The authors declare no conflict of interest.
This article is a PNAS Direct Submission.
This article contains supporting information online at www.pnas.org/cgi/content/full/0610818104/DC1.
References
- 1.Warburg O. The Metabolism of Tumors. New York: RR Smith; 1931. [Google Scholar]
- 2.Fliss MS, Usadel H, Caballero OL, Wu L, Buta MR, Eleff SM, Jen J, Sidransky D. Science. 2000;287:2017–2019. doi: 10.1126/science.287.5460.2017. [DOI] [PubMed] [Google Scholar]
- 3.Hibi K, Nakayama H, Yamazaki T, Takase T, Taguchi M, Kasai Y, Ito K, Akiyama S, Nakao A. Int J Cancer. 2001;92:319–321. doi: 10.1002/ijc.1204. [DOI] [PubMed] [Google Scholar]
- 4.Tamura G, Nishizuka S, Maesawa C, Suzuki Y, Iwaya T, Sakata K, Endoh Y, Motoyama T. Eur J Cancer. 1999;35:316–319. doi: 10.1016/s0959-8049(98)00360-8. [DOI] [PubMed] [Google Scholar]
- 5.Wallace DC. Science. 1999;283:1482–1488. doi: 10.1126/science.283.5407.1482. [DOI] [PubMed] [Google Scholar]
- 6.Zhao YB, Yang HY, Zhang XW, Chen GY. World J Gastroenterol. 2005;11:3304–3306. doi: 10.3748/wjg.v11.i21.3304. [DOI] [PMC free article] [PubMed] [Google Scholar]
- 7.Tan DJ, Bai RK, Wong LJ. Cancer Res. 2002;62:972–976. [PubMed] [Google Scholar]
- 8.Van Remmen H, Ikeno Y, Hamilton M, Pahlavani M, Wolf N, Thorpe SR, Alderson NL, Baynes JW, Epstein CJ, Huang TT, et al. Physiol Genomics. 2003;16:29–37. doi: 10.1152/physiolgenomics.00122.2003. [DOI] [PubMed] [Google Scholar]
- 9.Petros JA, Baumann AK, Ruiz-Pesini E, Amin MB, Sun CQ, Hall J, Lim S, Issa MM, Flanders WD, Hosseini SH, et al. Proc Natl Acad Sci USA. 2005;102:719–724. doi: 10.1073/pnas.0408894102. [DOI] [PMC free article] [PubMed] [Google Scholar]
- 10.Zhou S, Kassauei K, Cutler DJ, Kennedy GC, Sidransky D, Maitra A, Califano J. J Mol Diagn. 2006;8:476–482. doi: 10.2353/jmoldx.2006.060008. [DOI] [PMC free article] [PubMed] [Google Scholar]
- 11.Brennan JA, Mao L, Hruban RH, Boyle JO, Eby YJ, Koch WM, Goodman SN, Sidransky D. N Engl J Med. 1995;332:429–435. doi: 10.1056/NEJM199502163320704. [DOI] [PubMed] [Google Scholar]
- 12.Maitra A, Arking DE, Shivapurkar N, Ikeda M, Stastny V, Kassauei K, Sui G, Cutler DJ, Liu Y, Brimble SN, et al. Nat Genet. 2005;37:1099–1103. doi: 10.1038/ng1631. [DOI] [PubMed] [Google Scholar]
- 13.Balaram P, Sridhar H, Rajkumar T, Vaccarella S, Herrero R, Nandakumar A, Ravichandran K, Ramdas K, Sankaranarayanan R, Gajalakshmi V, et al. Int J Cancer. 2002;98:440–445. doi: 10.1002/ijc.10200. [DOI] [PubMed] [Google Scholar]
- 14.Brennan JA, Boyle JO, Koch WM, Goodman SN, Hruban RH, Eby YJ, Couch MJ, Forastiere AA, Sidransky D. N Engl J Med. 1995;332:712–717. doi: 10.1056/NEJM199503163321104. [DOI] [PubMed] [Google Scholar]
- 15.Lu H, Dalgard CL, Mohyeldin A, McFate T, Tait AS, Verma A. J Biol Chem. 2005;280:41928–41939. doi: 10.1074/jbc.M508718200. [DOI] [PubMed] [Google Scholar]
- 16.Shieh DB, Chou WP, Wei YH, Wong TY, Jin YT. Ann NY Acad Sci. 2004;1011:154–167. doi: 10.1007/978-3-662-41088-2_16. [DOI] [PubMed] [Google Scholar]
- 17.Kamalidehghan B, Houshmand M, Ismail P, Panahi MS, Akbari MH. Arch Med Res. 2006;37:730–735. doi: 10.1016/j.arcmed.2006.02.005. [DOI] [PubMed] [Google Scholar]
- 18.Wu CW, Yin PH, Hung WY, Li AF, Li SH, Chi CW, Wei YH, Lee HC. Genes Chromosomes Cancer. 2005;44:19–28. doi: 10.1002/gcc.20213. [DOI] [PubMed] [Google Scholar]
- 19.Komar AA. Science. 2007;315:466–467. doi: 10.1126/science.1138239. [DOI] [PubMed] [Google Scholar]
- 20.Kimchi-Sarfaty C, Oh JM, Kim IW, Sauna ZE, Calcagno AM, Ambudkar SV, Gottesman MM. Science. 2007;315:525–528. doi: 10.1126/science.1135308. [DOI] [PubMed] [Google Scholar]
- 21.Maitra A, Cohen Y, Gillespie SE, Mambo E, Fukushima N, Hoque MO, Shah N, Goggins M, Califano J, Sidransky D, Chakravarti A. Genome Res. 2004;14:812–819. doi: 10.1101/gr.2228504. [DOI] [PMC free article] [PubMed] [Google Scholar]
- 22.Cadet J, Berger M, Douki T, Ravanat JL. Rev Physiol Biochem Pharmacol. 1997;131:1–87. doi: 10.1007/3-540-61992-5_5. [DOI] [PubMed] [Google Scholar]
- 23.Salas A, Yao YG, Macaulay V, Vega A, Carracedo A, Bandelt HJ. PLoS Med. 2005;2:e296. doi: 10.1371/journal.pmed.0020296. [DOI] [PMC free article] [PubMed] [Google Scholar]
- 24.Bohr VA, Stevnsner T, de Souza-Pinto NC. Gene. 2002;286:127–134. doi: 10.1016/s0378-1119(01)00813-7. [DOI] [PubMed] [Google Scholar]
- 25.Kang D, Hamasaki N. Curr Genet. 2002;41:311–322. doi: 10.1007/s00294-002-0312-0. [DOI] [PubMed] [Google Scholar]
- 26.Marcelino LA, Thilly WG. Mutat Res. 1999;434:177–203. doi: 10.1016/s0921-8777(99)00028-2. [DOI] [PubMed] [Google Scholar]
- 27.Hussain SP, Amstad P, He P, Robles A, Lupold S, Kaneko I, Ichimiya M, Sengupta S, Mechanic L, Okamura S, et al. Cancer Res. 2004;64:2350–2356. doi: 10.1158/0008-5472.can-2287-2. [DOI] [PubMed] [Google Scholar]
- 28.Tan M, Li S, Swaroop M, Guan K, Oberley LW, Sun Y. J Biol Chem. 1999;274:12061–12066. doi: 10.1074/jbc.274.17.12061. [DOI] [PubMed] [Google Scholar]
- 29.Yoon KA, Nakamura Y, Arakawa H. J Hum Genet. 2004;49:134–140. doi: 10.1007/s10038-003-0122-3. [DOI] [PubMed] [Google Scholar]
- 30.Tabor MP, Brakenhoff RH, Ruijter-Schippers HJ, Kummer JA, Leemans CR, Braakhuis BJ. Clin Cancer Res. 2004;10:3607–3613. doi: 10.1158/1078-0432.CCR-03-0632. [DOI] [PubMed] [Google Scholar]
- 31.van Houten VM, Leemans CR, Kummer JA, Dijkstra J, Kuik DJ, van den Brekel MW, Snow GB, Brakenhoff RH. Clin Cancer Res. 2004;10:3614–3620. doi: 10.1158/1078-0432.CCR-03-0631. [DOI] [PubMed] [Google Scholar]
- 32.de Souza-Pinto NC, Harris CC, Bohr VA. Oncogene. 2004;23:6559–6568. doi: 10.1038/sj.onc.1207874. [DOI] [PubMed] [Google Scholar]
- 33.Achanta G, Sasaki R, Feng L, Carew JS, Lu W, Pelicano H, Keating MJ, Huang P. EMBO J. 2005;24:3482–3492. doi: 10.1038/sj.emboj.7600819. [DOI] [PMC free article] [PubMed] [Google Scholar]
- 34.Chen D, Yu Z, Zhu Z, Lopez CD. Cancer Res. 2006;66:3485–3494. doi: 10.1158/0008-5472.CAN-05-4103. [DOI] [PubMed] [Google Scholar]
- 35.Gingrich JR, Pelkey KA, Fam SR, Huang Y, Petralia RS, Wenthold RJ, Salter MW. Proc Natl Acad Sci USA. 2004;101:6237–6242. doi: 10.1073/pnas.0401413101. [DOI] [PMC free article] [PubMed] [Google Scholar]
- 36.Ahrendt SA, Chow JT, Xu LH, Yang SC, Eisenberger CF, Esteller M, Herman JG, Wu L, Decker PA, Jen J, Sidransky D. J Natl Cancer Inst. 1999;91:332–339. doi: 10.1093/jnci/91.4.332. [DOI] [PubMed] [Google Scholar]
- 37.Ahrendt SA, Halachmi S, Chow JT, Wu L, Halachmi N, Yang SC, Wehage S, Jen J, Sidransky D. Proc Natl Acad Sci USA. 1999;96:7382–7387. doi: 10.1073/pnas.96.13.7382. [DOI] [PMC free article] [PubMed] [Google Scholar]
Associated Data
This section collects any data citations, data availability statements, or supplementary materials included in this article.