Abstract
Osteoporosis has been defined as a systemic skeletal disorder characterized by compromised bone strength predisposing to an increased risk of fracture. The clinical consequences of fracture include short- and long-term morbidity as well as increased mortality. Several authors have examined data from the Health Care Financing Administration and noted that fracture risk, particularly risk of hip fracture, is higher in whites than blacks in both sexes; the most recent published data reported an age-adjusted annual incidence rate for hip fracture of 10.1 and 4.1 per 1000 in white and black women, respectively, and 4.3 and 3.1 per 1000 in white and black men, respectively. Other analyses estimated the actuarial risk of hip fracture of persons age 65 by age 90 to be 16.3 and 5.3 percent in white and black women, respectively, and 5.5 and 2.6 percent in white and black men, respectively. This lower incidence of fractures among blacks has generally been explained by greater bone strength among blacks, although differences in non-skeletal risk factors for fracture, such as falls, cannot be completely excluded. Data from the Study of Osteoporotic Fractures (SOF) and the Baltimore Men's Osteoporosis Study (MOST) show that, in both sexes, blacks have higher adjusted bone mineral density than whites and a slower age-adjusted annual rate of decline in bone mineral density. Genetic, nutritional, lifestyle and hormonal factors may contribute to these ethnic/racial differences in bone strength.
Osteoporosis has been defined as a systemic skeletal disorder characterized by compromised bone strength predisposing to an increased risk of fracture (1). The clinical consequences of fracture include short- and long-term morbidity characterized by pain, limitation of function and decreased health-related quality of life as well as increased mortality. This presentation will first review racial differences in fracture risk by sex that provide evidence to support the hypothesis that blacks have stronger bones than whites and then present data from two longitudinal observational cohort studies that demonstrate that bone mineral density, an estimate of bone mass that is strongly correlated with bone strength, is higher in blacks than whites and that the rate of decline in bone mineral density is lower in blacks than whites.
Racial differences in fracture risk
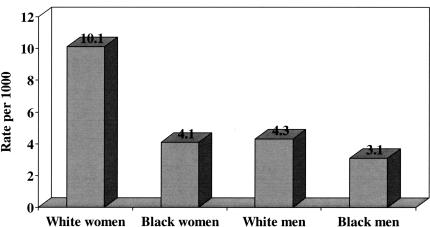
Several authors have examined administrative data and noted that fracture risk, particularly risk of hip fracture, is higher in whites than blacks in both sexes (2–5). In the largest study using administrative data, Jacobsen and colleagues examined data from the Health Care Financing Administration and Department on Veterans Affairs for some 44 million short-stay hospital discharges from 1984 through 1987 and identified all cases with a discharge diagnosis of hip fracture among persons aged 65 and above; cases were excluded if the fracture could have been attributed to a malignancy or the patient had evidence of a prior hip fracture in the preceding four years (2). In total, there were 745,435 hospitalizations for incident first hip fracture during the four-year period; 79 percent of these cases occurred in women and 93 percent occurred in whites. The age-adjusted annual incidence rate for hip fracture was 8.07 per 1000 and 3.06 per 1000 in white and black women, respectively, and was 4.28 and 2.38 in white and black men, respectively. In a more recent analysis of data from the Health Care Financing Administration limited to a 10 percent sample of Medicare enrollment records with inpatient claims for 1992 and 1993, Lauderdale and colleagues again noted differences of similar magnitude between whites and blacks in both sex groups: age-adjusted annual incidence rates for hip fracture were 10.1 and 4.1 per 1000 in white and black women, respectively, and 4.3 and 3.1 per 1000 in white and black men, respectively (Figure 1) (4).
Fig. 1.
Average annual age-adjusted incidence rates for hip fracture among whites and blacks, by sex, in the United States, 1992–1993.
Jacobsen and colleagues also estimated the incidence rate of symptomatic vertebral fractures using data from the Health Care Financing Administration (5). Based on a total of 151,986 discharges listing a diagnosis of vertebral fracture over a four-year period, average annual age-adjusted rates of vertebral fracture were higher for whites than blacks in both sex groups: 17.1 and 3.7 per 10000 in white and black women, respectively, and 9.9 and 2.5 per 10000 in white and black men, respectively.
Barrett and colleagues estimated the actuarial risk of fracture for each of the four race-sex groups using a 5 percent sample of Medicare data from 1986 through 1990; this analysis estimated the probability that a person of age 65 will have a fracture by age 90 taking into account his/her chance of death before reaching that age (5). Based on these models, the actuarial risk of hip fracture by age 90 was 16.3 and 5.3 percent in white and black women, respectively, and 5.5 and 2.6 percent in white and black men, respectively. Thus, by any of these analyses, there are consistent racial differences in hip fracture risk by sex. Furthermore, similar differences in actuarial risk of fractures at other sites were noted between white and black women; too few fractures occurred among older black men to allow valid estimates of actuarial risk and comparisons with estimated rates in white men (6).
Racial differences in mortality following fracture
Jacobsen and colleagues, using data from the Health Care Financing Administration (vide supra), calculated mortality rates of patients with first incident hip fracture between 1984 and 1987 (7). Mortality rates were higher in men than in women in both racial groups: 33.7 and 17.2 per 1000 in white men and women, respectively, and 33.5 and 22.9 per 1000 in black men and women, respectively. While mortality rates did not differ by race among men, they were higher in black than white women. These relative differences in mortality rates persisted even after stratifying by age at time of hip fracture and by number of comorbid medical conditions.
Racial differences in bone mineral density
Bone mineral density (BMD) is a valid and reliable estimate of bone mass and is strongly correlated with bone strength measured ex vivo. Low BMD is associated with an increased risk of fracture; indeed, for one standard deviation in femoral neck bone mineral density there is an approximate 2-fold increase in the age-adjusted risk of hip fracture (8,9). Because of the strong association between low BMD, particularly when measured at the hip by dual x-ray absorptiometry (DXA), and hip fracture, an expert panel of the World Health Organization proposed an operational definition of osteoporosis in white women as a BMD of 2.5 or more standard deviations below the mean for young white women aged 20 to 29 years (10,11). This definition has since been extended to apply to black women (using the normative data for young white women as the reference standard) and to white and black men (using the normative data for young white men as the reference standard) (www.iscd.org).
Data comparing both BMD and the prevalence of osteoporosis among the U.S. population were collected during the Third National Health and Nutrition Examination Survey (NHANES III); reference data were based on 409 white women and 382 white men between the ages of 20 and 29 years (12–14). Osteoporosis was present in 20 and 5 percent of white and black women aged 50 and above, respectively, based on DXA measurements at the femoral neck, and 17 and 8 percent of white and black women, respectively, based on DXA measurements at the total femur (this incorporates the regions of interest at the femoral neck, trochanter, intertrochanter and Ward's triangle) (13). The prevalence of osteoporosis in men aged 50 and above was 6 and 4 percent based on DXA measurements at the femoral neck and total femur, respectively; patterns of racial differences were similar to those in women, although estimates in black men were not considered statistically reliable because of small numbers of older black men studied.
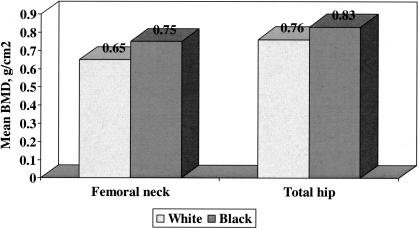
Racial differences in bone mineral density at the proximal femur in women were examined using data from the Study of Osteoporotic Fractures (15). The Study of Osteoporotic Fractures is a longitudinal observational cohort study that enrolled 9704 ambulatory white women aged 65 and above from 1986 to 1988 at four clinical centers in the U.S.: Baltimore, Pittsburgh, Minneapolis and Portland, Oregon (8). A sample of 622 black women aged 70 and above was added to the cohort at the time of the sixth biennial visit between 1996 and 1998. Cross-sectional comparison of bone mineral density at the femoral neck and total hip between 7334 white women and 636 black women showed significantly greater BMD at both sites among black women; these differences in BMD were on the order of one standard deviation (Figure 2).
Fig. 2.
Mean bone mineral density at the femoral neck and total hip among 7334 older white and 636 older black women enrolled in the Study of Osteoporotic Fractures. Standard deviations for femoral neck BMD among white and black women were 0.11 and 0.15 g/cm2, respectively, and for total hip BMD among white and black women were 0.13 and 0.15 g/cm2, respectively. Distributions were significantly different by race at each site with P < 0.01.
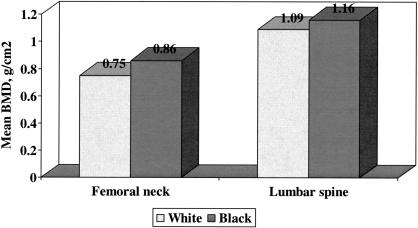
Racial differences in bone mineral density at the proximal femur and lumbar spine in men were examined using data from the Baltimore Men's Osteoporosis Study (16). This study was a longitudinal observational cohort study that enrolled 503 ambulatory white and 191 ambulatory black men from July 2000 to June 2001; men with either bilateral total hip replacements or who self-reported weight over 300 pounds were excluded. Bone mineral density was significantly greater at the femoral neck, lumbar spine and total body among black men even after adjusting for possible confounding variables (Figure 3). Again, differences in BMD between the racial groups were on the order of one standard deviation. Additional exploratory analyses showed that older black men had both narrower bone at the proximal femur and more bone mineral content; these features are independently associated with greater bone strength (17).
Fig. 3.
Mean bone mineral density at the femoral neck and lumbar spine among 503 older white and 191 older black men enrolled in the Baltimore Men's Osteoporosis Study. Standard deviations for femoral neck BMD among white and black men were 0.13 and 0.15 g/cm2, respectively, and for lumbar spine BMD among white and black men were 0.19 and 0.20 g/cm2, respectively. Distributions were significantly different by race at each site with P < 0.01.
Racial differences in change in bone mineral density
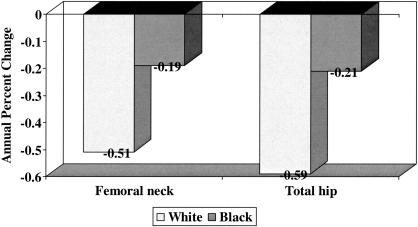
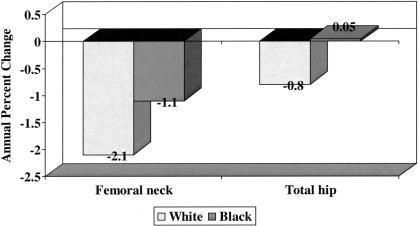
Numerous longitudinal studies conducted in older white men and women have reported a decline in bone mineral density with advancing age (18–20); however, until recently it was unclear whether the rate of change in bone mineral density was similar in older blacks and whites. Cauley and colleagues analyzed longitudinal data from the Study of Osteoporotic Fractures to test the hypothesis that the decline in BMD would be greater in older white than black women (21). They studied a sample of 6007 older white women who had BMD measured at the proximal femur at the second (1988–1990) and fourth (1992–1994) clinical examinations and a sample of 482 black women who had BMD measured at the proximal femur at the sixth (1996–1998) and seventh (1998–2000) clinical examinations. The average annual age-adjusted percent decline in BMD at the femoral neck and total hip was significantly greater in white than in black women (Figure 4); these differences persisted even after adjustment for additional confounding variables, including weight change between visits, height loss since age 25, current hormone therapy, current smoking, grip strength, diabetes, education, self-reported health status and use of diuretics. In addition, average annual percent decline in BMD increased with advancing age in both racial groups, although the relative increase was much greater in black than in white women when the groups of women were stratified at age 75. Current use of hormone therapy was associated with slower rates of bone loss in both racial groups; indeed, multiple-variable adjusted femoral neck BMD actually increased in black women who were current users of hormone therapy.
Fig. 4.
Average annual age-adjusted mean percent change in bone mineral among 6007 older white and 482 older black women enrolled in the Study of Osteoporotic Fractures. Distributions were significantly different by race at each site with P < 0.001.
Tracy and colleagues analyzed longitudinal data from the Baltimore Men's Osteoporosis Study to test the hypothesis that the decline in BMD is greater in older white than black men (22). They studied a sample of 349 older white men and 119 older black men who had BMD measured at the proximal femur and lumbar spine an average of 18.8 months apart. The average annual percent decline in BMD at the femoral neck and total hip was significantly greater in white than in black men (Figure 5); these differences persisted even after adjustment for age, weight, weight change between visits and current smoking. In addition, average annual percent decline in BMD increased with advancing age in both racial groups of men. Current smoking was associated with higher rates of bone loss in both racial groups, even after adjustment for age, height and weight change.
Fig. 5.
Average annual mean percent change in bone mineral among 349 older white and 119 older black men enrolled in the Baltimore Men's Osteoporosis Study. Distributions were significantly different by race at each site with P ≤ 0.01.
Low bone mineral density is associated with increased fracture risk in older blacks
Low bone mineral density is strongly associated with increased fracture risk in older white women (8.9). Cauley and colleagues examined the relationship between BMD measured by DXA and incident non-spine fractures in 636 older black women enrolled in the Study of Osteoporotic Fractures and compared the magnitude of the association to that in white women (15). Over a mean follow-up of 6.1 years, 58 black women sustained one or more non-spine fractures, including 12 hip or pelvis fractures, 12 leg, knee or ankle fractures, 8 rib fractures and 7 wrist fractures. The age-adjusted relative risk (95% confidence intervals) of non-spine fracture per one standard deviation decrease in BMD at the femoral neck and total hip in black women was 1.37 (1.08, 1.74) and 1.44 (1.12, 1.86), respectively; these relative risks were similar to those found among 7334 white women followed for a similar time period. Of interest, the relative risk of non-spine fracture in black compared to white women was 0.48 (0.36, 0.64) even after adjustment for age, femoral neck BMD and other confounding variables. Thus, while low BMD is associated with an increased risk of non-spine fracture in older black as well as white women, the absolute risk of non-spine fracture remains lower in older black than white women even after adjustment for differences in BMD. These results suggest that other factors related to bone strength may differ between the racial groups. The relationship between BMD and non-spine fracture in older black men is currently under examination using data from the Baltimore Men's Osteoporosis Study in combination with that from other longitudinal observational studies that have enrolled older black and white men.
Discussion
Osteoporosis is a serious public health problem, in large part because of the morbidity and mortality associated with fractures, particularly involving the hip and spine (1). Administrative data demonstrate that fracture risk is greater among whites than blacks in the United States. The lower incidence of fractures among blacks has generally been explained by greater bone strength among blacks, although differences in non-skeletal risk factors for fracture, such as falls, cannot be completely excluded.
Bone strength is determined by many factors including the mass and geometry of the bone, the microarchitecture of the trabecular bone, the porosity of the cortical bone, the composition of the bone matrix and mineral, and the accumulation of microdamage in the bone. Presently, bone mass is estimated in clinical practice and clinical research by measurement of bone mineral density; this represents a composite of the degree of mineralization of the matrix and the macroarchitecture of the bone. The accumulated data reviewed during this presentation suggest that American blacks have greater bone mineral density than whites and that this may account, at least in part, for their lower rate of fractures, particularly hip fractures.
Higher bone strength in blacks could be due to several factors including development of a stronger skeleton during childhood and adolescence, slower loss of bone during adulthood due to reduced rates of bone turnover and greater ability to replace lost bone due to better bone formation. Bell and colleagues reported that black children had higher bone mass than white children and that this difference persisted into young adulthood, at least in men (23,24). Development of a stronger skeleton during childhood and adolescence is dependent on the interaction of genetic and environmental factors, including nutrition and lifestyle factors (25).
Several studies utilizing histomorphometry of iliac crest bone biopsies have demonstrated that blacks have a lower rate of bone turnover than whites (26–28). This lower rate of bone turnover would likely translate into a slower rate of decline in bone mineral density. Genetic, nutritional, lifestyle and hormonal factors may contribute to differences in rates of bone turnover during adulthood, as can the presence of certain medical conditions and the use of certain medications that are recognized to be secondary causes of osteoporosis. Future studies in these cohorts are currently in progress to examine longitudinal changes in structural geometry and estimates of bone strength of the proximal femur derived from the DXA scans as well as to identify factors, including circulating levels of 25-hydroxyvitamin D and inflammatory markers, that might contribute to both rates of decline in bone mineral density and fracture risk.
Footnotes
Supported in part by grants from the Arthritis Foundation, Arthritis Foundation Maryland Chapter, Department of Veterans Affairs and National Institutes of Health (NIH-AR35584).
DISCUSSION
Martin: Boston: Marc, I wondered whether you have data on two confounding variables. One is body mass, that is weight, and the extent to which that impacts on bone metabolism and structure; and the second is level of exercise and physical activity?
Hochberg: Baltimore: Sure. The data on weight and height are available in both data sets and were used in the multiple variable adjusted models. On average, the African Americans were heavier than the Caucasians, even after age adjustment but didn't differ significantly in height. We used weight and height separately in the multiple variable models rather than using body mass index as the variable for adjustment. We also had data on physical activity. This was done through a modification of the Paffenbarger scale in order to estimate kilocalories expended per day, and we used that as well as an instrument called the PASE, the Physical Activity Scale for the Elderly, in our male study, and those variables were also included in the multiple variable models.
Thorner: Charlottesville: That was a beautiful study. Very interesting. As you did DXA, were you able to actually look at the amount of appendicular skeletal muscle between the Caucasians and the blacks and see whether that also could account for the difference?
Hochberg: We didn't actually look at muscle mass from the DXA image, but we have muscle strength measurements from both studies. We have both upper and lower extremity strength measurements, including grip strength as well as quadriceps strength, respectively, and there is a strong correlation between the upper and lower extremity strength measurements in these populations. We adjusted the multiple variable models as well for it. So, while there is a correlation between muscle strength and bone mineral density measured by DXA in all of the racial groups, the differences persist even when you adjust for that variable. We are actually measuring quadriceps muscle size as well as quality in another study that we are doing in subjects recovering from hip fracture using CT scans taken at the mid thigh in order to calculate both muscle bulk as well as muscle quality, which is measured in relationship to the amount of fat within the muscle.
Watts: Cincinnati: Thank you very much, Marc, for these interesting insights. The population is aging. So, the absolute number of fractures appears to be increasing, but there appears to be secular trends that age-adjusted hip fracture rates, for example, are going down, and while I realize that's not directly related to what you've presented, I wonder if you have any thoughts or insights about that.
Hochberg: I think some of this may be explained by the factors that are included within bone quality, while some may be related to the other non-skeletal risk factors for fracture in terms of fall risk. In terms of bone quality, which we don't really measure by DXA, there have been suggestions that the older population suffers from nutritional deprivation, which is less likely to have occurred in younger persons born after World War II; this might help explain improved bone quality through better nutrition during growth and development leading to a reduction in fracture rates, subsequently as that population ages. Then the other possible effects on non-skeletal issues include decreasing risk factors for fall, in terms of better attention made to protecting the house as well as to correction in vision and other sensory abnormalities.
REFERENCES
- 1.U.S. Department of Health and Human Services. Rockville, MD: U.S. Department of Health and Human Services; 2004. Bone Health and Osteoporosis: A Report of the Surgeon General. [Google Scholar]
- 2.Jacobsen SJ, Goldberg J, Miles TP, Brody JA, Stiers W, Rimm AA. Hip fracture incidence among the old and very old: a population-based study of 745,435 cases. Am J Public Health. 1990;80:871–3. doi: 10.2105/ajph.80.7.871. [DOI] [PMC free article] [PubMed] [Google Scholar]
- 3.Baron JA, Barrett J, Malenka D, Fisher E, Kniffin W, Bubolz T, et al. Racial differences in fracture risk. Epidemiology. 1994;5:42–7. doi: 10.1097/00001648-199401000-00008. [DOI] [PubMed] [Google Scholar]
- 4.Lauderdale DS, Jacobsen SJ, Furner SE, Levy PS, Brody JA, Goldberg J. Hip fracture incidence among elderly Hispanics. Am J Public Health. 1998;88:1245–7. doi: 10.2105/ajph.88.8.1245. [DOI] [PMC free article] [PubMed] [Google Scholar]
- 5.Jacobsen SJ, Cooper C, Gottlieb MS, Goldberg J, Yahnke DP, Melton LJ., 3rd Hospitalization with vertebral fracture among the aged: a national population-based study, 1986–1989. Epidemiology. 1992;3:515–8. doi: 10.1097/00001648-199211000-00009. [DOI] [PubMed] [Google Scholar]
- 6.Barrett JA, Baron JA, Karagas MR, Beach ML. Fracture risk in the U.S. Medicare population. J Clin Epidemiol. 1999;52:243–9. doi: 10.1016/s0895-4356(98)00167-x. [DOI] [PubMed] [Google Scholar]
- 7.Jacobsen SJ, Goldberg J, Miles TP, Brody JA, Stiers W, Bimm AA. Race and sex differences in mortality following fracture of the hip. Am J Public Health. 1992;82:1147–50. doi: 10.2105/ajph.82.8.1147. [DOI] [PMC free article] [PubMed] [Google Scholar]
- 8.Black DM, Cummings SR, Genant HK, Nevitt MC, Palermo L, Browner W. Axial and appendicular bone density predict fractures in older women. J Bone Miner Res. 1992;7:633–8. doi: 10.1002/jbmr.5650070607. [DOI] [PubMed] [Google Scholar]
- 9.Marshall D, Johnell O, Wedel H. Meta-analysis of how well measures of bone mineral density predict occurrence of osteoporotic fractures. Br Med J. 1996;312:1254–9. doi: 10.1136/bmj.312.7041.1254. [DOI] [PMC free article] [PubMed] [Google Scholar]
- 10.World Health Organization. Technical Report Series. Geneva: World Health Organization; 1994. Assessment of fracture risk and its application to screening for postmenopausal osteoporosis. [PubMed] [Google Scholar]
- 11.Kanis JA, Melton LJ, Christiansen C, Johnston CC, Khaltaev N. The diagnosis of osteoporosis. J Bone Miner Res. 1994;9:1137–41. doi: 10.1002/jbmr.5650090802. [DOI] [PubMed] [Google Scholar]
- 12.Looker AC, Johnston CC, Jr, Wahner HW, Dunn WL, Calvo MS, Harris TB, Heyse SP, Lindsay RL. Prevalence of low femoral bone density in older U.S. women from NHANES III. J Bone Miner Res. 1995;10:796–802. doi: 10.1002/jbmr.5650100517. [DOI] [PubMed] [Google Scholar]
- 13.Looker AC, Orwoll ES, Johnston CC, Jr, Lindsay RL, Wahner HW, Dunn WL, Calvo MS, Harris TB, Heyse SP. Prevalence of low femoral bone density in older U.S. adults from NHANES III. J Bone Miner Res. 1997;12:1761–8. doi: 10.1359/jbmr.1997.12.11.1761. [DOI] [PubMed] [Google Scholar]
- 14.Looker AC, Wahner HW, Dunn WL, Calvo MS, Harris TB, Heyse SP, Johnston CC, Jr, Lindsay R. Updated data on proximal femur bone mineral levels of US adults. Osteoporos Int. 1998;8:468–89. doi: 10.1007/s001980050093. [DOI] [PubMed] [Google Scholar]
- 15.Cauley JA, Lui L-Y, Ensrud KE, Zmuda JM, Stone KL, Hochberg MC, et al. Bone mineral density and the risk of incident nonspinal fractures in black and white women. JAMA. 2005;293:2102–8. doi: 10.1001/jama.293.17.2102. [DOI] [PubMed] [Google Scholar]
- 16.George A, Tracy JK, Meyer WA, Flores RH, Wilson PD, Hochberg MC. Racial differences in bone mineral density in older men. J Bone Miner Res. 2003;18:2238–44. doi: 10.1359/jbmr.2003.18.12.2238. [DOI] [PubMed] [Google Scholar]
- 17.Beck TJ, Ruff CB, Warden KE, Scott WW, Jr, Rao GU. Predicting femoral neck strength from bone mineral data: a structural approach. Invest Radiol. 1990;25:6–18. doi: 10.1097/00004424-199001000-00004. [DOI] [PubMed] [Google Scholar]
- 18.Jones G, Nguyen T, Sambrook P, Kelley PJ, Eisman JA. Progressive loss of bone in the femoral neck in elderly people: longitudinal findings from the Dubbo Osteoporosis Epidemiology Study. Br Med J. 1994;309:691–5. [PMC free article] [PubMed] [Google Scholar]
- 19.Ensrud KE, Palermo L, Black DM, et al. Hip and calcaneal bone loss increase with advancing age: longitudinal results from the Study of Osteoporotic Fractures. J Bone Miner Res. 1995;10:1778–87. doi: 10.1002/jbmr.5650101122. [DOI] [PubMed] [Google Scholar]
- 20.Hannan MT, Felson DT, Dawson-Hughers B, Tucker KL, Cupples LA, Wilson PW, et al. Risk factors for longitudinal bone loss in elderly men and women: The Framingham Osteoporosis Study. J Bone Miner Res. 2000;15:710–20. doi: 10.1359/jbmr.2000.15.4.710. [DOI] [PubMed] [Google Scholar]
- 21.Cauley JA, Lui L-Y, Stone KL, Hillier TA, Zmuda JM, Hochberg M, et al. Longitudinal study of changes in hip bone mineral density in Caucasian and African-American women. J Am Geriatr Soc. 2005;53:183–9. doi: 10.1111/j.1532-5415.2005.53101.x. [DOI] [PubMed] [Google Scholar]
- 22.Tracy JK, Meyer WA, Flores RH, Wilson PD, Hochberg MC. Racial differences in rate of decline in bone mass in older men: the Baltimore Men's Osteoporosis Study. J Bone Miner Res. 2005;20:1228–34. doi: 10.1359/JBMR.050310. [DOI] [PubMed] [Google Scholar]
- 23.Bell NH, Shary J, Stevens J, et al. Demonstration that bone mass is greater in black than white children. J Bone Miner Res. 1991;6:719–23. doi: 10.1002/jbmr.5650060709. [DOI] [PubMed] [Google Scholar]
- 24.Bell NH, Gordon L, Stevens J, Shary JR. Demonstration that bone mineral density of the lumbar spine, trochanter, and femoral neck is higher in Black than in White young men. Calcif Tissue Int. 1999;56:11–3. doi: 10.1007/BF00298737. [DOI] [PubMed] [Google Scholar]
- 25.Parfitt A. Genetic effects on bone mass and turnover: relevance to black/white differences. J Am Coll Nutrition. 1997;16:325–33. doi: 10.1080/07315724.1997.10718693. [DOI] [PubMed] [Google Scholar]
- 26.Weinstein RS, Bell NH. Diminished rates of bone formation in normal Black adults. N Engl J Med. 1988;319:1698–701. doi: 10.1056/NEJM198812293192603. [DOI] [PubMed] [Google Scholar]
- 27.Han Z-H, Palnitkar S, Sudhaker Rao D, et al. Effects of ethnicity and age at menopause on the remodeling and turnover of iliac bone: implications for mechanisms of bone loss. J Bone Miner Res. 1997;12:498–508. doi: 10.1359/jbmr.1997.12.4.498. [DOI] [PubMed] [Google Scholar]
- 28.Parfitt A, Han Z-H, Palnitkar S, et al. Effects of ethnicity and age at menopause on osteoblast function, bone mineralization, and osteoid accumulation in iliac bone. J Bone Miner Res. 1997;12:1864–73. doi: 10.1359/jbmr.1997.12.11.1864. [DOI] [PubMed] [Google Scholar]


