

Abstract
Expression of the gene for the macrophage colony stimulating factor receptor (CSF-1R), c-fms, has been viewed as a hallmark of the commitment of multipotent precursor cells to macrophages. Lineage-restricted expression of the gene is controlled by conserved elements in the proximal promoter and within the first intron. To investigate the developmental regulation of c-fms at the level of chromatin structure, we developed an in vitro system to examine the maturation of multipotent myeloid precursor cells into mature macrophages. The dynamics of chromatin fine structure alterations and transcription factor occupancy at the c-fms promoter and intronic enhancer was examined by in vivo DMS and UV-footprinting. We show that the c-fms gene is already transcribed at low levels in early myeloid precursors on which no CSF-1R surface expression can be detected. At this stage of myelopoiesis, the formation of transcription factor complexes on the promoter was complete. By contrast, occupancy of the enhancer was acutely regulated during macrophage differentiation. Our data show that cell-intrinsic differentiation decisions at the c-fms locus precede the appearance of c-fms on the cell surface. They also suggest that complex lineage-specific enhancers such as the c-fms intronic enhancer regulate local chromatin structure through the coordinated assembly and disassembly of distinct transcription factor complexes.
Keywords: CSF-1 receptor, chromatin, in vivo footprinting, myeloid progenitor cells, macrophage differentiation
The decision for a multi- or pluripotent progenitor cell to develop into a single lineage involves the assembly of key regulatory genes into transcriptionally active chromatin structures, and coordinate inactivation of genes involved in alternative cellular fates. An understanding of the process of chromatin assembly and remodeling must therefore underlie any comprehensive model of cell lineage commitment. The hematopoietic system has great advantages as a general model for study of the epigenetic basis of developmental processes, because differentiation can, to a significant extent, be recapitulated in cell culture. Hematopoietic cells arise from pluripotent stem cells of the bone marrow and develop via different types of precursor cells, which become progressively committed to the different branches of the blood cell system. As a model for cell fate decisions within the hematopoietic system, macrophage development represents a particularly interesting differentiation pathway.
Mononuclear phagocytes are a family of cells comprising bone marrow progenitors, blood monocytes, and tissue macrophages (for review, see Gordon et al. 1992). Despite their extensive heterogeneity, expression of the c-fms (Macrophage-Colony-Stimulating-factor [CSF-1] receptor) gene is common to all macrophages. CSF-1 is required for macrophage survival in vitro and in vivo (Roth and Stanley 1992; Dai et al. 2002). C-fms mRNA is expressed constitutively in placental trophoblasts and mononuclear phagocytes. It is detectable in the earliest yolk-sac phagocytes formed during mouse development and expression is maintained in all macrophages throughout adult life (Lichanska et al. 1999). Transcription of c-fms in human trophoblasts and macrophages initiates from two different promoters separated by a 25-kb intron. Exon 1 is transcribed only in trophoblasts, whereas exon 2 is the first exon of transcripts made in macrophages (Visvader and Verma 1989; Roberts et al. 1992). In mice, the promoter architecture is different, and trophoblast transcription initiation occurs at several sites within 1 kb upstream of the macrophage initiation site, generating multiple alternatively-spliced noncoding exons (R.T. Sasmono, D. Oceandy, J.W. Pollard, W. Tong, P. Low, R. Thomas, P. Pauli, M.C. Ostrouski, S.R. Himes, and D.A. Hume, in prep.). Despite the distinction, it remains appropriate to call the first coding exon, exon 2 in both species.
Transcription of the mouse fms gene in macrophages has been studied in some detail. The proximal promoter contains multiple purine-rich elements that bind the macrophage-restricted transcription factor PU.1 and other members of the Ets transcription factor family (Ross et al. 1998; Rehli et al. 1999). We have shown recently that a highly conserved element of the first downstream intron of the gene, referred to as the Fms intronic regulatory element (FIRE) cooperates with the proximal promoter to generate appropriate expression of the gene in stably transfected cells (Himes et al. 2001) and in transgenic mice (R.T. Sasmono, D. Oceandy, J.W. Pollard, W. Tong, P. Low, R. Thomas, P. Pauli, M.C. Ostrouski, S.R. Himes, and D.A. Hume, in prep.). Because CSF-1 is an important growth factor for macrophages in vivo, the activation of the c-fms gene locus has been viewed as a key event in the commitment of multipotent precursor cells to a macrophage-restricted differentiation phenotype. However, committed macrophage progenitor cells that lack CSF-1 receptor on their surface have been described in mouse bone marrow (Sudo et al. 1995), indicating that cell intrinsic differentiation decisions occur prior to the appearance of c-fms on the cell surface.
Only recently has the regulation of cell fate decisions at the epigenetic level been examined. Experiments from several laboratories including our own demonstrated that lineage-restricted genes in immature precursors could exist in a potentiated chromatin state (Bossard and Zaret 1998; Kramer et al. 1998; Kontaraki et al. 2000). The existence of this state may underlie the observations that precursor cells can exhibit promiscuous expression of lineage specific markers and regulator genes (Hu et al. 1997; Enver and Greaves 1998; Nutt et al. 1999). Early chromatin reorganization probably sets the stage for the formation of stable transcription factor complexes at later developmental stages that drive transcription. Once assembled, transcription factor complexes on individual cis-regulatory elements can consist of different sets of transcription factors, depending on the developmental state (Gualdi et al. 1996; Roque et al. 1996; Bossard and Zaret 1998). Within the hematopoietic system, a few experiments have correlated transcription factor occupancy at specific genes with a fixed differentiation state of primary cells (Shaffer et al. 1997; Hernandez-Munain et al. 1998, 1999), but none has described the dynamics of transcription factor assembly and chromatin fine structure alterations at a given gene throughout extended stages of cell differentiation.
In this report we describe the assembly of stable transcription factor complexes on c-fms cis-regulatory elements (promoter and FIRE) during the differentiation of primary early myeloid precursor cells into activated macrophages in vitro using in vivo DMS and UV-photofootprinting. We show that the c-fms gene is already transcribed in early myeloid precursors that lack detectable CSF-1 receptor on their surface and that low level transcription is associated with complete transcription factor complex assembly on the c-fms promoter. Subsequently complex alterations in transcription factor occupancy accompany terminal differentiation and activation. Our data suggest that CSF-1 acts on cells in which the c-fms gene has been already assembled into active chromatin. CSF-1 stimulates the growth of these cells, which further modulate their chromatin state to direct terminal differentiation.
Results
Extended regions of chromatin around the c-fms proximal promoter and intronic enhancer become accessible specifically in macrophages
To obtain insight into the regulation of the murine c-fms locus at the level of chromatin structure, we have previously mapped the position of macrophage-specific DNaseI hypersensitive chromatin sites (DHSs) over a 15-kb region upstream and downstream of the c-fms proximal promoter (Himes et al. 2001; Fig. 1A). We detected three macrophage specific regions of DNaseI hypersensitivity, all of which coincide with DNA sequences that are highly conserved between mouse and man. Two DHS were present in the second intron, one very strong site is an enhancer that is absolutely required to activate c-fms reporter constructs stably integrated into chromatin (Himes et al. 2001; R.T. Sasmono, D. Oceandy, J.W. Pollard, W. Tong, P. Low, R. Thomas, P. Pauli, M.C. Ostrouski, S.R. Himes, and D.A. Hume, in prep.). This element, the FIRE, is a 300-bp region that is more highly conserved between mouse and human that the c-fms coding sequence. To complement and extend these experiments, we determined chromatin accessibility at the proximal promoter (Fig. 1B) and downstream sequences (Fig. 1A) by partial digestion with different restriction enzymes in fibroblasts and macrophages that lack or express c-fms mRNA, respectively. The data revealed extended regions of chromatin that become accessible to restriction enzyme digestion in macrophages, 400-bp of chromatin flanking the promoter and >2 kb around the downstream DHSs. This may reflect the fact that the c-fms proximal promoter is a GC-rich TATA-less promoter with a large number of scattered transcriptional start sites. The DNA in the first intron represents DNA that is actively transcribed and thus is accessible to RNA-PolII action. Interestingly, some restriction sites were also weakly accessible in fibroblasts, which may represent sites localized in nucleosomal linker regions. Taken together, our data extend the earlier evidence (Himes et al. 2001) of extensive chromatin remodeling events at the c-fms locus in macrophages.
Figure 1.

Chromatin structure of mouse c-fms locus regulatory regions around the proximal promoter. (A) DNaseI hypersensitive sites (DHSs) represented as black arrows and restriction enzyme accessible sites (ovals) downstream of the PstI site at +310 (relative to the ATG). Southern blot analysis was performed on PstI-digested genomic DNA prepared from fibroblasts and macrophages that were treated with 50U and 100U of XbaI, HinfI, PvuII, SspI, and XmnI. A PvuII (+496)–BamHI (+850) probe was used as indicated (hatched box). (B) Restriction enzyme accessible sites upstream of the BamHI site (+849). One hundred units of restriction enzymes (HinfI, BanII, HindIII, and EcoRI) were used and BamHI was used for complete digestion of genomic DNA for Southern blot analysis. The blot was probed with the PvuII (+496) to BamHI (+849) fragment (hatched box). Bands resulting from cleavage are indicated by open (weak accessibility) and closed (high accessibility) ovals. Black boxes show the second and third exons.
The establishment of a differentiation system for macrophages from purified mouse bone marrow precursor cells suitable for chromatin fine structure studies
Although chromatin studies at the resolution of Southern blotting can give detailed insight into the position of cell-type and cell-stage specific cis-regulatory elements, they are neither sufficiently sensitive nor of high enough resolution to explain the molecular details of transcription factor occupancy and chromatin fine structure changes during cell differentiation. We therefore set out to establish a purification strategy for defined macrophage precursors that could be differentiated in vitro and that would produce sufficient cell numbers for PCR-based chromatin structure analysis methods. Progenitor cells with high proliferative potential require combined treatment with CSF-1 and other factors, such as Interleukins 3 (IL-3) and 1 (IL-1), to undergo rapid expansion (Bartelmez et al. 1989; Breen et al. 1990).
We aimed at isolating sufficient numbers of the earliest cells with myeloid characteristics that were able to respond to growth stimulation by IL-3 and CSF-1. In the scheme outlined in Figure 2A, these cells resemble common myeloid precursors (CMPs). Figure 2B describes the purification strategy in which we first remove all mature cells by depletion of lineage marker positive cells using magnetic beads. In the antibody cocktail we included several macrophage specific markers (Mac1 and F/480) and used CD19 to remove B-cells, as early macrophage precursors may be B220 positive (Slieker et al. 1993). The resulting lineage negative cells were stained with αc-kit, ER-MP12 and ER-MP20 antibodies. αc-kit antibodies recognize all hematopoietic stem cells, ER-MP12 is a marker for morphologically undifferentiated myeloid blast cells, whereas ER-MP20 recognizes committed macrophage precursors (late CFU-M) and monocytes (DeBruijn et al. 1994). We purified blast cells in the ER-MP12hi/c-kithi/ER-MP20− fraction as well as remaining ER-MP20−/c-kithi cells that express no or only low levels of ER-MP12. Colony forming ability was assessed in a mixed colony assay that contained myeloid growth factors, stem cell factor and EPO (Fig. 2C). Both cell populations contained precursor cells; however, the highest proportion of clonogenic precursors was present in the ER-MP12hi/c-kithi population. Neither population contained any IL-7 dependent B-cell precursors, but both were able to form all myeloid cell types (granulocytes, monocytes/macrophages, mast cells and erythrocytes; Fig. 2D, lower panel). From the colony assay it seemed that the ER-MP12−/c-kithi population was less pure, but contained a higher proportion of more primitive precursor population (CFU-mix) as compared to the ER-MP12hi/c-kithi/ER-MP20− population (Fig. 2D), whereas CFU–GM colony forming ability was similar. This is consistent with the finding that hematopoietic stem cells express low levels of ER-MP12 (van der Loo et al. 1995).
Figure 2.

Precursor purification strategy. (A) Hematopoietic differentiation, from long-term stem cells to activated macrophage in adult mice, including marker gene expression as outlined in Akashi et al. (2000). Large, bold letters indicate high level expression. Small, plain letters indicate low level expression. (B) Experimental strategy for precursor purification and in vitro differentiation. The FACS profile shows the c-kit and ER-MP12 expression pattern on ER-MP20 negative cells. (C) Colony assay performed on sorted cells (c-kithigh/ER-MP12high or c-kithigh/ER-MP12−). Data are the average and the standard deviation of two independent experiments. (D) Colony morphology of CFU-GM and CFU-mix (upper panel) and May-Grünwald Giemsa staining of cells picked from CFU-mix colony (lower panel). Monocytes, neutrophils, erythroid cells, and mast cells can be seen.
We next subjected our purified precursor populations to in vitro macrophage differentiation conditions in a medium containing IL-1, IL-3, and CSF-1 as described in Jägle et al. (1997). Cell morphology and surface marker expression of differentiating cells are depicted in Figure 3. ER-MP12hi/c-kithi/ER-MP20− cells did not express lineage markers (Fig. 3D) and displayed a homogenous blast like morphology (Fig. 3F) with a characteristic forward scatter/sideward scatter (FSC/SCC) profile (Fig. 3A). During differentiation this profile progressively shifted towards the heterogeneous pattern seen with mature monocytes/macrophages (Fig. 3A).
Figure 3.

Expression of cell surface antigen and morphological characterisation of purified and differentiated cells. Purified precursor cells and in vitro differentiated cells were analyzed at the indicated time points according to their size and granulation (A), expression of ER-MP12/ER-MP20 (B), c-kit (C), lineage markers (D), and M-CSF (CSF-1) receptor (E) on their surface by flow cytometry. (F) Morphology of differentiating cells as examined by May-Grünwald Giemsa staining of cytospins. Control antibody staining is indicated in E as non-gray profile.
Only the ER-MP12hi/c-kithi/ER-MP20−population (Fig. 3F) was capable of immediately responding to our growth factor conditions. The first dividing blast cells were seen as early as day 1 with only a limited amount of apoptosis being apparent in the cultures (∼30% of the cells), and after day 2 the culture only contained rapidly growing nonadherent myeloid blasts cells (Fig. 3F). The cells rapidly lost the c-kit staining that was initially present during precursor purification (Fig. 3C). After day 4 the first adherent monocytes were apparent (Fig. 3F). By day 7 pure adherent monocyte/macrophage cultures were formed (Fig. 3F) that could be further stimulated by the addition of LPS and γ-Interferon. During macrophage differentiation, expression of ER-MP12 in the entire cell population decreased and ER-MP20 expression increased as expected (DeBruijn et al. 1994), whereby mature macrophages did not express either marker (Fig. 3B).
The different types of hematopoietic precursors can not only be characterized by their surface marker expression, but also by the expression of transcription factors and marker genes specific for a defined differentiation state (Akashi et al. 2000). We therefore conducted an extensive RT–PCR experiment examining the expression levels of a number of such genes in both purified precursor populations (Fig. 4, ER-MP12−/c-kithi, ER-MP12hi/c-kithi) and the cells from different time points during the in vitro differentiation culture. Both precursor populations expressed mRNA encoding c-myb, GATA-1, GATA-2, and myeloid-associated factors such as PU.1, AML1, C/EBPα, and C/EBPβ (Tenen et al. 1997). The expression of both C/EBPα and C/EBPβ mRNA was up-regulated during the early stages of macrophage differentiation, whereas c-myb, GATA-1, GATA-2, were down-regulated. AML1 and PU.1 mRNA levels declined slightly in mature macrophages. Mouse lysozyme is highly expressed in macrophages and granulocytes and is switched on at the CFU-GM stage (Jägle et al. 1997). No expression of this gene was detected in purified precursors and it was first detected at a low level at day 2, confirming that we have indeed purified multipotent myeloid progenitor cells. The inducible nitric oxide synthase (iNOS) gene, a marker for mature, activated macrophages (Alley et al. 1995) was not expressed in any of the precursor populations. As expected, expression of iNOS required treatment of the cells with LPS/γ-Interferon.
Figure 4.
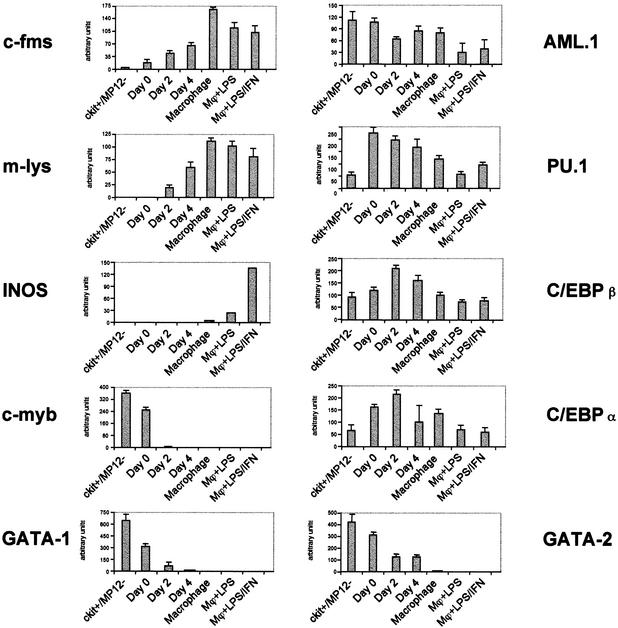
Marker gene and transcription factor gene expression. RT–PCR was performed on the total RNA prepared from purified precursor and differentiated cells as described in Materials and Methods. Arbitrary units were calculated after determining the fluorescent intensity of DNA stained with ethidium bromide using the Molecular Imager FX system. The bars represent the mean value of two independent amplifications normalized to GAPDH intensity.
The comparison of their colony forming ability, cell surface marker, and marker gene expression characteristics with what was described previously for the common myeloid progenitor cell (Akashi et al. 2000; Fig. 2A) indicates that the ER-MP12hi/c-kithi/ER-MP20− population represents a similar multipotent myeloid precursor population. This cell population, which we are using as a starting population for our in vivo footprinting assays (1) has no B-lymphoid potential, (2) represents an earlier myeloid differentiation stage than CFU-GM, and (3) within the limits of our assay system, is not contaminated with mature cells.
ER-MP12hi/c-kithi/ER-MP20− cells do not display measurable CSF-1 receptor protein on their surface but express low levels of c-fms mRNA
The expression of c-fms in the macrophage differentiation system was assessed by flow cytometry using an anti-c-fms antibody (Sudo et al. 1995; Fig. 3E). No cells expressing the surface receptor could be detected in the initial purified ER-MP12hi/c-kithi/ER-MP20− (day 0). After day 2 of in vitro differentiation, CSF-1 receptor was detected at a low level on most cells. The cell population homogeneously shifted to higher expression levels at day 3 and reached a plateau at day 4. In late monocytes and adherent macrophages, the level of CSF-1 receptor protein started to decrease. The up- and down-regulation of CSF-1 receptor expression was consistent with the mRNA levels in the population (Fig. 4, upper left panel). With the more sensitive RT–PCR, a low level of c-fms mRNA was detectable in both populations of purified precursors at day 0. C-fms messenger RNA levels in differentiating cells increased with time reaching their highest levels in day 7 monocytes/macrophages. Treatment of these cells with LPS and LPS/γ-Interferon that was sufficient to induce iNOS expression, down-regulated c-fms mRNA levels, as it was shown previously by nuclear run-on assays (Gusella et al. 1990) and studies of mRNA elongation (Yue et al. 1993).
Taken together, our experiments show that differentiating cells undergo a defined order of morphological, gene expression, and surface marker expression alterations.
The c-fms promoter is occupied in c-fms low-expressing precursor cells and maintains the same chromatin fine structure throughout macrophage differentiation
The experiments described above demonstrated that in our in vitro macrophage differentiation system the c-fms gene is synchronously activated in a cell population of sufficient size for chromatin assembly studies. We therefore set out to examine changes in transcription factor occupancy on c-fms cis-regulatory elements during macrophage in vitro differentiation. To obtain this information we used the in vivo footprint methods described by Kontaraki et al. (2000), which depend on the fact that transcription factors and chromatin structure affects the reactivity of DNA with dimethyl sulfate (DMS) or UV, both of which can be applied to intact cells. After in vivo formation of alkylated or dimerized bases, the position of these lesions is determined at nucleotide resolution by use of LM-PCR or a related technique (TD-PCR; see Chen et al. 2001).
The pattern of reactivity with DMS for several cell types and enriched fractions is shown in Figure 5A. This type of data was used to determine the in vivo transcription factor occupancy of the c-fms proximal promoter, and the results are summarized in Figure 5B,D. Three purine-rich ets binding sites and a C/EBP site described previously (Yue et al. 1993; Reddy et al. 1994; Ross et al. 1998; Xie et al. 2002) were found to be occupied in vivo, as evidenced by changed reactivity to DMS relative to naked DNA and control cells.
Figure 5.


In vivo genomic footprinting of the c-fms promoter by LM–PCR and TD–PCR. (A) In vivo transcription factor occupancy of the mouse c-fms promoter region in purified precursor and in vitro differentiated cells by DMS footprinting. From left to right: DMS-treated naked DNA (G); embryonic fibroblast (EF); bone marrow cell fractions Lin−/c-kit+/ERMP12− (ckit+MP12−) and Lin−/c-kit+/ERMP12+ (d0); and in vitro differentiated cells (d2, d4, d7, d7+LPS). Primer set Prom01–03 was used to analyze upper strand of c-fms promoter region (Materials and Methods). Hyperreactive G(N7) contacts are indicated by closed circles on the right of each lane and protected Gs are indicated by open circles. The different transcription start sites are indicated by arrows on the left. The number on the right indicates the nucleotide position relative to the ATG, according to the published sequence. Protein binding sites are indicated on the right as a line. (B) Quantified and normalized band intensity of the DMS methylated Gs of the PU.1 binding site in the promoter. The LM-PCR products were labeled as described (Kontaraki et al. 2000) with IRD700 fluorescent dye-labeled primer and a LICOR DNA sequencer used to separate the fragments and provide quantitative, digitized data. To compensate the variation of sample loading, the band intensity on each lane was normalized by total lane intensity. Each bar shows the band intensity of Gs at the PU.1 binding site. (C) UV-photofootprinting analysis of the c-fms promoter. Naked DNA (DNA) or living cells (EF, ckit+MP12−, d0, d2, d3, d4, d7, d7+LPS) were irradiated with UV, and UV dimer formation was detected by TD–PCR (Kontaraki et al. 2000). The primer set used was the same as used for LM–PCR in A. (M) Size marker. Open circles on the right of each lane indicate diminished UV dimer formation compared with naked DNA. Gray circles mark chromatin fine structure changes specific for LPS treated macrophages (D) Summary of transcription factor binding sites occupied in vivo. Transcription factor binding sites and G(N7) contacts are indicated and transcription start sites are shown as arrows. The numbers are nucleotide position relative to the ATG.
Two results are noteworthy. At day 0 in ER-MP12hi/c-kithi/ER-MP20− cells, there was apparent complete occupancy of the PU.1 sites at −103 bp, −130 bp, and −173 bp (relative to the ATG) as well as DMS-hyperreactivity of the C/EBP site at −161 bp. To perform accurate quantification and normalization of the bands, samples were labeled with fluorescent primers and were analyzed and quantified on a LiCOR sequencer as described in Kontaraki et al. (2000). This analysis confirmed high occupancy of the c-fms proximal promoter region in myeloid precursors. An example for such an analysis examining the −130 bp PU.1 site is depicted in Figure 5B. Weak DMS hyper-reactivity at the −130 bp PU.1 site was also detected in the ckit+/ER-MP12− precursor population, indicating that the low level of expression in this population may originate from a few contaminating c-fms expressing cells. It is also apparent that ongoing transcription starting from the clustered transcription start sites downstream of the PU.1 site at−130 bp correlates with a significant change in DMS accessibility at a number of G-residues in this area, but the accessibility is not affected by the level of transcription.
DMS in vivo footprinting gives valuable information about the binding of transcription factors in living cells, but relatively little information about chromatin structure, as nucleosomes do not affect DMS reactivity. We recently developed a novel highly sensitive UV-photofootprinting technique that detects changes in DNA fine structure generated by DNA-protein interaction (Komura and Riggs 1998; Chen et al. 2001) and is based on the differential formation of UV-dimers. We applied this technique to the cell populations described above. The result is depicted in Figure 5C. As with DMS in vivo footprinting, a number of chromatin fine structure differences downstream of the −103 PU.1 site were detectable in c-fms-expressing cells when compared to fibroblasts and ER-MP12−/c-kithi/ER-MP20− cells. Interestingly, although transcription factor occupancy was different, the chromatin structure around the PU.1/C/EBP binding site at −176 bp, which is upstream of the area where mRNA initiation occurs, was highly similar between ER-MP12−/c-kithi/ER-MP20− cells and ER-MP12hi/c-kithi/ER-MP20− cells, but differed from that of fibroblasts. The UV-dimer pattern of the latter resembled what was obtained with naked DNA. Changes caused by LPS treatment are also apparent and will be discussed in a later section.
Transcription factors binding to FIRE
As noted above, FIRE plays a crucial role in the regulation of c-fms expression. FIRE contains numerous candidate elements within a remarkably conserved 300-bp region comprising an almost continuous array of apparent consensus elements that might bind myeloid-specific factors such as PU.1/ets, C/EBP, and AML1 (Himes et al. 2001; Fig. 6C). However, whether these proteins actually bind to these sites had not been examined previously. We determined transcription factor occupancy of FIRE by in vivo DMS-footprinting in the cell populations described above. The results are depicted in Figure 6. The 5′ part of FIRE is characterized by two SP1/3 sites that both extensively overlap with PU.1/ets consensus sequences (promoter proximal and distal SP1/3/ets clusters). Both clusters were occupied in day 7 macrophages. Our in vivo footprinting experiments in addition provide evidence for occupancy of at least one of two AML1 sites (AML1[2]) in the FIRE element. Whether AML1 site 1 (Fig. 6C) was occupied by AML1 in vivo was difficult to decide, due to an extensive overlap with ets and SP1/3 consensus sequences that both share the same potential G(N7) contacts. Further downstream, two PU.1 sites that partially overlap were occupied in vivo. 3′ of these an ets binding site and a C/EBP site were occupied, as well as binding sites for a number of unknown factors. One of these unknown factors (FBF1, see below) bound at the 3′ end of FIRE with a footprint over the sequence ggggggtttga. No matrix for known transcription factor binding to this site could be identified.
Figure 6.

In vivo transcription factor occupancy of FIRE in purified precursor and differentiated cells. DMS in vivo footprinting analyses for upper strand (A) and lower strand (B) of FIRE were performed on purified precursors and differentiated cells as described in Fig. 5A. Primer sets GB04–06 and GB01–03 were used to analyze upper and lower strands. For all other symbols see legend of Fig. 5. Only alterations in band intensity of at least twofold were considered to be significant as determined by the quantification of LM-PCR products run on a LICOR sequencer as depicted in Fig. 7. (C) Summary of the transcription factor assembly on the FIRE. Transcription factor binding sites are indicated as boxes, and thick bars between upper and lower strands represent the nucleotide positions that are conserved between mouse and human.
To validate the footprinting data and to confirm that macrophages express nuclear proteins that bind these elements, electrophoretic mobility shift assays (EMSA) were performed with nuclear extract from bone marrow derived macrophages (BMM) (Fig. 8, see below). Protein binding from MOP31C B lymphoblasts were also analyzed to perform an initial evaluation whether any complexes displayed myeloid specificity. An Sp1 protein complex was observed on an oligonucleotide containing the distal Sp1 consensus element of FIRE, as determined by supershift assay with Sp1 specific antibody (Fig. 8A). A more extended oligo was also recognized by a factor binding to the ets site (data not shown). Similar Sp1 binding/antibody supershift and ets binding was observed on an oligonucleotide which contained the identical proximal FIRE Sp1 element (data not shown). The novel element within FIRE bound a factor with myeloid specificity as it showed no detectable protein binding in the lymphocyte cell lines (Fig. 8B). We refer to this complex as FBF1 (FIRE-binding-factor 1). EMSAs examining binding of the ubiquitously expressed oct1 factor demonstrated a comparable quality of the extracts (Fig. 8B, lower panel).
Figure 8.

Analysis of DNA–protein interactions in vitro. Protein binding assays were performed with nuclear extracts (NE) from MOP31C B cells (B) or bone marrow-derived macrophages (M). (A) Protein binding to the consensus Sp1 element in the FIRE enhancer. The Sp1 protein/DNA complex and supershifted complex with Sp1 specific antibody (Sp1SS) are marked. (B) Protein binding to a novel DNA element, within the FIRE enhancer, showing myeloid specificity (FBF1). Assays were performed with the nuclear extracts described in A. (Lower panel) Control for the different extracts using an oct consensus oligo. The upper, stronger band is generated by oct1, the lower band by oct2. (C) Protein binding assays were performed on one of the consensus AML-1 sites within the FIRE enhancer. Assays were performed with the nuclear extracts described in A. (D) Distinct protein–DNA complexes forming on the FIRE AML element (FAML) were compared to those forming on the previously characterized MMLV LTR binding site (VAML). Nuclear extracts from BMM were used in the assays (M). The ability of each element to cross-compete for protein binding was also assessed by addition of excess unlabeled oligonucleotide (comp.). The AML/CBF related protein binding is marked.
Both AML1 sites in FIRE showed binding of multiple protein complexes of identical mobility to those binding the previously characterized AML1 binding site within the Molony murine leukemia virus enhancer (MMLV) (Wang and Speck 1992; Fig. 8C,D; data not shown). There is no sequence homology outside of the core consensus TGTGGT present in the FIRE and MMLV sites. All protein complexes appeared to be related to the AML/CBFβ core binding factor proteins because the FIRE AML site and the MMLV AML site could cross-compete for protein binding.
Dynamic alterations in transcription factor occupancy at FIRE during myeloid precursor maturation
In contrast to the promoter, the assembly of the different transcription factor complexes at FIRE was differentially regulated. The factor binding sites at FIRE appeared to be only partly occupied in day 0 myeloid precursor cells (Fig. 6). In addition, a number of individual binding sites such as the proximal SP1 and ets sites, the AP2 and the FBF1 site were bound in ER-MP12−/c-kithi/ER-MP20− cells, whereas other binding sites such as the distal SP1 site were not occupied. During myeloid precursor maturation, the factor complexes on a subset of binding sites such as the PU.1 (2), C/EBP, AP2, ets, FBF1 sites, some unknown factors and the proximal SP1/ets cluster were coordinately assembled and disassembled. An initial up-regulation was followed by a down-regulation at day 7. This result was highly reproducible and could be confirmed by the quantification of normalized bands (Fig. 7). Interestingly, not all factor-binding sites were bound with the same kinetics. The quantification of bands also revealed that the proximal SP1/ets cluster (Fig. 7C), the PU.1 (1) site at +2781 (Fig. 7B), and the distal SP1 cluster at +2718 (data not shown) stay occupied in day 7 macrophages.
Figure 7.

Developmental change of transcription factor assembly on the FIRE. To quantify the individual bands accurately, LM–PCR products were labeled with IRD700 and analyzed by use of a LICOR sequencer. Band intensities were quantified and normalized as described in Fig. 5B. (A) Guanine residues between +2849 and +2862 containing FBF and C/EBP binding sites (upper strand). (B) Guanine residues between nucleotide positions +2775 and +2791 including two PU.1 binding sites (lower strand). (C) Guanine residues between +2717 and +2730 (B) including a cluster of binding sites, ets, SP1/3, and AML-1 (lower strand).
Distinct changes in transcription factor occupancy and chromatin fine structure at c-fms cis-regulatory elements after LPS stimulation
To examine further the relationship between chromatin fine structure/site occupancy and c-fms transcription we examined the effect of LPS on macrophages differentiated from purified precursors. LPS treated macrophages cease to grow and undergo a number of functional and morphological changes (for review, see Sweet and Hume 1996). LPS promotes macrophage activation and causes down-regulation of c-fms expression at the transcriptional level (Gusella et al. 1990; Yue et al. 1993).
In the promoter, the down-regulation of c-fms expression after LPS treatment is associated with a reduction in occupancy for all promoter-bound transcription factors as exemplified by a weaker DMS hyper-reactivity at the PU.1 site at −130 bp (Fig. 5B, top panel). This result was confirmed by UV-photofootprinting. DNA prepared from LPS treated cells showed a number of quantitative and qualitative changes in UV-dimer formation frequency as compared to untreated cells and precursors (indicated as gray circles in Fig. 5C). The effect of LPS was complex. Chromatin structure around the transcriptional start sites seemed to revert to the inactive pattern seen in fibroblasts but in other regions it was unchanged (upstream of −161 bp, see above) or a new pattern was observed that differed from that observed with fibroblasts (downstream of −57 bp).
At FIRE, LPS treatment led to a further reduction in binding of the factors already reduced in binding at day 7 of differentiation (Figs. 6, 7, top panel). In contrast to the promoter and as noticed above, also after LPS stimulation a subset of sites, the PU.1 (1) site and the distal SP1 cluster, stayed completely occupied. We observed no further changes in transcription factor composition of the FIRE enhancer complex.
Discussion
Multipotent progenitor cells display no measurable CSF-1 receptor on the surface but express a low level of c-fms mRNA
One goal of this study was to establish an in vitro differentiation system for macrophages, and then use it to study the dynamics of transcription factor assembly and chromatin fine structure alterations on genes specifically expressed by macrophages. We succeeded in purifying a homogeneous population of early multipotent myeloid precursor cells. This was indicated by the combination of growth factor responsiveness, surface marker expression, colony forming ability, and gene expression profile of our purified cell populations. We detected low levels of c-fms mRNA in the purified progenitors. Although we were unable to detect any CSF-1 receptor protein expression on the surface of these cells, this may mean that some cells express a low level of functional receptor protein that would render them CSF-1 responsive. A number of studies have detected c-fms expression in multipotent hematopoietic precursor cells (Hu et al. 1997; Nutt et al. 1999; Akashi et al. 2000) and even purified hematopoietic stem cells (HSCs) (Kondo et al. 2000). This is in contrast to other genes, such as the chicken lysozyme gene that bind transcription factors and activate transcription exclusively in more mature myeloid cells (Kontaraki et al. 2000; J. Kontaraki, S. Chong, A.D. Riggs, and C. Bonifer, unpubl.). It is likely that c-fms mRNA is actually expressed in only a subset of these cells at any moment in time, as shown by studies that examined c-fms expression in purified lin-/CD34+ precursors at single cell level (Hu et al. 1997), but this is not a key issue. The key point is that prior to lineage commitment and high level expression of c-fms, we can demonstrate complete transcription factor occupancy of the c-fms promoter and reorganization of chromatin in the precursor population as a whole. Our experiments add to the growing number of results indicating that epigenetic cell fate decisions precede the appearance of surface marker proteins and morphological changes (Bossard and Zaret 1998; Hernadez-Munain et al. 1999; Kontaraki et al. 2000; Spicuglia et al. 2000). For the c-fms gene, we now know which factors are involved in these decisions. From the viewpoint of the biology of CSF-1, the data are consistent with the view that this macrophage growth factor acts to promote growth and survival of hematopoietic cells that are already committed to myelopoiesis (Lagasse and Weissman 1997).
Dynamic assembly of transcription factors binding to FIRE during macrophage differentiation
Although the mouse and human c-fms proximal promoters have been studied extensively, FIRE was described only recently (Himes et al. 2001). The in vivo and in vitro analyses herein support the view that FIRE is a crucial determinant of transcriptional activity at the c-fms locus during macrophage lineage commitment. In transgenic mice, the 3.5-kb c-fms exon 2 promoter and downstream intron containing FIRE are sufficient to direct reproducible and lineage restricted expression of an EGFP reporter gene. Deletion of the 300-bp FIRE sequence completely abolished EGFP expression in both stably-transfected macrophages and transgenic mice (Himes et al. 2001; R.T. Sasmono, D. Oceandy, J.W. Pollard, W. Tong, P. Low, R. Thomas, P. Pauli, M.C. Ostrouski, S.R. Himes, and D.A. Hume, in prep.). The FIRE region binds a complex set of proteins previously shown to be important for gene regulation in macrophages, such as PU.1 C/EBP family, ets-factors, Sp1, and AML1 (Tenen et al. 1997). Both the promoter and FIRE were bound by PU.1 in vivo thus confirming the important role of this transcription factor in the regulation of c-fms expression in myeloid precursors of adult mice (DeKoter et al. 1998). During development, other members of the Ets family may also bind these sites, as the function of PU.1 in c-fms transcription is at least partly redundant (Ross et al. 1998; Lichanska et al. 1999; Luchin et al. 2001). Furthermore, we have identified multiple AML/CBFβ binding elements in the enhancer region of the mouse c-fms gene. AML-1 has been strongly implicated in transcriptional regulation in myeloid cells, in line with its clear role as a target for translocations in human myeloid leukaemias (for review, see Speck 2001). The human c-fms promoter contains a high affinity AML-1 binding site that regulates transcription (Zhang et al. 1994; Rhoades et al. 1996) but neither this sequence, nor an adjacent C/EBP site, is conserved in the mouse gene. The mouse enhancer sequence contains two functional binding sites for AML-1, only one of which, the upstream element, is completely conserved in the human sequence. Preliminary experiments with macrophage cell lines carrying stably transfected FIRE-bearing reporter gene constructs suggest that AML1/CBFβ can indeed trans-activate this element; however, the interpretation of these experiments in complicated by the fact that bacterial DNA alters macrophage physiology (Sester et al. 1999). This and because the function of FIRE is dependent on chromatin context, functional evaluation of the putative AML1 site, and other individual FIRE cis-acting elements, will require the introduction of mutations in the mouse germ line. The novel myeloid-expressed factor FBF-1, which binds an element identified through the in vivo footprinting experiments, is another major focus of further study.
Our studies clearly indicate that in contrast to the promoter, the extent of transcription factor occupancy at FIRE increased with increased c-fms transcription during macrophage differentiation. Within the temporal resolution of our differentiation system, sequential assembly of transcription factors could not be detected, suggesting that the factors on FIRE are organized synchronously into an enhanceosome (Merika and Thanos 2001). We infer that transcription factor assembly on FIRE is probably cooperative, similar to what has been observed with the T-cell receptor α enhancer (Hernandez-Munain et al. 1998) or the IL-2 promoter/enhancer (Garrity et al. 1994). Such cooperativity will need to be considered in interpreting any effects of individual mutations of the conserved elements of FIRE.
At the final stages of our macrophage differentiation culture the composition of the transcription factor complex binding to FIRE enhancer changed. A number of factor complexes were disassembled, whereas others remained. The most likely reason for this is that c-fms gene expression is modulated by CSF-1 itself (Yue et al. 1993). As CSF-1 is a vital component of our differentiation culture medium, it is likely that at early stages of differentiation when no or little CSF-1 receptor is expressed, precursors rely mostly on IL-3 for proliferation (Bartelmez et al. 1989; Breen et al. 1990). As the cells differentiate and express higher levels of CSF-1 receptor, their growth becomes dependent on the action of CSF-1. This, in turn, will initiate down-regulation of c-fms transcription. However, prolonged CSF-1 treatment had no effect on the overall accessibility of chromatin at FIRE. Similar to the promoter, also extended regions of FIRE surrounding chromatin stayed accessible to restriction enzyme digestion in mature, bone marrow-derived macrophages.
Alterations of chromatin fine structure on the c-fms promoter and transcription factor composition on FIRE after LPS treatment
Our results indicate that after LPS treatment, the transcription factor occupancy at both the promoter and FIRE was reduced, and the respective transcription factor complexes were disassembled. At the promoter, we observed no change in transcription factor composition. All in vivo G(N7) contacts became weaker, indicating a coordinate destabilization of the promoter complex. However, LPS treatment was accompanied by distinct chromatin fine structure alterations. Our photofootprinting data show clearly that chromatin structure at the c-fms promoter does not entirely revert to the pattern seen in c-fms nonexpressing cells, but rather adopts a new conformation, which is particularly apparent around the transcription start sites. This result is consistent with our DHS mapping experiments in murine macrophage cell lines that showed no difference in DNAseI accessibility with or without LPS treatment (Himes et al. 2001). LPS treatment has been shown to have an effect not only on c-fms transcription (Gusella et al. 1990), but also affects mRNA elongation downstream of the ATG (Yue et al. 1993). The chromatin fine structure alterations may therefore reflect the presence of stalled RNA polymerase molecules downstream of the transcription start sites. This would lead to topological changes in DNA structure that could be picked up by photofootprinting.
mRNA levels of some transcription factors involved in c-fms regulation were apparently down-modulated after LPS treatment of macrophages (PU.1, C/EBPs, AML-1; Fig. 4), which in theory could account for the reduction of transcription factor occupancy at the promoter and at FIRE. However, binding to the distal SP1/ets/AML1 cluster at + 2718 bp and the PU.1 (1) site was not reduced after LPS treatment of day 7 macrophages and Sp1/AML1 activity was high in mature macrophage cells (Fig. 8). One reason for this behavior may be that besides its activity as an enhancer that is required for c-fms promoter activation, FIRE may have a second role as an LPS-inducible antisense promoter (Himes et al. 2001; R. Himes and D.A. Hume, unpubl.). This would explain the finding that intronic sequences including FIRE are not only required for c-fms activation, but also for the block in mRNA elongation after LPS treatment (Yue et al. 1993). In this respect it may be relevant that FIRE contains several overlapping binding sites for different constitutive and LPS-inducible proteins. For example, Sp1 has been shown to be LPS inducible (Brightbill et al. 2000; R. Himes and D.A. Hume, unpubl.) and could maintain binding in this particular context. Because LPS also causes posttranscriptional modifications in several of the factors that bind the FIRE sequence, notably PU.1 (Lodie et al. 1997), it is possible that functional changes in FIRE occur without changes in binding site occupancy.
Taken together, our experiments provide a first glimpse into the dynamics of transcription factor complex formation and transcription regulation during cell differentiation in hematopoietic cells of higher eukaryotes. Future experiments will employ the techniques we have developed to gain further insights into the molecular details of differentiation decisions at the level of chromatin structure and expression of myeloid specific genes.
Materials and methods
Cell purification, tissue culture, and FACS analysis
Bone marrow cells were stained with CD4, CD8, CD11b, CD19, Gr1, F4/80, Ter119 monoclonal antibodies (mABs), and followed by depletion of lineage positive cells by magnetic cell spearation as described previously (Geiger et al. 1998). The lineage-depleted fraction was stained with anti rat IgG-FITC (Pharmingen), FITC conjugated anti ER-MP20, PE conjugated anti c-kit and biotinylated anti ER-MP12 mABs, followed by streptavidin-PECy5. Cell sorting was performed on a FACS Vantage cell sorter (Becton Dickinson). C-kithigh/ER-MP12high/ER-MP20− cells were cultured in macrophage differentiation medium, which consisted of Iscove's modified DMEM, 10% FCS, 10% L-cell conditioned medium as a source for CSF-1, 5% IL-3 conditioned medium and 100U/mL recombinant mIL-1 (a gift from the Genetics Institute). Medium conditioned by X63 Ag8–653 myeloma cells carrying an expression vector for IL-3 was used at 5% as a source for IL-3 (Karasuyama and Melchers 1988). Expression of cell surface antigens was detected by staining with PE-anti c-kit, FITC-anti ERMP-20, biotinylated anti-ERMP12, followed by streptavidin-PECy5 and FITC conjugated anti-CSF-1 receptor mAb, AFS98 (Sudo et al. 1995; a gift from S. Nishikawa), followed by flow cytometoric analysis performed on an Epics flow cytometer (Beckman Coulter). Morphological analysis was performed by May-Grünwald Giemsa staining.
Colony assay
One thousand cells from sorted fraction (C-kithigh/ER-MP12high and C-kithigh/ER-MP12−) was plated in 1 mL of a murine CFU-mix assay medium, Methocult M3434, (Stem Cell Technologies) into 30 mm petri dishes (Sterilin) and cultured in a moisture chamber under 5% CO2 at 37°C. Colonies are counted at day 8 for BFU-E and myeloid colonies. At day 8, individual colonies were picked up and subjected to May-Grünwald Giemsa staining.
Restriction enzyme accessibility assay
Restriction enzyme accessibility assays were performed as described previously (Kontaraki et al. 2000). Embryonic fibroblasts and bone marrow derived macrophages cultured in 6 cm tissue culture dishes were permeabilized, digested with 100 U of XbaI, HinfI, PvuII, SspI, XmnI, BanII, HindIII, and EcoRI in the corresponding reaction buffer for 1 h at 37°C. After restriction enzyme digestion, genomic DNA was purified, digested with BamHI or PstI to look at the promoter region and second intron, respectively, and analyzed by Southern blotting by using a PvuII–BamHI fragment as a probe as described previously (Himes et al. 2001).
RT–PCR
Total RNA was extracted from cells by using TRIZOL reagent (Invitrogen) according to the manufacturer's instructions. First-strand cDNA synthesis and PCR amplification were carried out as described previously (Tagoh et al. 1995). PCR was performed in 30 μL of reaction solution containing 1.5 U of rTaq polymerase (Promega), 0.2 mM of dNTPs, and 1 μM of primers. PCR products were resolved on agarose gels containing ethidium bromide and stained bands were quantified using a PhosphorImager (Bio-Rad). The linear range of amplification was determined and signals were normalized to the GAPDH signal. Primer sequences were as follows (Clarke et al. 2000): GAPDH upper; 5′- GGTCATCATCTCCGCCCCTTCTGC, GAPDH lower; 5′-GAGTGGGAGTTGCTGTTGAAGTCG, c-fms upper; 5′-GC GATGTGTGAGCAATGGCAGT, c-fms lower; 5′-AGACC GTTTTGCGTAAGACCTG, m-lys upper; 5′-ACCCAGCCTC CAGTCACCAT, m-lys lower; 5′-CAGTGCTTTGGTCTCCA CGG, PU.1 upper; 5′-TTTGCCTCCCACCAGGACTC, PU.1 lower; 5′-ACTAAGCCAGGCTGACCCTC, C/EBPα upper; 5′-AGTGTGCACGTCTATGCTA, C/EBPα lower; 5′-GTGTGTA TGAACTGGCTGGA, C/EBPβ upper; 5′-CGGGACTTGATGC AATCCG, C/EBPβ lower; 5′-CAACCCCGCAGGAACATCT TGATA-1 upper; 5′-GGAGGAATGCCAGCGGAGGAT, GATA-1 lower; 5′-TGTAGGCGATCCCAGCAGAGG, GATA-2 upper; 5′-ACGCCCACGCCTATCCAC. GATA-2 lower; 5′-CGAGC TGCAGCCCAGTTAGAA, AML-1 upper; CGGAGCGGTAG AGGCAAGA 5′-, AML-1 lower; 5′-GAGATGGACGGCAGA GTAGGG, iNOS upper; 5′-GAGGAGAGAGATCCGATTTA GAGTCTTGG, iNOS lower; 5′-CAGTCTCCATTCCCAAAT GTGCTTGT CAC.
In vivo genomic footprinting assays
DMS treatment and UV irradiation of cells and naked DNA, preparation of genomic DNA, LM-PCR, and TD-PCR were performed as described previously (Kontaraki et al. 2000) with the following modifications. Lambda DNA was used as a carrier during the genomic DNA preparation procedure. PCR amplification for LM- and TD-PCR was carried out using Pfu Turbo DNA polymerase (Stratagene) in buffer containing 1.4 M Betaine and 5% DMSO. PCR amplified products were labeled by primer extension using 32P- or IRD (LICOR) 5′-labeled primers. Quantification of band intensity was carried out on digitized data from a LICOR DNA sequencer using the ImagIR analysis program as described previously (Kontaraki et al. 2000; Chen et al. 2001). The primer sets for the promoter region were, Prom01 (+36–+56); 5′-CCCTTACCATGCCAAACTGTG, Prom02 (+21–+41); 5′-ACTGTGGCCAGCAGCAGGACC, Prom03D (+4–+24); 5′-GACCAGAGGAGGCCCCAACTC. Those for FIRE upper strand were, GB04 (+2959–+2979); GAGGTACCCAGTCTGC TGAGG, GB05 (+2937–+2957); ACCCAGTCTGCCCTCGC TTCT, GB06 (+2927–+2947); CCCTCGCTTCTCTGAGCC TGC . Primers for FIRE lower strand were, GB01 (+2586–+2606); TTGCCAAGAGTCCCTCAGTGT, GB02 (+2597–+2617); CCC TCAGTGTGTGAGAAGGAC.
EMSA
BMM were prepared from ∼2 − 4 × 10⁷ bone marrow cells treated in culture with 1 × 10⁴ units/mL of rhCSF-1 (Cetus Corporation) for 7 d. Nuclear extracts from BMM, and the MOP31C B-cell line were prepared according to a modified procedure from Schreiber et al. (1989), where 0.2% NP40 was used in the cell lysis buffer (Schreiber et al. 1989). Protein binding reactions were performed in 20 mM Hepes, 50 mM NaCl, 2 mM DTT, 0.5 mM EDTA, and 15% glycerol. Nuclear extracts were precleared for nonspecific protein binding by incubation of 1.5 μg of protein extract with 0.4 μg of poly dI-dC:poly dI-dC and 0.2 μg of highly fragmented Herring sperm DNA on ice for 5 min at 4°C and at room temperature for 5 min in reaction buffer, before addition of probe. For oligonucleotide competitions, a 200-fold excess of unlabeled competitor was added. 1.5 μL of Sp1-specific polyclonal antibody (Santa Cruz Biochemical) was added for supershift assay and this reaction was preincubated on ice for 15 min. Double-stranded oligonucleotide probes were end labeled with 32P by T4 poylnucleotide kinase reaction and purified by band isolation on polyacrylamide gels. Approximately 0.1 ng of probe was added to each reaction and incubated for 20 min at room temperature. Protein binding assays were run on 5% polyacrylamide containing 0.5× TBE buffer (0.5 mM Tri, 42 mM boric acid, 1 mM EDTA). Oligonucleotides used for EMSA contained the following sequences: FIRE Sp1, TGTGTGGGCG GAAACA; FIRE NoMS, AGACCTGACAGGGGGTTTGAGT TC; FIRE AML, TCGTTGCCTGTGTGGTGTCAGC; MMLV LTR AML, GGATATCTGTGGTAAGCA; and oct1, AGTATG CAAAGCAT.
Acknowledgments
We thank Liz Straszcinski (Molecular Medicine Unit, Leeds) for expert technical help with cell sorting and Hsiu-Hua Chen and Joanna Kontaraki for help with the initial in vivo footprinting experiments. We also thank George Follows for help with Giemsa-Grünwald staining and Rob Ploemacher and Christa Mueller-Sieburg for help with the identification of cell types on cytospins. This work was supported by grants from the Leukaemia Research Fund, Yorkshire Cancer Research, the Wellcome Trust, and the Candlelighter's Trust to C.B., as well as by a grant from the National Health and Medical Research Council of Australia to D.A.H. Infrastructure support for D.A.H. was provided in part by Australian Research Council Special Research Centre for Functional and Applied Genomics. C.B. would like to thank Prof. Alex Markham and the West Riding Medical Trust for providing bridging funds for the salaries of Deborah Clarke and Hiromi Tagoh.
The publication costs of this article were defrayed in part by payment of page charges. This article must therefore be hereby marked “advertisement” in accordance with 18 USC section 1734 solely to indicate this fact.
Footnotes
E-MAIL c.bonifer@leeds.ac.uk; FAX 44-113-244-4475
Article and publication are at http://www.genesdev.org/cgi/doi/10.1101/gad.222002.
References
- Akashi K, Traver D, Miyamoto T, Weissman IL. A clonogenic common myeloid progenitor that gives rise to all myeloid lineages. Nature. 2000;404:193–197. doi: 10.1038/35004599. [DOI] [PubMed] [Google Scholar]
- Alley EW, Murphy WJ, Russell SW. A classical enhancer element responsive to both lipopolysaccharide and interferon-gamma augments induction of the iNOS gene in mouse macrophages. Gene. 1995;158:247–251. doi: 10.1016/0378-1119(94)00892-v. [DOI] [PubMed] [Google Scholar]
- Bartelmez SH, Bradley TR, Bertoncello I, Mochizuki DY, Tushinski RJ, Stanley ER, Hapel AJ, Young IG, Kriegler AB, Hodgson GS. Interleukin 1 plus interleukin 3 plus colony-stimulating factor 1 are essential for clonal proliferation of primitive myeloid bone marrow cells. Exp Hematol. 1989;17:240–245. [PubMed] [Google Scholar]
- Bossard P, Zaret KS. GATA transcription factors as potentiators of gut endoderm differentiation. Development. 1998;125:4909–4917. doi: 10.1242/dev.125.24.4909. [DOI] [PubMed] [Google Scholar]
- Breen FN, Hume DA, Weidemann MJ. The effects of interleukin 3 (IL3) on cells responsive to macrophage colony-stimulating factor (CSF-1) in liquid bone marrow culture. Br J Haematol. 1990;74:138–147. doi: 10.1111/j.1365-2141.1990.tb02556.x. [DOI] [PubMed] [Google Scholar]
- Brightbill HD, Plevy SE, Modlin RL, Smale ST. A prominent role for Sp1 during lipopolysaccharide-mediated induction of the IL-10 promoter in macrophages. J Immunol. 2000;164:1940–1951. doi: 10.4049/jimmunol.164.4.1940. [DOI] [PubMed] [Google Scholar]
- Chen HH, Kontaraki J, Bonifer C, Riggs AD. Terminal transferase-dependent PCR (TDPCR) for in vivo UV photofootprinting of vertebrate cells. Sci STKE. 2001;77:PL1. doi: 10.1126/stke.2001.77.pl1. [DOI] [PubMed] [Google Scholar]
- Clarke D, Vegiopoulos A, Crawford A, Mucensk M, Bonifer C, Frampton J. In vitro differentiation of c-myb(−/−) ES cells reveals that the colony forming capacity of unilineage macrophage precursors and myeloid progenitor commitment are c-Myb independent. Oncogene. 2000;19:3343–3351. doi: 10.1038/sj.onc.1203661. [DOI] [PubMed] [Google Scholar]
- Dai XM, Ryan GR, Hapel AJ, Dominguez MG, Russell RG, Kapp S, Sylvestre V, Stanley ER. Targeted disruption of the mouse colony-stimulating factor 1 receptor gene results in osteopetrosis, mononuclear phagocyte deficiency, increased primitive progenitor cell frequencies, and reproductive defects. Blood. 2002;99:111–120. doi: 10.1182/blood.v99.1.111. [DOI] [PubMed] [Google Scholar]
- DeBruijn MFTR, Slieker WAT, van der Loo JCM, Voerman JSA, van Ewijk W, Leenen PJM. Distinct mouse bone marrow macrophage precursors identified by differential expression of ER-MP12 and ER-MP20 antigens. Eur J Immunol. 1994;24:2279–2284. doi: 10.1002/eji.1830241003. [DOI] [PubMed] [Google Scholar]
- DeKoter RP, Walsh JC, Singh H. PU.1 regulates both cytokine-dependent proliferation and differentiation of granulocytic/macrophage progenitors. EMBO J. 1998;17:4456–4468. doi: 10.1093/emboj/17.15.4456. [DOI] [PMC free article] [PubMed] [Google Scholar]
- Enver T, Greaves M. Loops, lineage and leukaemia. Cell. 1998;94:9–12. doi: 10.1016/s0092-8674(00)81215-5. [DOI] [PubMed] [Google Scholar]
- Garrity PA, Chen D, Rothenberg E, Wold B. Interleukin-2 transcription is regulated in vivo at the level of coordinated binding of both constitutive and regulated factors. Mol Cell Biol. 1994;14:2159–2169. doi: 10.1128/mcb.14.3.2159. [DOI] [PMC free article] [PubMed] [Google Scholar]
- Geiger H, Sick S, Bonifer C, Müller AM. Globin gene expression is reprogrammed in chimeras generated by injecting adult hematopoietic stem cells into mouse blastocysts. Cell. 1998;93:1055–1065. doi: 10.1016/s0092-8674(00)81210-6. [DOI] [PubMed] [Google Scholar]
- Gordon S, Fraser I, Nath D, Highes D, Clarke S. Macrophages in tissues and in vitro. Curr Opin Immunol. 1992;4:25–32. doi: 10.1016/0952-7915(92)90119-y. [DOI] [PubMed] [Google Scholar]
- Gualdi R, Bossard P, Zheng M, Hamada Y, Coleman JR, Zaret KS. Hepatic specification of the gut endoderm in vitro: Cell signaling and transcriptional control. Genes & Dev. 1996;10:1670–1682. doi: 10.1101/gad.10.13.1670. [DOI] [PubMed] [Google Scholar]
- Gusella GL, Ayroldi E, Espinoza-Delgado I, Varesio L. Lipopolysaccharide, but not IFN-gamma, downregulates c-fms mRNA proto-oncogene expression in murine macrophages. J Immunol. 1990;144:3574–3580. [PubMed] [Google Scholar]
- Hernandez-Munain C, Roberts J, Krangel MS. Cooperation among multiple transcription factors is required for access to minimal T-cell receptor α-enhancer in vivo. Mol Cell Biol. 1998;18:3223–3233. doi: 10.1128/mcb.18.6.3223. [DOI] [PMC free article] [PubMed] [Google Scholar]
- Hernandez-Munain C, Sleckman BP, Krangel MS. Adevelopmental switch from TCRδ enhancer to TCRα enhancer function during thymocyte maturation. Immunity. 1999;10:723–733. doi: 10.1016/s1074-7613(00)80071-0. [DOI] [PubMed] [Google Scholar]
- Himes R, Tagoh H, Goonetilleke N, Clark R, Bonifer C, Hume DA. A highly conserved intronic element in the c-fms (CSF-1 receptor) gene controls macrophage-specific and regulated expression. J Leukocyte Biol. 2001;70:812–820. [PubMed] [Google Scholar]
- Hu M, Krause D, Greaves M, Sharkis S, Dexter M, Heyworth C, Enver T. Multilineage gene expression precedes commitment in the hemopoietic system. Genes & Dev. 1997;11:774–785. doi: 10.1101/gad.11.6.774. [DOI] [PubMed] [Google Scholar]
- Jägle U, Müller AM, Kohler H, Bonifer C. Role of positive and negative cis-regulatory elements regions in the regulation of transcriptional activation of the lysozyme locus in developing macrophages of transgenic mice. J Biol Chem. 1997;272:5871–5879. doi: 10.1074/jbc.272.9.5871. [DOI] [PubMed] [Google Scholar]
- Karasuyama H, Melchers F. Establishment of mouse cell lines which constitutively secrete large quantities of interleukin 2, 3, 4, or 5 using modified cDNA expression vectors. Eur J Immunol. 1988;18:97–104. doi: 10.1002/eji.1830180115. [DOI] [PubMed] [Google Scholar]
- Komura J, Riggs A. Terminal deoxynucleotidyl transferase-dependent PCR, a new, more sensitive approach to genomic footprinting and adduct detection. Nucleic Acids Res. 1998;26:1807–1811. doi: 10.1093/nar/26.7.1807. [DOI] [PMC free article] [PubMed] [Google Scholar]
- Kondo M, Scherer DC, Miyamoto T, King AG, Akashi K, Sugamura K, Weissman IL. Cell-fate conversion of lymphoid-committed progenitors by instructive actions of cytokines. Nature. 2000;407:383–386. doi: 10.1038/35030112. [DOI] [PubMed] [Google Scholar]
- Kontaraki J, Chen HH, Riggs A, Bonifer C. Chromatin fine structure profiles for a developmentally regulated gene locus: reorganization of chromatin structure before trans-activator binding and activation of gene expression. Genes & Dev. 2000;14:2106–2122. [PMC free article] [PubMed] [Google Scholar]
- Kramer JA, McCarrey JR, Djakiew D, Krawetz SA. Differentiation: The selective potentiation of chromatin domains. Development. 1998;125:4749–4755. doi: 10.1242/dev.125.23.4749. [DOI] [PubMed] [Google Scholar]
- Lagasse E, Weissman IL. Enforced expression of Bcl-2 in monocytes rescues macrophages and partially reverses osteopetrosis in op/op mice. Cell. 1997;89:1021–1031. doi: 10.1016/s0092-8674(00)80290-1. [DOI] [PubMed] [Google Scholar]
- Lichanska AM, Browne CM, Henkel GW, Murphy KM, Ostrowski MC, McKercher SR, Maki RA, Hume DA. Differentiation of the embryonic mononuclear phagocyte system. The role of transcription factor PU.1. Blood. 1999;94:127–138. [PubMed] [Google Scholar]
- Lodie TA, Savedra R, Jr, Golenbock DT, Van Beveren CP, Maki RA, Fenton MJ. Stimulation of macrophages by lipopolysaccharide alters the phosphorylation state, conformation, and function of PU.1 via activation of casein kinase II. J Immunol. 1997;158:1848–1856. [PubMed] [Google Scholar]
- Luchin A, Suchting S, Merson T, Rosol TJ, Hume DA, Cassady AI, Ostrowski MC. Genetic and physical interactions between Microphthalmia transcription factor and PU.1 are necessary for osteoclast gene expression and differentiation. J Biol Chem. 2001;276:36703–36710. doi: 10.1074/jbc.M106418200. [DOI] [PubMed] [Google Scholar]
- Merika M, Thanos D. Enhanceosomes. Curr Opin Genet Dev. 2001;11:205–208. doi: 10.1016/s0959-437x(00)00180-5. [DOI] [PubMed] [Google Scholar]
- Nutt SL, Heavey B, Rolink A, Busslinger M. Commitment to the B-lymphoid lineage depends on the transcription factor Pax5. Nature. 1999;410:556–562. doi: 10.1038/44076. [DOI] [PubMed] [Google Scholar]
- Reddy MA, Yang BS, Yue X, Barnett CJ, Ross IL, Sweet MJ, Hume DA, Ostrowski MC. Opposing actions of c-ets/PU.1 and c-myb protooncogene products in regulating the macrophage-specific promoters of the human and mouse colony-stimulating factor-1 receptor (c-fms) genes. J Exp Med. 1994;180:2309–2319. doi: 10.1084/jem.180.6.2309. [DOI] [PMC free article] [PubMed] [Google Scholar]
- Rehli M, Lichanska A, Cassady AI, Ostrowski MC, Hume DA. TFEC is a macrophage-restricted member of the microphthalmia-TFE subfamily of basic helix-loop-helix leucine zipper transcription factors. J Immunol. 1999;162:1559–1565. [PubMed] [Google Scholar]
- Rhoades KL, Hetherington CJ, Rowley JD, Hierbert SW, Nucifora G, Tenen DG, Zhang DE. Synergistic up-regulation of the myeloid-specific promoter for the macrophage colony-stimulating factor receptor by AML1 and the t(8;21) fusion protein may contribute to leukemogenesis. Proc Natl Acad Sci. 1996;93:11895–11900. doi: 10.1073/pnas.93.21.11895. [DOI] [PMC free article] [PubMed] [Google Scholar]
- Roberts WM, Shapiro LH, Ashmun RA, Look AT. Transcription of the human colony-stimulating factor-1 receptor gene is regulated by separate tissue-specific promoters. Blood. 1992;79:586–593. [PubMed] [Google Scholar]
- Roque MC, Smith PA, Blasquez VC. A developmentally modulated chromatin structure at the mouse immunoglobilin k 3′ enhancer. Mol Cell Biol. 1996;16:3138–3155. doi: 10.1128/mcb.16.6.3138. [DOI] [PMC free article] [PubMed] [Google Scholar]
- Ross IL, Yue X, Ostrowski MC, Hume DA. Interaction between PU.1 and another Ets family transcription factor promotes macrophage-specific basal tanscription initiation. J Biol Chem. 1998;273:6662–6669. doi: 10.1074/jbc.273.12.6662. [DOI] [PubMed] [Google Scholar]
- Roth P, Stanley ER. The biology of CSF-1 and its receptor. Curr Top Microbiol Immunol. 1992;181:141–167. doi: 10.1007/978-3-642-77377-8_5. [DOI] [PubMed] [Google Scholar]
- Schreiber E, Matthias P, Muller MM, Schaffner W. Rapid detection of octamer binding proteins with ‘mini extracts’ prepared from a small number of cells. Nucleic Acids Res. 1989;17:6419. doi: 10.1093/nar/17.15.6419. [DOI] [PMC free article] [PubMed] [Google Scholar]
- Sester DP, Beasley SJ, Sweet MJ, Fowles LF, Cronau SL, Stacey KJ, Hume DA. Bacterial/CpG DNA down-modulates colony stimulating factor-1 receptor surface expression on murine bone marrow-derived macrophages with concomitant growth arrest and factor-independent survival. J Immunol. 1999;163:6541–6550. [PubMed] [Google Scholar]
- Shaffer AL, Peng A, Schlissel MS. In vivo occupancy of the k light chain enhancers in primary pro- and pre-B cells: A model for k locus activation. Immunity. 1997;6:131–143. doi: 10.1016/s1074-7613(00)80420-3. [DOI] [PubMed] [Google Scholar]
- Slieker WAT, van der Loo JCM, de Riejk-de Bruijn MFTR, Godfrey DI, Leenen PJM, van Ewijk W. ER-MP12 antigen, a new cell surface marker on mouse bone marrow cells with thymus repopulation ability: II. Thymus homing ability and phenotypic characterization of ER-MP12 positive bone marrow cells. Internat Immunol. 1993;5:1099–1107. doi: 10.1093/intimm/5.9.1099. [DOI] [PubMed] [Google Scholar]
- Speck NA. Core binding factor and its role in normal hematopoietic development. Curr Opin Hematol. 2001;8:192–196. doi: 10.1097/00062752-200107000-00002. [DOI] [PubMed] [Google Scholar]
- Spicuglia S, Payet D, Tripathi RK, Rameil P, Verthuy C, Imbert J, Ferrier P, Hempel WM. TCRα enhancer activaiton occurs via a pre-assembled conformational change of a pre-assembled nucleo-protein complex. EMBO J. 2000;19:2034–2045. doi: 10.1093/emboj/19.9.2034. [DOI] [PMC free article] [PubMed] [Google Scholar]
- Sudo T, Nishikawa S, Ogawa M, Kataoka H, Ohno N, Izawa A, Hayashi S-I, Nishikawa S-I. Functional hierarchy of c-kit and c-fms in intramarrow production of CFU-M. Oncogene. 1995;11:2469–2476. [PubMed] [Google Scholar]
- Sweet MJ, Hume DA. Endotoxin signal transduction in macrophages. J Leukoc Biol. 1996;60:8–26. doi: 10.1002/jlb.60.1.8. [DOI] [PubMed] [Google Scholar]
- Tagoh H, Nishijo H, Uwano T, Kishi H, Ono T, Muraguchi A. Reciprocal IL-1 beta gene expression in medial and lateral hypothalamic areas in SART-stressed mice. Neurosci Lett. 1995;184:17–20. doi: 10.1016/0304-3940(94)11157-e. [DOI] [PubMed] [Google Scholar]
- Tenen DG, Hromas R, Licht JD, Zhang DE. Transcription factors, normal myeloid development, and leukemia. Blood. 1997;90:489–519. [PubMed] [Google Scholar]
- van der Loo JCM, Slieker WAT, Kieboom D, Ploemacher RE. Identification of hematopoietic stem cell subsets on basis of their primitiveness using antibody ER-MP12. Blood. 1995;85:952–962. [PubMed] [Google Scholar]
- Visvader J, Verma IM. Differential transcription of exon 1 of the human c-fms gene in placental trophoblasts and monocytes. Mol Cell Biol. 1989;3:1336–1341. doi: 10.1128/mcb.9.3.1336. [DOI] [PMC free article] [PubMed] [Google Scholar]
- Wang SW, Speck NA. Purification of core-binding factor, a protein that binds the conserved core site in murine leukemia virus enhancers. Mol Cell Biol. 1992;12:89–102. doi: 10.1128/mcb.12.1.89. [DOI] [PMC free article] [PubMed] [Google Scholar]
- Xie Y, Chen C, Stevenson MA, Hume DA, Auron PE, Calderwood SK. NF-IL6 and HSF1 have mutually antagonistic effects on transcription in monocytic cells. Biochem Biophys Res Commun. 2002;291:1071–1080. doi: 10.1006/bbrc.2002.6562. [DOI] [PubMed] [Google Scholar]
- Yue X, Favot P, Dunn TL, Cassady AI, Hume DA. Expression of mRNA encoding the macrophage colony-stimulating factor receptor (c-fms) is controlled by a constitutive promoter and tissue-specific transcription elongation. Mol Cell Biol. 1993;13:3191–3201. doi: 10.1128/mcb.13.6.3191. [DOI] [PMC free article] [PubMed] [Google Scholar]
- Zhang DE, Fujioka K, Hetherington CJ, Shapiro LH, Chen HM, Look AT, Tenen DG. Identification of a region which directs the monocytic activity of the colony-stimulating factor 1 (macrophage colony-stimulating factor) receptor promoter and binds PEBP2/CBF (AML1) Mol Cell Biol. 1994;14:8085–8095. doi: 10.1128/mcb.14.12.8085. [DOI] [PMC free article] [PubMed] [Google Scholar]