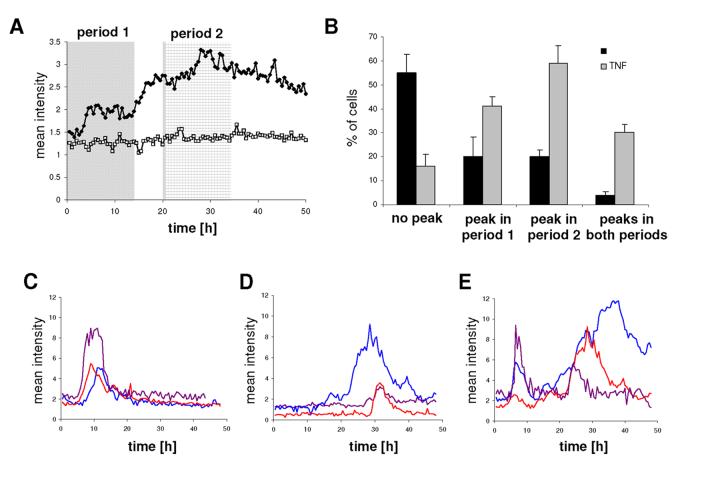
Fig. 2.
Real time luminescence imaging showed heterogeneous transcriptional responses in individual cells after TNF-α treatment.
GH3/hPrl-luc cells were cultured in 35 mm glass coverslip culture dishes, serum starved for 24h and then imaged for 48h following stimulation with 10 ng/ml TNF-α (◆) or not (□). (A) The mean of the total photon counts obtained from a whole microscopic field of cells (about 20 per field): shaded areas indicate the two time periods used to categorise cells into different patterns of expression. (B) Single cell transcriptional responses with or without TNF-α stimulation were classified into four groups using Cluster analysis software. The groups were defined as cells showing no significant response, all cells showing significant responses in period 1, all cells showing significant responses in period 2, and cells showing significant responses in both periods. Data shown are means ± SD from four or seven independent experiments. (C-E) Examples of single cells representing the predominant response patterns observed.

