Abstract
Background/Objective:
The use of the American Spinal Injury Association (ASIA) motor score as an outcome measure requires metrological study. This paper tests the hypothesis that a more accurate representation of motor function is obtained using separate upper and lower extremity scales rather than combining all 20 key muscle ratings into a single ASIA motor score.
Methods:
We analyzed archived data from 6,116 ASIA motor scale records extracted from the National Spinal Cord Injury Statistical Center Database.
Results:
The hypothesis that separate scales more accurately represent motor function than a single motor scale was supported (χ2(difference) = 2,596; df = 1; P < 0.0001). Two scales account for 87% of the variance, whereas a single scale accounts for only 82%. Lower extremity function is well represented in both solutions; however, upper extremity function is accurately represented only with the use of 2 separate scales.
Conclusions:
The use of components of the ASIA standards for other than classification of spinal cord injury needs study. Several lines of study converge to provide strong support for the existence of 2 distinctive dimensions underlying the ASIA motor scale. The use of a single motor score in spinal cord injury research should be questioned and justified to the extent possible. The use of upper and lower extremity scales will lead to a reduction in measurement error when the motor score is used as an outcome measure. The confirmation of 2 separate dimensions underlying the ASIA motor score will enable more accurate representation of motor function in spinal cord injury research.
Keywords: Spinal cord injuries, Measurement, ASIA motor scale
INTRODUCTION
The International Standards for Neurological Classification of Spinal Cord Injury were initially developed by the American Spinal Injury Association (ASIA) to categorize spinal cord injuries (SCIs). The standardized physical examination and classification facilitates communication concerning the level and extent of injuries (1). The key muscles designated in the motor score component of the standards were chosen so that the level of spinal injury could be determined and not because these muscles had any specific relevance in determining outcome. The ASIA motor score (AMS) has become widely used as an index of recovery after SCI (2–5) and as an outcome measure for clinical trials (6,7). The application of components of the ASIA score for other than injury classification warrants study. Evidence of the measurement properties, specifically the construct validity, of the AMS as an outcome measure is lacking.
The most fundamental validity question one can ask is, “Does a scale actually measure what it appears to measure? Do similarities and differences in scores relate to similarities and differences in the persons measured and what factors explain them?” In measurement terms, the question becomes “what construct(s) account for the observed variance?” Accurately describing the constructs that influence the scores obtained from a scale is fundamental and perhaps the most important activity in metrological research. If the scores from a scale do not accurately reflect the construct it is intended to represent, the foundation for any conclusions is completely removed. One method of studying construct validity is to determine if all of the items of a scale are contributing to the score in a meaningful way. In other words, are all of the items more or less strongly related to the construct they are intended to measure?
This paper describes an analysis of the AMS studying the construct validity of the motor score. It is intended to determine if the key muscles of the AMS are all equally related to a single motor dimension or if it is more accurate to conceptualize the AMS as 2 separate motor dimensions. The hypothesis for this study was developed from several lines of evidence.
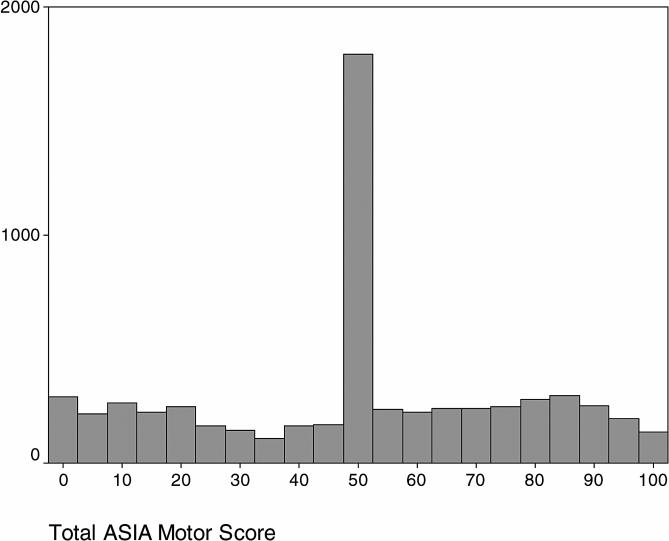
From an intuitive standpoint, the AMS seems to be 2 separate scales. There are no key muscles tested between levels T1 and L2. This separation of the upper and lower extremity scale key muscles provides prima facie evidence of the existence of separate scales. A consequence of the separation of the motor ratings is visible from a histogram of total scores. In distributions of motor scores, as much as 30% of the scores will have the same score value of 50 (8). The motor score of 50 can not distinguish a case with complete upper extremity function and no lower extremity function from a case partial function in both upper and lower extremities that sums to 50. Any scale that consistently shows a distribution with a large concentration of observations at a single score value is insensitive at best.
A more empirical line of evidence suggests that the key muscles of the AMS may not equally relate to a single underlying construct. Exploratory factor analysis of the AMS suggests that the key muscles actually define 2 distinctly separate factors (8): a lower extremity motor factor and an upper extremity motor factor each consisting of the respective 10 key muscles. These 2 factors accounted for 83% of the variance in the data. Furthermore, the correlation between these 2 factors is very low. This finding has been cross-validated in other samples (9,10).
Further evidence comes from item response theory (IRT). IRT studies suggest that 2 scales more accurately measure motor function than does the use of a single motor score. With IRT analysis, the accuracy of measurement is conveyed by an information function. The information function is inversely related to measurement error (11,12). The sum of the information functions from the separate upper and lower extremity scales exceeds the function for the single scale. One possible explanation for this is that the use of a single motor scale violates the unidimensionality assumption and thereby introduces measurement error. The increase in information indicates that 2 separate scales may describe motor function more accurately than a single total AMS.
These findings suggest that there may be quantifiable differences between 2 competing conceptual models of the AMS (1 dimension vs 2 dimensions). If this is the case, there should be detectable differences in how closely the 2 models fit observed data. It is now possible to offer the hypothesis that a model defining 2 separate dimensions will more accurately fit and account for more of the variance in observed data than will a model defining a single dimension. To test the hypothesis, 2 models will be established, model fit characteristics will be estimated, and the hypothesis will be tested using the difference in the measure of overall fit of these models.
METHODS
This is an analysis of data collected by the Model Spinal Cord Injury Systems in the National Spinal Cord Injury Statistical Center Database from 1993 through 2003. This collection period covered three 5-year grant cycles; therefore, the data were collected from 20 different Model SCI Centers. Data from 6,116 records were included, with complete data for the 20 key muscles in the AMS from the evaluation at time of discharge from rehabilitation. The individual key muscle ratings were used to determine the extent to which each rating correlated to the underlying construct in either a 1 or 2 motor-dimension model. Demographic and descriptive data were also collected. The chi-square test statistic was developed for each model using a generalized least squares method.
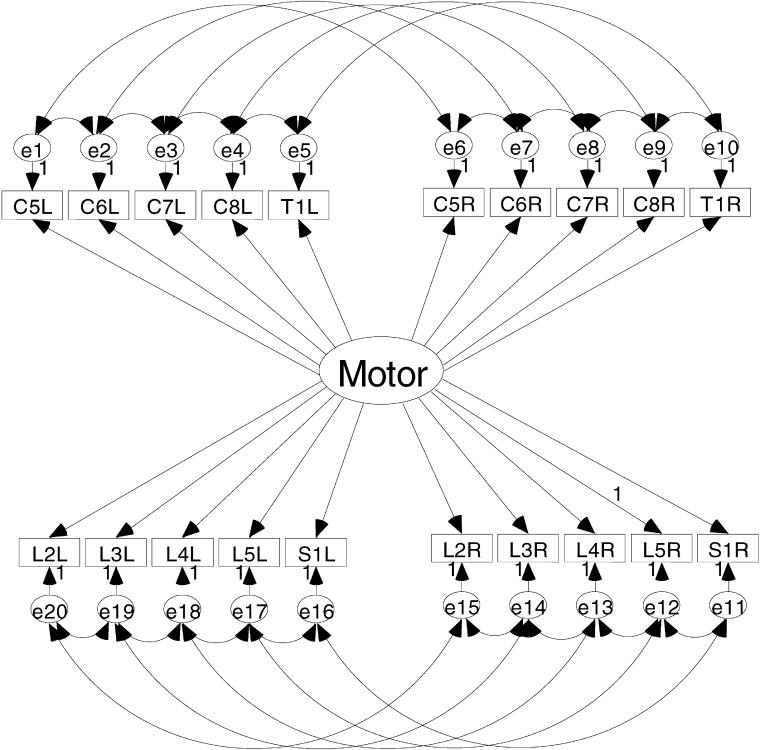
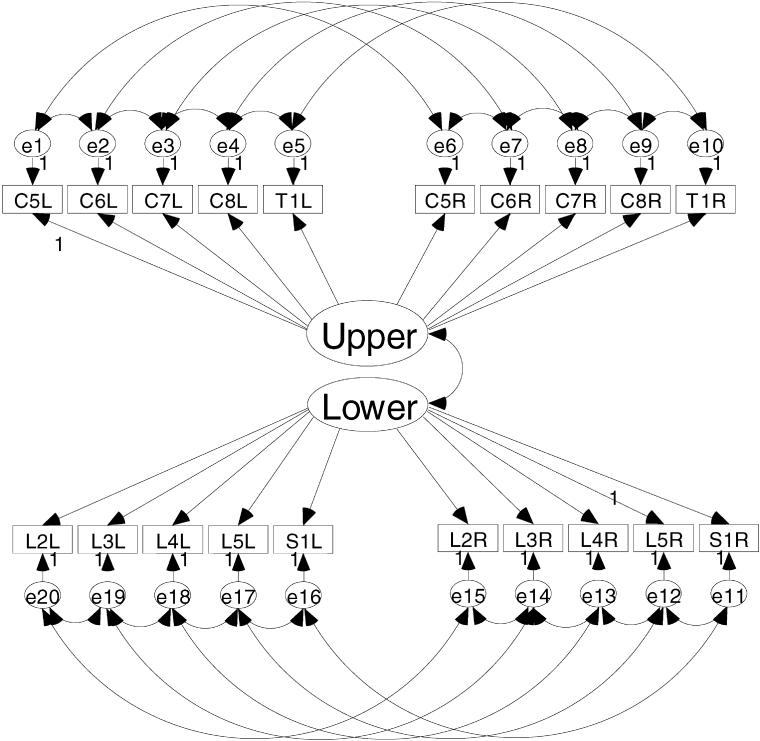
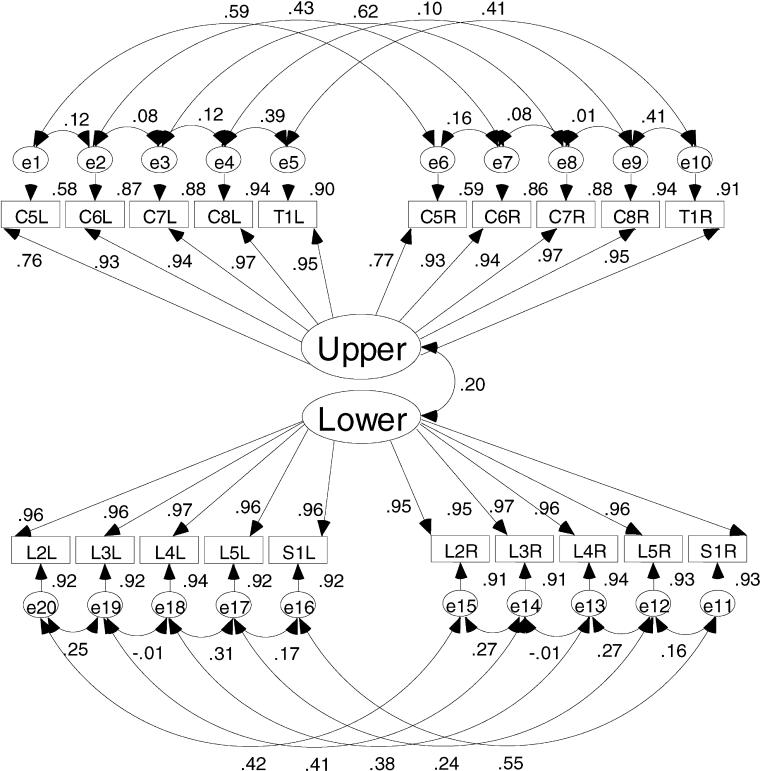
Figures 1 and 2 show the a priori models to be evaluated in this study. Figure 1 is the model depicting a single motor dimension underlying the 20 key muscle ratings. This model represents the traditional use of the AMS. An alternative model presented in Figure 2 depicts the upper motor dimension defined by the upper extremity key muscles and a lower motor dimension defined by the lower extremity key muscles. The key muscle data elements are shown in the 2 rows of small rectangles labeled for the key muscle and side of the body (eg, C5L = C-05 elbow flexor on the left side). Each of the key muscle data elements has a residual or error term associated with it. As the name suggests, these terms are in the model to account for variance in the ratings of the key muscles that is not aligned with the motor dimension(s). These residual terms are named consecutively from e1 to e20.
Figure 1. Single motor-dimension model as the AMS is typically conceptualized; all 20 key muscle ratings related to a single motor score.
Figure 2. An alternative model conceptualizing the AMS as upper and lower extremity motor scores.
The large oval(s) in the center of the diagrams represent the motor dimension(s) defined by the key muscle data elements. The straight line arrows from the dimensions to the key muscle data elements represent the correlations between the muscle rating and the motor dimension.
The curved lines with double-headed arrows between the upper and lower motor dimensions and the residual terms represent the correlation between unobserved variables. In these models, it is hypothesized that the key muscle residuals will show 2 specific patterns of interrelation. These interrelations are included to represent the influence the multiple innervations key muscles as well as the proximity of the neural tracts in the spinal cord. In a set of 20 residuals, there are 190 possible combinations of 2 residuals (13). However, only 26 (13%) of these possible interrelations are hypothesized to be meaningful and necessary to establish in the model. The first type of correlation between key muscle residuals is between adjacent key muscles. The residual for a specified key muscle is related to the residual of the ipsilateral key muscle directly above and/or below that key muscle. For example, the residual for the key muscle C6 on the left will be related to the residuals of the key muscles C5 and C7 on the left. This correlation is caused by the multiple innervations of the key muscles (14). There are 16 correlations of this type established in the model. The second type of correlation among the residual terms is between the residual terms of a specific key muscle with the residual term for that same key muscle on the contralateral side of the body. For example, the residual for C6 on the left is related to residual for C6 on the right. There are 10 correlations of the second type established in this model.
The 2-dimensional model in Figure 2 also shows a correlation between the upper and lower motor dimensions. The magnitude of relation between the 2 motor dimensions is thought to be small based on previous work (15). The degree to which the 2 motor dimensions are correlated can be interpreted as evidence of the validity of the 2-dimensional structure. If the 2 dimensions are not strongly related, there is support for using separate scales for the upper and lower extremity ratings. If the 2 dimensions are substantially related, the key muscles may indeed define a single scale of motor function.
Both models tested in this study are unidimensional measurement models. The 2-dimensional model depicted in Figure 2 is considered a unidimensional measurement model because the key muscle data elements load on only 1 dimension, and there are no correlations between the key muscles of the separate dimensions. Both models meet the necessary and sufficient requirements for model identification (16). Model identification is necessary for obtaining a solution.
The primary methodology for this study is confirmatory factor analysis, which is a structural equation modeling technique for testing hypotheses concerning relations between indicators and dimensions underlying them; it differs from exploratory factor analysis in that an hypothesis concerning the structure of the underlying factors is posited a priori.
For this study, the 2 a priori models were tested for fit. The hypothesis was tested on the difference in the global chi-square fit indicator between the 2 competing models. The chi-square statistic, in this case, is a measure of discrepancy between the model and the data. A smaller value for chi-square represents a closer fit between the data and the model, and a significant chi-square difference therefore indicates that one model fits significantly better than another. The hypothesis does not attempt to determine if either model represents a precise fit to the data, only that the 2-dimensional model will fit better than the 1-dimensional model. The single dimension model has 144 degrees of freedom, and the 2-dimensional model has 143. Therefore, the chi-square difference statistic will be distributed as a chi-square with 1 degree of freedom. The critical value for this statistic at P = 0.01 is 6.635. A difference in the chi-square of the 2 competing models of greater than 6.635 will indicate a difference between the models that is significant at the level of 0.01. The form of the hypothesis is (17):
 |
In addition to testing the hypothesis, an array of alternative fit indices will be evaluated to determine the extent to which the models fit the data. Each index provides different information concerning the nature of the fit of the models to the observed data. In addition to the test of the hypothesis and the fit indices, the final output of the models will provide (a) correlation coefficients between key muscles and the motor dimensions, between the key muscle residuals, and between the motor dimensions and (b) r2 , indicating the proportion of the variation in the individual key muscles ratings accounted for in the model.
RESULTS
The sample was 80% men, with a mean age of 36 ± 16.53 years. The majority were white (62%), followed by African American (26%), Hispanic (10%), and other or unspecified (2%). At the time of discharge from rehabilitation, 48% had paraplegia. Figure 3 shows the distribution of the total AMS used in this study. Similar to previous reports, 25% of the cases in this study had a score of 50. The peaked shape of the distribution indicates that the single total score would be unable to differentiate between complete paraplegic injuries and incomplete injuries.
Figure 3. A histogram showing the distribution of total scores used in this study. The concentration of 25% of the scores at the score value of 50 suggests that the ASIA motor score may be insensitive to change.
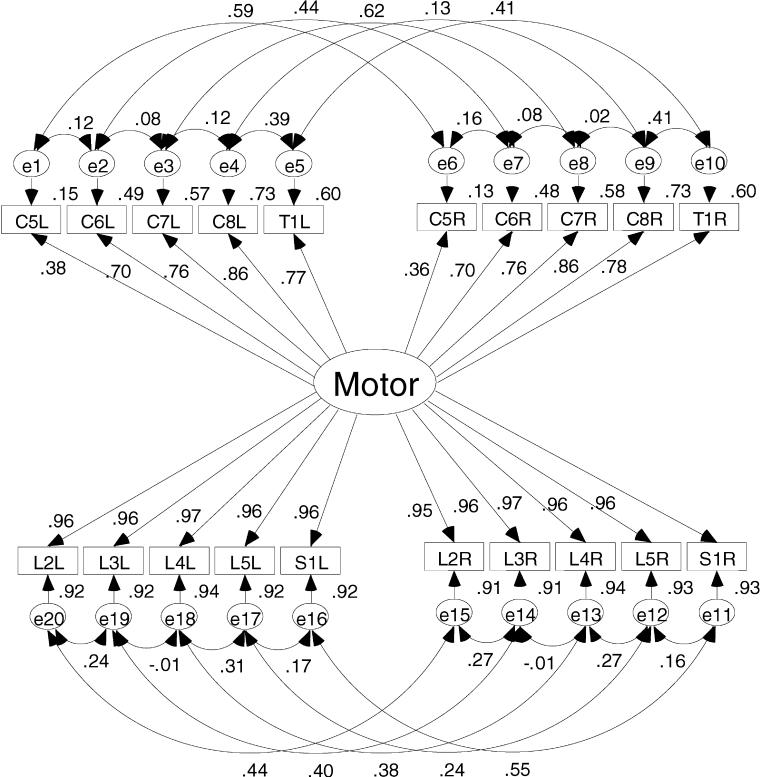
The single-dimension model produced a value of χ2 = 10,747, df = 144. The 2-dimensional model produced a value of χ2 = 8,151, df = 143. The difference (10,747 − 8,151 = 2,596) is distributed as a chi-square with 1 degree of freedom. Clearly, the value 2,596 is greater than the critical value of 6.635. Thus, there is support for the hypothesis that the 2-dimensional model represents a significant improvement over the single-dimension model. Figures 4 and 5 show the 2 models with the standardized estimates.
Figure 4. Single-dimension model results showing the correlation and squared correlation coefficients. This figure shows the small influence the upper extremities have on the total ASIA motor score.
Figure 5. Two-dimensional model results showing the correlation and squared correlation coefficients. This figure shows the increased influence the upper extremities have on the total ASIA motor score when a 2-dimensional model is used.
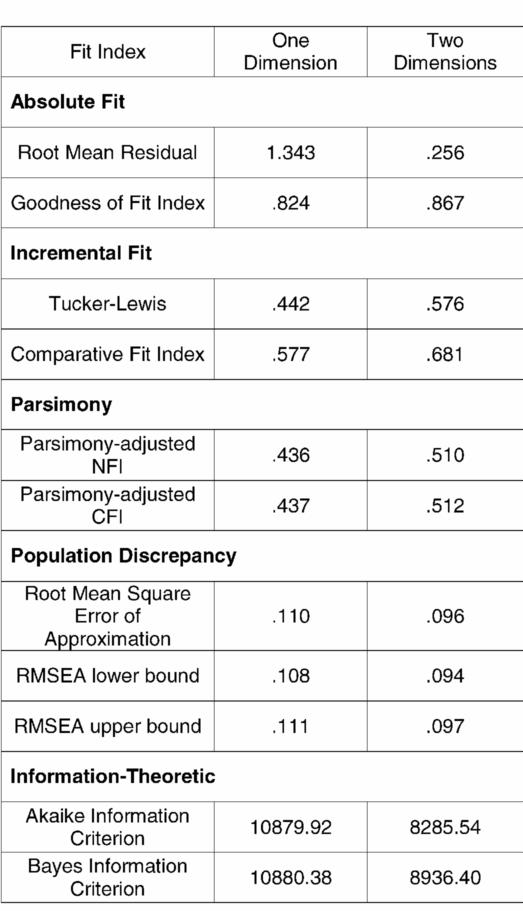
Table 1 lists the array of alternative fit indices to compare the 2 competing models. In each case, the fit indices supported the 2-dimensional model. The Goodness of Fit Index (GFI) and Root Mean Residual (RMR) are in the class of fit indices called absolute fit indices. The GFI indicates 82% of the variance is accounted for in the 1-dimension model, whereas 86% of the variance is accounted for in the 2-dimensional model. The advantage of the 2-dimensional model comes from accounting for more of the variance in the upper extremity ratings.
Table 1.
Array of Alternative Fit Indices From Several Classes of Fit Indices
Figure 4 clearly shows that the single-dimension solution is not accounting for the variance in the upper extremity ratings. The correlation coefficients between the upper extremity key muscle ratings and the single motor dimension in Figure 4 are weaker than the same parameter in the 2-dimension model. The correlation coefficients for the upper extremity ratings are stronger in the 2-dimensional solution. These structure coefficients ranged from 0.76 to 0.97. When squared, these structure coefficients for the upper extremity ratings show that from 58% to 94% of the variance in the individual key muscles ratings was accounted for in the solution compared with the range from 13% to 73% for the upper extremity muscles in the 1-dimension model. Therefore, less of the variance in the upper extremity ratings is relegated to error in the 2-dimension model. This is certainly one reason the 2-dimensional model fits the data better than the single-dimension model.
The RMR for the 1-dimension model is 1.34 compared with 0.25 for the 2-dimension model, indicating that the 2-dimensional model has substantially less residual variance than the single-dimension model. RMR = 0.25 indicates that the relations established in the 2-dimensional model account for the majority of the variance.
Incremental fit indices include the Tucker-Lewis index and the comparative fit index. Values for these indices near 1.0 indicate a close fit. While these do not approach 1.0, there is a 30% increase in the Tucker-Lewis index and an 18% increase in the comparative fit index for the 2-dimensional model. With only 1 degree of freedom difference between the 2 competing models, fit indices that take into consideration the parsimony of the model would not be expected to differ much for these models. However, both the parsimony-adjusted Normed Fit Index (NFI) and Comparative Fit Index (CFI) indicate a better fit for the more complex model (1 less degree of freedom).
The root mean square error of approximation (RMSEA) is an index of population discrepancy that takes into account the complexity of the models. This index provides a confidence interval around the estimate. It has been suggested that values for the RMSEA that exceed 0.1 should lead to model rejection (18,19). In the case of the 2-dimensional model, not only is the RMSEA less than 0.1, but the entire confidence interval is contained below 0.1. All of the values of the RMSEA for the 1-dimensional model exceed the cut-off.
The final class of fit indices is information theoretic. For these measures, large values indicate a combination of model misfit and complexity. The values for both the Akaike information criteria and the Bayes information criteria favor the more complex 2-dimensional model. This indicates that the improvement in model fit overcomes the added complexity of the model.
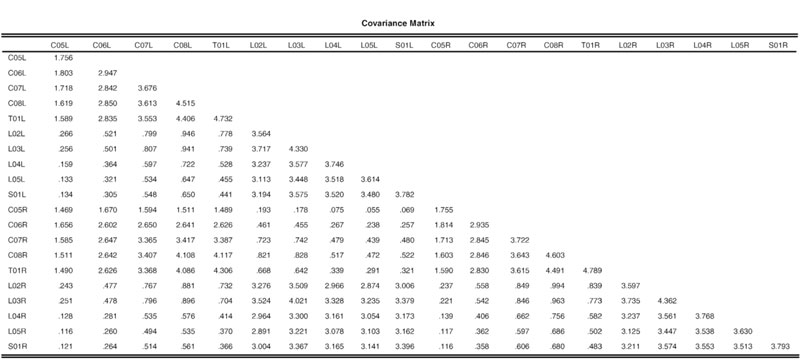
Table 2 provides the variance-covariance matrix for interested investigators to attempt the fit of alternative models.
Table 2.
Covariance Matrix Used in This Study. (This is included for the benefit of investigators wishing to test other models.)
DISCUSSION
The key muscles and maneuvers specified to test them were chosen because, with systematic application of the standards, they were helpful in determination of the level of injury. There have been attempts to use similar motor scores to quantify recovery (20); however, the methods used are distinct for the total motor score contained in the AMS. The extent to which the AMS is useful as an outcome measure needs to be studied and shown. Key among the metric properties in need of study is the construct validity of the AMS.
The results of this study provide strong evidence of 2 dimensions underlying the 20 key muscle elements of the AMS. These dimensions are defined by distinctive sets of key muscle ratings and only minimally correlated. Combining minimally related dimensions into a single score is a clear violation of the unidimensionality assumption and calls the validity of conclusions drawn from studies using a unitary motor score into question. If the 20 key muscles are considered as a single scale, the variation in the lower extremity scores exerts greater influence in defining whatever the single dimension is measuring—it certainly is not a comprehensive aggregate of the 20 key muscles—the variation in the upper extremity ratings being obfuscated by the variation in the lower extremity ratings. Two separate scales are required to allow more precise measurement and a more comprehensive assessment of motor function.
There is remarkable symmetry evident in the lower extremity key muscle ratings in both solutions; the muscle-to-factor correlation coefficients are virtually identical in both solutions. The single dimension solution is accounting for a substantial portion of the variance in the lower extremity ratings. However, the single-dimension model does not account for as much of the variation in the upper extremity ratings; the 2-dimensional model, however, accounts for the same amount of variance in the lower extremities and more variance in the upper extremities.
Accounting for the variation in upper extremity motor function will translate into more accurate prediction of constructs such as outcomes as measured by the functional independence measure (FIM) or other instruments that address functional ability or manual dexterity. The increased ability of the 2-dimensional model to account for the variation in upper extremity motor function means that tasks requiring upper extremity dexterity are more likely to covary with the upper extremity scale. Because the variance related to upper extremity function is no longer treated as error variance, the strength of the relation between these measures is bound to improve.
A more important implication of this research is that the separation of the upper and lower extremities will more accurately operationalize theoretical models of disability such as the International Classification of Functioning, Disability, and Health (21). When attempting to quantify unobservable constructs such as impairment, there is a clear advantage to using measures that validly measure the important and discernible indicators of that construct. In SCI research there is an obvious need to accurately quantify the motor capabilities of both the upper and lower extremities.
Regardless of the application of the AMS, it is clear that the upper and lower motor scales are distinct and should be used as such. The use of the AMS as 2 separate scales is only a partial solution to the problem shown in Figure 3. Using 2 scales provides 2 skewed variables instead of a single variable with a concentration of cases obtaining a single score. Using 2 scales, however, will increase the predictive power of the AMS and increase the accuracy of the characterization of motor ability in persons with SCI. Moreover, using a single total AMS may lead to failure to reject null hypotheses when there was indeed an effect. The insensitivity or flawed conception of the total AMS cannot be overcome with transformations or modern testing procedures.
It may well be the case that some other combination of upper and lower extremity muscles could provide a more accurate measure of motor function than those included in the AMS. There are many other muscles that could be tested using more conventional manual muscle testing (22). However, the wide acceptance of the International Standards and the standardized assessment techniques make the AMS an attractive alternative for research. It must be remembered, however, that the standards are very well validated for injury classification. The validity does not generalize to the use of components as outcome measures. The metric properties of the components must be studied to ensure the integrity of findings.
The adoption of upper and lower extremity motor function scores should not be an obstacle. The simple summated upper and lower extremity scores should suffice in most research applications. However, if greater accuracy of scoring is desired, either a weighted linear composite score such as a factor score or a marginal maximum likelihood estimate from item response theory analysis can be used. By doing so, the sources of error from assessing and recording the ratings may be minimized.
CONCLUSION
Two separate motor scores more accurately represent the construct of motor function as measured by the AMS than does a single summated score. If the AMS is to be used as an outcome measure, it should be used as 2 separate scales. Moreover, summation of the 20 key muscle elements should be questioned in SCI research. The single dimension computed as a sum of the 20 key muscle ratings is, at best, insensitive to change, and at worst, an invalid measure of motor function. This could lead to researchers rejecting promising treatments (ie, committing type II errors) caused by the insensitive nature of the AMS.
Footnotes
This study was supported by Grant H133N000004 from the National Institute on Disability and Rehabilitation Research in the Office of Special Education and Rehabilitation Services in the US Department of Education.
REFERENCES
- Marino RJ, Barros T, Biering-Sorensen F, et al. International Standards for Neurological Classification of Spinal Cord Injury. J Spinal Cord Med. 2003;26(Suppl 1):S50–S56. doi: 10.1080/10790268.2003.11754575. [DOI] [PubMed] [Google Scholar]
- Waters RL, Adkins RH, Sie IH, Yakura JS. Motor recovery following spinal cord injury associated with cervical spondylosis: a collaborative study. Spinal Cord. 1996;34:711–715. doi: 10.1038/sc.1996.129. [DOI] [PubMed] [Google Scholar]
- Waters RL, Sie I, Adkins RH, Yakura JS. Injury pattern effect on motor recovery after traumatic spinal cord injury. Arch Phys Med Rehabil. 1995;76:440–443. doi: 10.1016/s0003-9993(95)80573-7. [DOI] [PubMed] [Google Scholar]
- Waters RL, Sie I, Adkins RH, Yakura JS. Motor recovery following spinal cord injury caused by stab wounds: a multicenter study. Paraplegia. 1995;33:98–101. doi: 10.1038/sc.1995.23. [DOI] [PubMed] [Google Scholar]
- Waters RL, Adkins RH, Sie I, Jeffrey C. Postrehabilitaiton outcomes after spinal cord injury caused by firearms and motor vehicle crash among ethnically diverse groups. Arch Phys Med Rehabil. 1998;79:1237–1243. doi: 10.1016/s0003-9993(98)90268-4. [DOI] [PubMed] [Google Scholar]
- Bracken MB. Pharmacological interventions for acute spinal cord injury. Cochrane Database Syst Rev. 2000;2:CD001046. doi: 10.1002/14651858.CD001046. [DOI] [PubMed] [Google Scholar]
- Geisler FH, Dorsey FC, Coleman WP. Recovery of motor function after spinal cord injury: a randomized, placebo-controlled trial with GM-1 ganglioside. N Engl J Med. 1991;324:1829–1838. doi: 10.1056/NEJM199106273242601. [DOI] [PubMed] [Google Scholar]
- Graves DE, Marino RJ. Reference Manual for the International Standards for Neurological Classification of Spinal Cord Injury. Chicago, IL: American Spinal Injury Association; 2003. Metric properties of the International Standards for Neurological Classification of Spinal Cord Injury, implications for research use; pp. 68–88. [Google Scholar]
- Graves DE, Frankiewicz RG. Internal consistency does not equal unidimensionality. Abstracts of Posters. Arch Phys Med Rehabil. 2001;82:1496. [Google Scholar]
- Graves DE, Frankiewicz RG. Cross validation of Americian Spinal Injury Association motor scale and the FIM instrument: enhancing conceptual clarity using item response theory. Arch Phys Med Rehabil. 2001;82:1496. [Google Scholar]
- Lord FM. Information functions and optimal scoring weights. In: Lord FM, editor. Applications of Item Response Theory to Practical Testing Problems. Hillsdale, NJ: Lawrence Erlbaum Associates; 1980. pp. 65–82. [Google Scholar]
- Embertson SE, Reise SP. Item Response Theory for Psychologists. Mahwah, NJ: Lawrence Erlbaum Associates; 2000. [Google Scholar]
- Glass GV, Stanley JC. Statistical Methods in Education and Psychology. Englewood Cliffs, NJ: Prentice-Hall; 1970. [Google Scholar]
- American Spinal Injury Association. Reference Manual for the International Standards for Neurological Classification of Spinal Cord Injury. Chicago, IL: American Spinal Injury Association; 2003. [Google Scholar]
- Marino RJ, Graves DE. Metric properties of the ASIA motor score: subscales improve correlation with functional activities. Arch Phys Med Rehabil. 2004;85:1804–1810. doi: 10.1016/j.apmr.2004.04.026. [DOI] [PubMed] [Google Scholar]
- Kline R. Measurement models and confirmatory factor analysis. In: Kenny D, editor. Structural Equation Modeling: Principles and Practices. New York: Guilford Press; 1998. pp. 189–243. [Google Scholar]
- Bollen KA. Structural Equations With Latent Variables. New York: Wiley; 1989. [Google Scholar]
- Browne MW, Cudeck R. Alternative ways of assessing model fit. In: Bollen KA, Long JS, editors. Testing Structural Equation Models. Ft. Wayne, IN: Sage Focus Editions; 1993. pp. 136–162. [Google Scholar]
- MacCallum RC, Browne M, Sugawara H. Power analysis and determination of sample size for covariance structure modeling. Psychol Methods. 1996;1:130–149. [Google Scholar]
- Lucas JT, Ducker TB. Motor classification of spinal cord injuries with mortality, morbidity and recovery rates. Am Surg. 1979;45:151–158. [PubMed] [Google Scholar]
- World Health Organization. International Classification of Functioning, Disability and Health. Geneva, Switzerland: World Health Organization; 2001. [Google Scholar]
- Hislop HJ, Montgomery J. Muscle Testing: Techniques of Manual Examination. Philadelphia, PA: WB Saunders Company; 2002. [Google Scholar]


