Abstract
Cycling of actin subunits between monomeric and filamentous phases is essential for cell crawling behavior. We investigated actin filament turnover rates, length, number, barbed end exposure, and binding of cofilin in bovine arterial endothelial cells moving at different speeds depending on their position in a confluent monolayer. Fast-translocating cells near the wound edge have short filament lifetimes compared with turnover values that proportionately increase in slower moving cells situated at increasing distances from the wound border. Contrasted with slow cells exhibiting slow actin filament turnover speeds, fast cells have less polymerized actin, shorter actin filaments, more free barbed ends, and less actin-associated cofilin. Cultured primary fibroblasts manifest identical relationships between speed and actin turnover as the endothelial cells, and fast fibroblasts expressing gelsolin have higher actin turnover rates than slow fibroblasts that lack this actin-severing protein. These results implicate actin filament severing as an important control mechanism for actin cycling in cells.
Keywords: cell motility, actin polymerization, actin severing, ADF, cofilin, gelsolin
Cytoplasmic actin distributes between a monomeric phase and a dynamic filamentous state. When cells change shape, they recruit unpolymerized actin for assembly into new or preexisting filaments. For steady shape changes during cell crawling, monomers required for filament polymerization must derive from filament depolymerization elsewhere. Thus, the lifetime of filaments and the fraction of actin polymerized are parameters in cell motility whose values are linked by a steady-state actin cycle (1, 2). This cycle is a macroscopic manifestation of turnovers of individual actin filaments that depend on energy derived from ATP hydrolysis. Monomer assembly is the dominant reaction at the fast growing (“barbed”) ends of actin filaments, whereas filament disassembly prevails at the slow growing (“pointed”) end. In this way, monomers flux through filaments from the barbed to the pointed end in a process known as treadmilling or turnover (3). Subunits add onto barbed ends as ATP-actin and hydrolyze ATP to ADP and Pi as they flux to pointed ends. Eventually, Pi dissociates from the filaments.
Many actin-binding proteins can influence actin filament turnover in vitro. These include proteins, which alone or in combination block monomer assembly at barbed ends, nucleate filament assembly, sever the noncovalent bonds between actin monomers in filaments, or influence the rate of nucleotide exchange on actin monomers and the rates of monomer addition and loss at filament ends (4). Although all of these mechanisms probably contribute to actin cycling in cells, sorting out their relative roles is a challenge. Proteins from the actin depolymerizing factor (ADF)/cofilin family are currently thought to be most important for accelerating actin turnover (5, 6). In their dephosphorylated form, these proteins bind to ADP-bound actin subunits in filaments to accelerate their disassembly from pointed ends in vitro (7). Actin subunit generation by such a mechanism appears to be a rate-limiting step of the actin cycle (8). Some investigators also believe that ADF/cofilin can increase the number of filament ends by a weak filament-severing activity (9, 10). If severing contributes to the abilities of cofilin to accelerate actin turnover in cells, then severing by other proteins should have similar effects. Severing is a demonstrated function of the gelsolin family of proteins (11). Gelsolin is activated by μM calcium to bind and sever actin filaments. After severing filaments in vitro, gelsolin remains tightly associated with actin filament barbed ends to block monomer assembly and disassembly at this end (12). Gelsolin can be dissociated from actin in vitro by phosphoinositides and lysophosphatidic acid (13). In cells, gelsolin transiently associates with actin, indicating that its primary function is severing rather than barbed end capping (14, 15).
Key parameters influencing cellular actin recycling, such as the number and length of actin filaments, the relative fractions of monomeric, and filamentous actin, and whether actin filament barbed ends are free or capped are estimable with variable precision, but only in broken cells. However, filament turnover can be directly assayed in intact cells by photoactivation of fluorescence (PAF) (16) or by fluorescence recovery after photobleaching (FRAP) (17). In these experiments, fluorescently derivatized actin monomers microinjected into cells incorporate into the actin cytoskeleton. Irradiating the cell with a narrow band of light either activates or bleaches fluorescence locally. Monitoring the evolution of fluorescence determines the dynamics of the injected actin. Such studies have revealed that actin turnover can vary in cells from tens-of-seconds at the leading edge of highly motile fish keratocytes (16) to tens-of-minutes in fibroblast actin bundles (stress fibers) (18). These techniques can estimate the fraction of actin polymerized and filament turnover simultaneously (19).
Actin turnover studies on cells caused to migrate at different speeds or with modifications in expression of actin binding proteins could be informative as to how these factors influence actin-recycling rates. We, therefore, undertook studies that combine PAF and FRAP experiments on single cells with biochemical assays on broken cells to examine the mechanisms regulating motility in primary bovine aortic endothelial cells (BAEC) moving at different speeds dependent on their position in wounded monolayers, and in fibroblasts with rates of migration determined by whether or not they express the actin-severing protein gelsolin.
Materials and Methods
Cell Culture and Motility Analysis.
Primary BAECs (BAEC-77, passages 5–15) used in PAF studies were a gift of M.A. Gimbrone, Jr. (Vascular Research Division, Brigham and Women's Hospital, Boston). BAECs for FRAP studies were isolated and used as previously described (19). Gelsolin null and wild-type fibroblasts were provided by T. Azuma and D. J. Kwiatkowski (Hematology Division, Brigham and Women's Hospital, Boston) (20). Cell speeds were determined with time-lapse video microscopy. Images of wounded monolayers (BAECs) were recorded for 10–25 h; subconfluent cells (BAECs and fibroblasts) were recorded for 4–8 h. Cell movement was quantitated by tracking the nuclear trajectories of individual cells in movies. The mean-square-displacements (MSDs) of the nuclei were computed from the cellular trajectories. Root-mean-square (rms) cell speeds were determined by fitting MSDs to a formula describing cell dispersion as a function of time and cell persistence (21).
PAF and FRAP Analysis.
Caged-resorufin iodacetamide-labeled actin was synthesized according to the method of Theriot and Mitchison (16), and experiments were conducted as previously described (19). FRAP experiments were conducted as previously described (19). Photoactivated and photobleached bands were broad (≈7 μm) and spanned one dimension of the cell. This provides an estimate of the average polymer fraction and filament lifetime in the cell. This approach does not discriminate between the contributions of different cellular regions, and is most appropriate for combining PAF/FRAP results with those from bulk nucleation and fractionation assays. Intravital staining of plated cells in PAF experiments was done with 5-chloromethylfluorescein diacetate (Molecular Probes).
Fluorescence Measurement of Actin Assembly.
BAEC were grown on 0.1% gelatin-coated borosilicate glass tubes to a desired density in low glucose DMEM with 10% FBS. Cells were washed three times with Liebovitz's L-15 media, and membranes were extracted in PHEM permeabilization/nucleation buffer [PHEM (22, 23)/0.1% Triton X-100/2 μM phallacidin/0.15 M KCl). After 2 min of extraction at room temperature, 1 μM pyrene-labeled actin was added, and the samples were quickly assayed after brief vortexing. Fluorescence was monitored for 10 min (excitation 366 nm, emission 386 nm). Experiments were repeated in the presence of 2 μM cytochalasin B, allowing determination of cellular barbed and pointed ends content as detailed elsewhere (24) (and see text above). Controls without cells insured that nucleation was cell-specific, whereas those with 1–10% calf serum proved that nucleation was not the result of residual serum proteins. Cell densities were determined from images of the tube surface. The number of cells contributing to assays was calculated by multiplying cell surface densities times the tube area illuminated by the slit. An independent cell density was determined for each tube in each experiment. The statistics on these densities are: 164,423 ± 29,506 cells contributing per confluent experiment and 33,762 ± 16,224 cells contributing per subconfluent experiment.
Actin and Cofilin Content.
BAECs were grown either to confluence or ≈40% confluence on 100-mm Petri dishes. Cells were washed with PBS and lysed while adherent with Triton lysis buffer (1 mM EDTA/150 mM NaCl/50 mM Tris/1% Triton X-100/200 mM PMSF/0.1 mg/ml aprotinin, leupeptin, and benzamidine, pH 7.4). Cell lysates were collected by scraping the Petri dishes with a rubber scrapper. Protein remaining adherent to Petri dishes was solubilized with a small volume of Lysis buffer containing 2% SDS and assayed for completeness of protein recovery. The total cell protein was determined in the whole cell lysates by a Pierce bicinchoninic acid protein assay. Triton soluble and insoluble cell fractions were separated by centrifugation at 100,000 × g for 30 min at 37°C. The total protein loaded for the two phenotypes was matched on SDS/PAGE gels. Coomassie brilliant blue-stained gels were digitized and quantitated by using the densitometric features of NIH image.
Subconfluent and confluent BAECs were partitioned into Triton soluble and insoluble fractions. Samples were adjusted to match total protein, separated by SDS/PAGE, transferred to PVDF membranes, and probed with rabbit polyclonal antisera (gift from Peter Marks, Hematology Division, Brigham and Women's Hospital) developed against human recombinant cofilin (1:1000). Cofilin detection was accomplished by using a horseradish peroxidase-conjugated goat anti-rabbit secondary antibody (1:5000) and incubation in Pierce ECL chemiluminescence reagent. Exposed film was quantitated by using NIH image.
Results
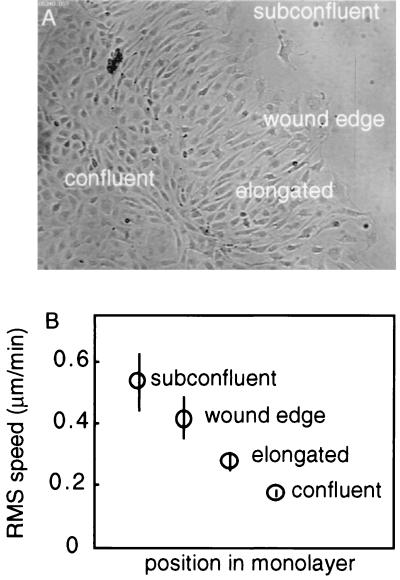
After overnight recovery, wounded BAEC monolayers display distinct motile and morphological zones (25–27) (Fig. 1A). Far from the wound, cells exhibit the cobblestone morphology typical of cells in a confluent endothelial monolayer. Cells adjacent to the confluent region are elongated and aligned perpendicular to the wound edge. Cells at the edge of the wound have the stereotypical fan-shape morphology of motile cultured cells. Root-mean-square (rms) cell speed monotonically decreases with increasing distance from the wound (Fig. 1B). All three cell phenotypes observed in monolayers are slower than fully subconfluent BAECs.
Figure 1.
Relationship between BAEC morphology and average cell speeds. BAEC were grown to confluence, wounded with a cell scraper, and allowed to recover overnight. The trajectory taken by individual cells was analyzed in time-lapse recordings. (A) Recovering wounded BAEC monolayers exhibit four distinct cell morphologies: rare isolated cells free to move in any direction; polarized wound-edge cells with broad lamellae; elongated cells aligned perpendicular to the wound; and the cobblestone morphology typical of confluent BAECs. (B) Each BAEC phenotype has a distinct rms cell speed. Error bars are SEMs with 20 < n < 50.
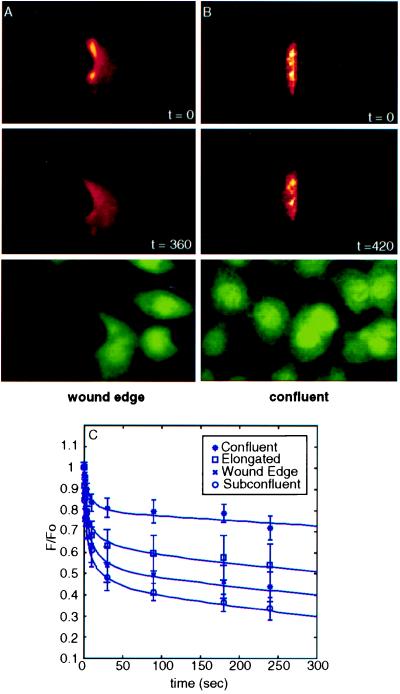
The evolution of fluorescence in photoactivated or photobleached bands of actin depends on the diffusivity of actin monomer, the fraction of total actin in filamentous form, and the lifetime of actin filaments (19, 28). We have developed a mathematical model describing how these parameters influence fluorescence evolution in PAF or FRAP (28), which we employ here to interpret data. Although the evolution of fluorescence is a complicated function of these parameters, its dependence simplifies when monomer diffusion occurs much faster than filament turnover, the general condition that exists in endothelial cells (29). Consequently, in PAF experiments (Fig. 2), the rapid decay of fluorescence that occurs after photoactivation is primarily associated with monomer diffusion. This phase is followed by a slower decay primarily because of filament turnover. The distribution of fluorescence between the fast and slow phases determines the fraction of actin polymerized.
Figure 2.
Photoactivation of fluorescent actin. PAF images sequence demonstrating different actin dynamics in cells in the wound edge (A) and cobblestone regions (B) of a recovering BAEC monolayer. Cells throughout the monolayer were microinjected with caged-fluorescent actin and photoactivated locally as previously described (19). Times (in s) after photoactivation are indicated. Intravital fluorescence staining of all cells in the lower panels shows the overall cell morphology at the wound edge (polarized) and in the wound interior (polygonal). (C) Fluorescence decay in the four morphologies of Fig. 1. The rapid early decay is attributed to monomer diffusion and the late decay to filament turnover. Subconfluent BAECs were characterized in a previous study (19). Error bars are SEMs with 11 < n < 30.
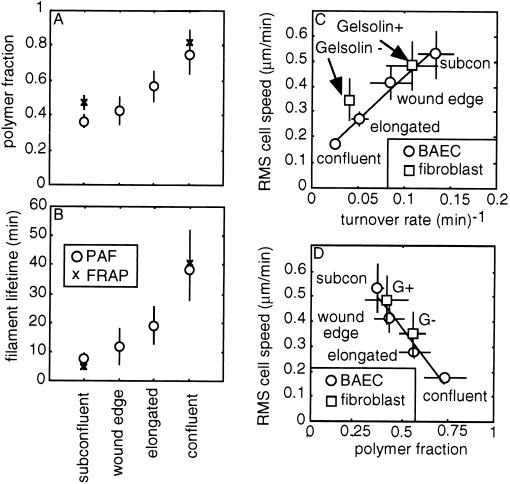
PAF experiments reveal differences in the actin cycle of the BAEC phenotypes found in wounded monolayers (Figs. 2 and 3 A and B). The characteristic filament lifetime is 38.9 ± 11.4 (n = 11) min in confluent cells and decreases to 11.7 ± 6.0 (n = 14) min in wound-edge cells. The fraction of actin polymerized is 0.73 ± 0.11 in confluent cells and decreases to 0.42 ± 0.08 in wound-edge cells. Values for elongated cells are intermediate to these (polymer fraction = 0.57 ± 0.09; filament lifetime 19.0 ± 6.4 min; n = 13), and wound-edge values are similar to those obtained previously in subconfluent BAECs (polymer fraction = 0.36 ± 0.04; filament lifetime = 7.5 ± 2 min; n = 17) (19). Experiments conducted in fully confluent and subconfluent cells with FRAP give similar results to PAF experiments (Fig. 3 A and B); the comparison between PAF and FRAP controls for photobleaching and artifacts arising from the derivatization of monomer (30).
Figure 3.
Cellular actin dynamics correlate with BAEC morphology and speed. Correlation of polymer fraction (A) and filament lifetime (B) with the BAEC morphologies found in wounded monolayers. Decay curves such as in Fig. 2 were analyzed with a mathematical model of these experiments (28). FRAP experiments are an independent check on the extreme cases and control for photobleaching and other artifacts (19). Correlation of rms cell speed (Fig. 1) with turnover rate (C) and polymer fraction (D). Fibroblasts lacking gelsolin have trends similar to those seen with the BAEC phenotypes.
The dynamic state of actin correlates with the speed of the various endothelial cell phenotypes (Fig. 3 C and D). First, the turnover rate (the reciprocal of the average filament lifetime) of actin filaments in BAECs correlates positively with rms cell speeds (Fig. 3C). Although previous studies of filament turnover demonstrate that highly motile keratocytes turn over actin filaments in lamellipodia 10 times faster than less motile fibroblasts (16–18), the results here show that individual cells can accelerate filament turnover to increase steady-state motility. Second, cell speed inversely correlates with the fraction of actin polymerized (Fig. 3D). A decrease in polymerized fraction with accelerated filament turnover is the theoretically predicted signature of cofilin-mediated disassembly (31). Also, a 30% decrease in monomer mobility occurs concurrently with a 2-fold increase in polymer fraction (data not shown). Sensitivity to the amount of polymerized actin is not expected for the diffusion of sequestered monomer, which is many times smaller than filamentous pores (32). The result may indicate that small actin filaments are components of the diffusive population.
PAF experiments conducted in gelsolin knockout and wild-type mouse fibroblasts reveal a proportionality between cell speed and actin turnovers strikingly similar to that observed in wounded BAEC monolayers (Fig. 3 C and D). The slower gelsolin null cells have longer-lived filaments (25 min ± 6.14; n = 14) and a greater fraction of actin polymerized (≈55 ± 7%) than the faster gelsolin-positive phenotype (9.28 ± 4.7 min filament lifetime; ≈41 ± 11% polymer fraction; n = 11; P < 0.02). The PAF estimates of polymer fraction are in good agreement with SDS/PAGE analysis of Triton soluble and insoluble cell fractions (53% polymer fraction gelsolin+; 40% polymer fraction gelsolin−) (20).
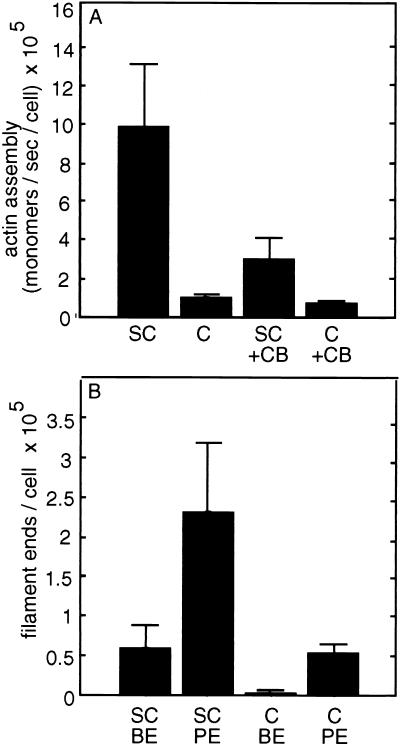
Permeabilized subconfluent endothelial cells nucleate pyrene actin ≈10 times more effectively than permeabilized confluent endothelial cells, and exhibit a greater sensitivity to the barbed-end blocking reagent cytochalasin B (Fig. 4). From the published rate of pointed end monomer assembly (33), the number of free pointed ends contributing to nucleation in the presence of cytochalasin is estimable (24, 34). Similarly, the difference between nucleation with and without cytochalasin determines the number of free barbed ends. By this approach, subconfluent cells have 231,000 ± 86,700 free pointed ends per cell and 59,400 ± 29,100 free barbed ends per cell. Confluent endothelial cells have 53,800 ± 12,300 free pointed ends per cell and 3,080 ± 1,280 free barbed ends per cell. Assuming that the number of free pointed ends is equivalent to the total number of filaments (24, 34), the fraction of barbed ends exposed increases from 5.6 ± 1.6% in confluent cells to 30.8 ± 15% in subconfluent cells. (For all filament end comparisons P < 0.01.) With the recognition that Arp2/3 can cap filament pointed ends (35), the assumption that all pointed ends are free may underestimate filament number.
Figure 4.
Filament content of subconfluent and confluent BAECs. Permeabilized subconfluent (SC) and confluent (C) BAECs nucleate pyrene-labeled actin on their exposed filament ends at different rates. (A) Subconfluent BAECs more effectively nucleate monomer and are more sensitive to cytochalasin B (CB). The initial rates of polymerization are extracted and divided by the number of contributing cells. (B) Subconfluent BAECs have more free barbed ends (BE) and more free pointed ends (PE) than confluent BAECs. These results are averages of more than 20 experiments per cell condition.
Triton soluble and insoluble cell fractions provide standard biochemical definitions of unpolymerized and polymerized cellular actin, respectively (36). Densitometric measurements of Coomassie-stained SDS/PAGE gels indicate that 58 ± 6% of endothelial actin is Triton insoluble in confluent and 46 ± 6% is Triton insoluble in the subconfluent cells, a modest agreement with the PAF/FRAP estimates in intact cells (n = 3; P < 0.01). Collectively, the soluble and insoluble fractions indicate that confluent endothelial cells have slightly less actin than subconfluent endothelial cells (6.6 ± 1.4 pg actin/cell vs. 8.5 ± 0.6 pg actin/cell; ≈ 60 pg total protein for both phenotypes). Assuming all cells studied have similar cytoplasmic volumes (2 pl geometric estimate), the filament numbers calculated from the pyrene assay combined with the estimates of total actin and the PAF/FRAP calculations of polymer fraction determine an average filament length of ≈3 μm for the confluent and ≈0.5 μm for subconfluent cells.
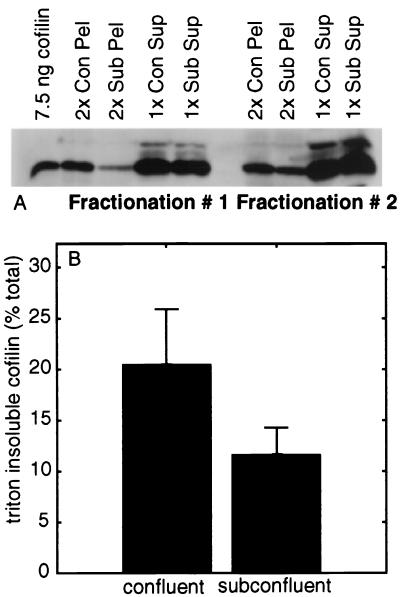
Immunoblot analysis of the same subcellular fractions used for actin quantitation shows ≈2-fold less filament-bound cofilin in subconfluent cells compared with confluent cells (Fig. 5, confluent: 20.5 ± 5.4%; subconfluent: 11.4 ± 2.7%; n = 6; P < 0.01). Cofilin binds to ADP F-actin subunits with two orders-of-magnitude greater affinity than it does to ATP and ADP⋅Pi-bound subunits in vitro (8). The lifetime of filaments measured in subconfluent endothelial cells (≈7 min) is comparable to the lifetime of the ADP⋅Pi intermediate in ATP hydrolysis on actin filaments in vitro (≈3 min) (8). Thus, the reduction in F-actin-bound cofilin in migratory cells compared with long-lived filaments (≈40 min) in confluent cells is consistent with the predicted lower ADP content of F-actin that should accompany more rapid filament turnover. The results also suggest that enhancement of cofilin's ability to bind ADP filament subunits by dephosphorylation in vitro (37) may not be required for the observed changes in actin turnover in different cells.
Figure 5.
Partition of cofilin into Triton soluble and insoluble pools in endothelial cells. (A) Immunoblot of Triton soluble and insoluble cofilin. (B) Quantitation of three immunoblots as in A gives a 2-fold increase in the fraction of cofilin associated with filaments in confluent cells when compared with subconfluent cells. BAECs were grown to a desired density on plastic dishes and lysed in a Triton-lysis buffer. Lysates were collected after scraping culture dishes, and Triton soluble and insoluble actin was separated by centrifugation at 100,000 × g. The total protein of the two phenotypes was matched on the gels shown.
Discussion
In light of previous information that fast-moving keratocytes cycle actin more rapidly than slow-moving fibroblasts, the shortening of F-actin turnover in moving regions of wounded endothelial cell monolayers is not surprising (16). However, considering the complexity of steps contributing to the mobilization of cells nearest to the free wound edge, such as stimulus sensing and processing, signal transduction cascades, regulation of cell–cell and cell substrate adhesion in addition to the control of actin-binding proteins, the striking proportionality found between cell translocation speeds, actin turnover, and related parameters even in different cell types is remarkable. The proportionality holds for values reported here (Fig. 3D) and is within a factor of two of values reported by others (16, 17, 38). It breaks down, however, in cells missing filamin A, which is required for locomotion (39) and in which actin turnover is relatively high in the absence of cell translocation (J.M., unpublished observations), implying that actin cycling rates define the upper limit for crawling rates of cells on particular substrates. The reported actin turnovers and other parameters are average values for the entire cells or cell populations and therefore do not resolve what happens in the most actively motile domains of a cell. Nevertheless, the bulk assays used in this report do detect significant differences between slow- and fast-moving cells. Either the assayed activities differ significantly over the cell volume or are so greatly different locally that their signals withstand dilution.
One proposed mechanism to explain actin cycling associated with cell crawling movements is a simple treadmill on linear (40, 41) or branched (42) filament arrays in the cell periphery. Acceleration of such treadmills, however, would not explain the different actin filament length or actin filament fraction profiles in slow and fast cells. A way to increase filament number, free ends, and shorten actin filament length is necessary to explain these distributions. Binding of ADF/cofilin to actin filaments, believed to be a prerequisite for acceleration of depolymerization (42), decreased rather than increased in fast-moving cells with high actin cycling rates. The simplest explanation for this finding is that the lifetime of actin filaments in slow-moving confluent cells (≈40 min) greatly exceeds that of the ADP-Pi intermediate state of adenine nucleotide bound to F-actin, meaning that the predominant nucleotide on slow cycling actin filaments is ADP, the preferred substrate for ADF/cofilin binding. The shorter survival of actin filaments in subconfluent cells means they have fewer ADP-bound F-actin subunits. In this scheme, turnover and depolymerization correlate positively because of cofilin-mediated disassembly as described by others (31, 43), but exposure of pointed ends rather than a forced translocation of cofilin to filaments is responsible. De novo nucleation of actin subunits to initiate new filaments with free barbed ends coupled with accelerated pointed end depolymerization by stimulation of confluent cells could lead to the changes in filament length and number distributions observed in subconfluent compared with slow-moving cells. The current leading theory regarding de novo nucleation, however, posits induction of assembly by Arp2/3 complex bound to the sides of preexisting filaments (35, 44). This mechanism should generate a branching treadmill structure (42), but because of filament crosslinking and pointed end capping by the Arp2/3 complex (35), the filament length distribution would not shorten, and the new filament ends created would not be available for accelerated depolymerization. Moreover, cofilin binding to actin filaments, generally assumed to be necessary for accelerated depolymerization, is not observable at the very leading cell edge where de novo nucleation is proposed to take place (42).
We favor a mechanism in which actin filament severing creates pointed ends for accelerated depolymerization. Severed filament barbed ends can also serve as nuclei for elongation, with or without intermediary capping. Such severing mediated by gelsolin is demonstrable in platelets undergoing shape changes (24) and in growth factor-stimulated fibroblasts and smooth muscle cells (45). The expression of gelsolin in fibroblasts increases cell speed in proportion to changes in actin parameters consistent with severing facilitating accelerated depolymerization of actin. Gelsolin knockout fibroblasts nevertheless crawl and cycle actin, implying that, as claimed by some investigators, ADF/cofilin alone or ADF/cofilin with cellular cofactors (10) can sever actin filaments as well as accelerate pointed-end depolymerization.
Acknowledgments
We thank Drs. Michael Gimbrone and Keith Anderson for supplying BAECs, Dr. Toshifumi Azuma for isolating gelsolin null and wild-type fibroblasts, and Yu Kuang for help with cell tracking to determine motility rates. We thank Dr. Peter Marks for the cofilin antibody. This work was supported by National Institutes of Health Grant HL54145 (to J.H.H. and C.F.D.). J.L.M. and E.A.O. are Whitaker Foundation Graduate Fellows.
Abbreviations
- PAF
photoactivation fluorescence
- FRAP
fluorescence recovery after photobleaching
- BAEC
bovine aortic endothelial cell
- ADF
actin depolymerizing factor
Footnotes
This paper was submitted directly (Track II) to the PNAS office.
Article published online before print: Proc. Natl. Acad. Sci. USA, 10.1073/pnas.100023397.
Article and publication date are at www.pnas.org/cgi/doi/10.1073/pnas.100023397
References
- 1.Horwitz A, Parsons J. Science. 1999;286:1102–1103. doi: 10.1126/science.286.5442.1102. [DOI] [PubMed] [Google Scholar]
- 2.Lauffenberger D, Horwitz A. Cell. 1996;84:359–369. doi: 10.1016/s0092-8674(00)81280-5. [DOI] [PubMed] [Google Scholar]
- 3.Wegner A. J Mol Biol. 1976;108:139–150. doi: 10.1016/s0022-2836(76)80100-3. [DOI] [PubMed] [Google Scholar]
- 4.Sun H, Yamamoto M, Mejillano M, Yin H. J Biol Chem. 1999;274:33179–33182. doi: 10.1074/jbc.274.47.33179. [DOI] [PubMed] [Google Scholar]
- 5.Bamburg J. Annu Rev Cell Dev. 1999;15:185–230. doi: 10.1146/annurev.cellbio.15.1.185. [DOI] [PubMed] [Google Scholar]
- 6.Carlier M, Ressad F, Pantaloni D. J Biol Chem. 1999;274:33824–33830. doi: 10.1074/jbc.274.48.33827. [DOI] [PubMed] [Google Scholar]
- 7.Morgan T E, Lockerbie R O, Minamide L S, Browning M D, Bamburg J R. J Cell Biol. 1993;122:623–633. doi: 10.1083/jcb.122.3.623. [DOI] [PMC free article] [PubMed] [Google Scholar]
- 8.Carlier M-F, Laurent V, Santolini J, Melki R, Didry D, Xia G-X, Hong Y, Chua N-H, Pantaloni D. J Cell Biol. 1997;136:1307–1322. doi: 10.1083/jcb.136.6.1307. [DOI] [PMC free article] [PubMed] [Google Scholar]
- 9.Magnus K A, Maciver S K, Pollard T D. J Biol Chem. 1988;263:18143–18144. [PubMed] [Google Scholar]
- 10.Maciver S, Zot H, Pollard T. J Cell Biol. 1991;115:1611–1620. doi: 10.1083/jcb.115.6.1611. [DOI] [PMC free article] [PubMed] [Google Scholar]
- 11.Sun H Q, Yamamoto M, Mejillano M, Yin H L. J Biol Chem. 1999;274:33179–33182. doi: 10.1074/jbc.274.47.33179. [DOI] [PubMed] [Google Scholar]
- 12.Yin H, Hartwig J, Marayama K, Stossel T. J Biol Chem. 1981;256:9693–9697. [PubMed] [Google Scholar]
- 13.Meerschaert K, De Corte V, De Ville Y, Vandekerckhove J, Gettemans J. EMBO J. 1998;17:5923–5932. doi: 10.1093/emboj/17.20.5923. [DOI] [PMC free article] [PubMed] [Google Scholar]
- 14.Qiao L Y, Goldberg J L, Russell J C, Sun X J. J Biol Chem. 1999;274:10625–10632. doi: 10.1074/jbc.274.15.10625. [DOI] [PubMed] [Google Scholar]
- 15.Howard T, Chaponnier C, Yin H, Stossel T. J Cell Biol. 1990;110:1983–1991. doi: 10.1083/jcb.110.6.1983. [DOI] [PMC free article] [PubMed] [Google Scholar]
- 16.Theriot J, Mitchison T. Nature (London) 1991;352:126–131. doi: 10.1038/352126a0. [DOI] [PubMed] [Google Scholar]
- 17.Kreis T E, Geiger B, Schlessinger B. Cell. 1982;29:835–845. doi: 10.1016/0092-8674(82)90445-7. [DOI] [PubMed] [Google Scholar]
- 18.Theriot J, Mitchison T. J Cell Biol. 1992;118:367–377. doi: 10.1083/jcb.119.2.367. [DOI] [PMC free article] [PubMed] [Google Scholar]
- 19.McGrath J L, Tardy Y, Dewey C F, Jr, Meister J J, Hartwig J H. Biophys J. 1998;75:2070–2078. doi: 10.1016/S0006-3495(98)77649-0. [DOI] [PMC free article] [PubMed] [Google Scholar]
- 20.Witke W, Sharpe A, Hartwig J, Azuma T, Stossel T, Kwiatkowski D. Cell. 1995;81:41–51. doi: 10.1016/0092-8674(95)90369-0. [DOI] [PubMed] [Google Scholar]
- 21.Othmer H, Dunbar S, Alt W. J Math Biol. 1988;26:263–298. doi: 10.1007/BF00277392. [DOI] [PubMed] [Google Scholar]
- 22.Hartwig J, Bokoch G, Carpenter C, Janmey P, Taylor L, Toker A, Stossel T. Cell. 1995;82:643–653. doi: 10.1016/0092-8674(95)90036-5. [DOI] [PubMed] [Google Scholar]
- 23.Schliwa M, van Blerkom J, Porter K. Proc Natl Acad Sci USA. 1981;78:4329–4333. doi: 10.1073/pnas.78.7.4329. [DOI] [PMC free article] [PubMed] [Google Scholar]
- 24.Hartwig J. J Cell Biol. 1992;118:1421–1442. doi: 10.1083/jcb.118.6.1421. [DOI] [PMC free article] [PubMed] [Google Scholar]
- 25.Dewey C J, Bussolari S, Gimbrone M J, Davies P. J Biomech Eng. 1981;103:177–185. doi: 10.1115/1.3138276. [DOI] [PubMed] [Google Scholar]
- 26.Gotlieb A, Spector W, Wong M, Lacey C. Arteriosclerosis. 1983;4:91–96. doi: 10.1161/01.atv.4.2.91. [DOI] [PubMed] [Google Scholar]
- 27.Haudenschild C, Harris-Hooker S. In: Biology of Endothelial Cells. Jaffe E, editor. Martinus Nijhoff; 1984. pp. 74–86. [Google Scholar]
- 28.Tardy Y, McGrath J L, Hartwig J H, Dewey C F. Biophys J. 1995;69:1674–1682. doi: 10.1016/S0006-3495(95)80085-8. [DOI] [PMC free article] [PubMed] [Google Scholar]
- 29.McGrath J, Tardy Y, Dewey C, Jr, Meister J, Hartwig J. Biophys J. 1998;75:2070–2078. doi: 10.1016/S0006-3495(98)77649-0. [DOI] [PMC free article] [PubMed] [Google Scholar]
- 30.McGrath J L, Hartwig J H, Tardy Y, Dewey C F., Jr Microsc Res Tech. 1998;43:385–394. doi: 10.1002/(SICI)1097-0029(19981201)43:5<385::AID-JEMT5>3.0.CO;2-Z. [DOI] [PubMed] [Google Scholar]
- 31.Carlier M. Curr Opin Cell Biol. 1998;10:45–51. doi: 10.1016/s0955-0674(98)80085-9. [DOI] [PubMed] [Google Scholar]
- 32.Luby-Phelps K, Lanni F, Taylor D. Annu Rev Biophys Biophys Chem. 1988;17:369–396. doi: 10.1146/annurev.bb.17.060188.002101. [DOI] [PubMed] [Google Scholar]
- 33.Pollard T. J Cell Biol. 1986;103:2747–2754. doi: 10.1083/jcb.103.6.2747. [DOI] [PMC free article] [PubMed] [Google Scholar]
- 34.Cano M, Lauffenburger D, Zigmond S. J Cell Biol. 1991;115:677–687. doi: 10.1083/jcb.115.3.677. [DOI] [PMC free article] [PubMed] [Google Scholar]
- 35.Mullins R, Heuser J, Pollard T. Proc Natl Acad Sci USA. 1998;95:6181–6186. doi: 10.1073/pnas.95.11.6181. [DOI] [PMC free article] [PubMed] [Google Scholar]
- 36.Bray D, Thomas C. J Mol Biol. 1976;16:1055–1069. doi: 10.1016/0022-2836(76)90233-3. [DOI] [PubMed] [Google Scholar]
- 37.Moon A, Drubin D. Mol Biol Cell. 1995;6:1423–1431. doi: 10.1091/mbc.6.11.1423. [DOI] [PMC free article] [PubMed] [Google Scholar]
- 38.Kreis T, Geiger B, Schlessinger J. Cell. 1982;29:835–845. doi: 10.1016/0092-8674(82)90445-7. [DOI] [PubMed] [Google Scholar]
- 39.Cunningham C, Gorlin J, Kwiatkowski D, Hartwig J, Janmey P, Byers H, Stossel T. Science. 1992;255:325–327. doi: 10.1126/science.1549777. [DOI] [PubMed] [Google Scholar]
- 40.Small J, Herzog M, Anderson K. J Cell Biol. 1995;129:1275–1286. doi: 10.1083/jcb.129.5.1275. [DOI] [PMC free article] [PubMed] [Google Scholar]
- 41.Small J. Curr Opin Cell Biol. 1989;1:75–79. doi: 10.1016/s0955-0674(89)80040-7. [DOI] [PubMed] [Google Scholar]
- 42.Svitkina T, Borisy G. J Cell Biol. 1999;145:1009–1026. doi: 10.1083/jcb.145.5.1009. [DOI] [PMC free article] [PubMed] [Google Scholar]
- 43.Didry D, Carlier M, Pantaloni D. J Biol Chem. 1998;273:25602–25611. doi: 10.1074/jbc.273.40.25602. [DOI] [PubMed] [Google Scholar]
- 44.Machesky, L., Mullins, R., Higgs, H., Kaiser, D., Blanchoin, L., May, R., Hall, M. & Pollard, T. (1999) Proc. Natl. Acad. Sci. USA96. [DOI] [PMC free article] [PubMed]
- 45.Azuma T, Witke W, Stossel T, Hartwig J, Kwiatkowski D. EMBO J. 1998;17:1362–1370. doi: 10.1093/emboj/17.5.1362. [DOI] [PMC free article] [PubMed] [Google Scholar]


