Abstract
Until now a stable long-lived electronanopore could be generated in a lipid membrane only under current-clamp conditions, and stochastic properties of a single nanopore have been studied by the chronopotentiometry. The current-clamp experiment introduces negative feedback, which could be responsible for the electropore fluctuations and observed 1/f B power spectrum. A new electroporation method, chronoamperometry after current clamp (CACC), prevents irreversible rupture of the membrane and eliminates the feedback by clamping the voltage after previous electroporation. The experiments show that the electropore size can also be stabilized under constant potential. The electropore fluctuations do not need feedback to appear. The fluctuations are self-similar with a short memory. CACC provides an effective tool for studying the natural dynamics of an electropore in various environments, which was tested with Na+ and Al3+ ions. Comparison between chronopotentiometry and CACC reveals that the feedback mainly shortens the memory of the stochastic fluctuations. Statistical analysis shows that the conductance fluctuations can be approximately modeled as a fractional Lévy stable motion for a small hydrophilic electropore, which tends to fractional Brownian motion when the electropore increases its size. A hypothesis is presented that this transition reflects a more regular shape of big nanopores.
INTRODUCTION
A high electric field applied on the lipid membrane induces hydrophobic prepores, expanding into hydrophilic electropores, where lipid molecules expose their heads to the interior of the pore and allow for a free flow of ions (Fig. 1) (1–4). The electroporated membrane is permeable for the molecules used in cancer therapy, which laid the foundation for electrochemotherapy. Electrochemotherapy has become a very promising antitumor treatment method that allows for direct application of drugs into the cell and significantly enhances the drug uptake (e.g., 5–8). However, to date, the phenomenon of electroporation is still very poorly understood, which limits taking full advantage of this method. The mechanism of generating a conducting pore is not sufficiently explored. Very little is known about the pore dynamics, sensitivity to the environment, and the electropore shape. Some features of the electropore can be observed indirectly, but others, like natural dynamics of the electropore and its shape, are only postulated or inferred from computer simulations. New experimental methods are needed to assist models and simulations.
FIGURE 1.
Three main stages of the electropore formation (intact membrane, hydrophobic prepore, and a hydrophilic pore where ion flow is possible) are depicted from left to right.
Typically, electroporation of the lipid membrane is achieved by short and ultrashort (9) electric pulses; the effectiveness of applying various periodic signals is under study (10). Electroporation under voltage-clamp conditions results in irreversible breakdown of the membrane if the potential value is sufficient to form a hydrophilic pore. This experimental observation is consistent with molecular dynamics (MD) simulations. MD shows expansion of the electropore, leading to the membrane rupture when the electropore expands beyond a critical radius, Rc (11–13).
A value of the critical radius can be calculated from the membrane free energy change, which keeps decreasing when the electropore size is above critical. Classically, the change of the membrane free energy, due to the appearance of the cylindrical electropore with a radius, r, induced by transmembrane potential, U, can be approximated as (1):
 |
(1) |
Here η is line tension opposing electroporation, and Γ is surface tension decreasing the energetic barrier and facilitating electroporation. Change of the pore's specific capacitance, resulting from displacement of lipids by water molecules, is represented by CLW,
 |
(2) |
where ɛw and ɛm are permittivities of water and lipid membrane, respectively, and C0 is the membrane capacitance per area. There are modifications of the classical energy models, e.g., those proposed by Neu and Krassowska (14) or Pastushenko and Chizmadzhev (15) showing the possibility of existence of a stabilized electropore.
Another possible method of electroporation, which does not expose the membrane to the danger of its rapid break, is electroporation under current-clamp conditions (16,17). Until now, to my knowledge, it has been the only method which creates a very long-lived hydrophilic nanopore maintaining approximately the same medium size. Data collected from current-controlled experiment by chronopotentiometry (ChP) allow for studying the stochastic properties of the long-lived electropore, which are related to the dynamics of the lipid molecules and show the influence of the environment (18,19). The results from ChP may also be applied for modeling the electroporated cell in vivo where ionic pumps provide a current source of the limited efficiency (20). In ChP under current-clamp, the membrane stability is maintained by a negative feedback, which keeps the electropore within a safe size limit. When the electropore grows excessively, the transmembrane potential drops. Consequently, the electropore whose size is potential dependent decreases, and the conductivity of the electropore is reduced. When the membrane potential grows, the electropore is likely to increase its size again. This sequence of events produces fluctuations of the electropore. The experiments showed self-scaling properties of the fluctuations with power spectrum density 1/f B (21,22), where the exponent B depends on the membrane environment (22,23). This dependence may reflect sensitivity of the electropore dynamics to the environment, such as ionic strength and electrolyte and membrane composition (24). It is worth noting that self-scaling properties in current fluctuations have also been reported for artificial nanopores (25) and protein ionic channels (26,27) studied at constant voltage. A mechanism of this phenomenon is still debatable.
Self-scaling properties of a stochastic process are demonstrated by power-law dependence in the periodogram. Quantitatively, the scaling is characterized by the value of the exponent B. A time series with the scaling property and B > 1 may indicate a self-similar stochastic process. Self-similar stochastic processes, introduced by Lamperti (28), are scale invariant. It means that the rescaled process is statistically indistinguishable from the original process:
 |
(3) |
where H > 0 is a self-similarity index and  denotes equality of all finite-dimensional distributions of the process.
The best-known self-similar process is fractional Brownian motion (fBm), which is a Gaussian self-similar process with stationary increments (29). It can be obtained as a sum of fractional Gaussian noises (fGn). The power spectrum density function of fGn obeys power-law. Brownian motion is a special case of fBm if H = 0.5. Introducing a more general class of stable self-similar processes extended the idea of fractional motions to non-Gaussian stochastic processes. In the fractional Lévy stable motion (FLSM) the distribution is Lévy stable, as discussed below (30,31). Such a self-similar process  is nonstationary and it can be represented as (32)
 |
(4) |
where Zα (u) is a symmetric Lévy α-stable motion and α is the stability index of α-stable distribution. The increment process of FLSM is stationary and it is called a fractional stable noise (FSN). Stationarity of the increments, expected in FLSM, yields
 |
(5) |
A class of α-stable distributions was discovered by Paul Lévy as a result of his study on the sums of independent and identically distributed (i.i.d.) random processes. The distributions have scaling properties—a sum of i.i.d. random variables maintains the same shape of the distribution. Only a few stable distributions have direct formulas for their probability density function (PDF), usually only the characteristic function is given. Distinctive properties of α-stable distributions are their long tails and infinite variance. Gaussian distribution is the only stable distribution without long tails. A stable distribution is characterized by four parameters: α is the stability index, α ∈ (0,2] (α < 2 if the distribution has no finite variance, α < 1 if there is no finite expected value, α = 2 stands for the Gaussian distribution); β represents skewness, β ∈ [−1,1]; γ is a scaling parameter, γ ∈ (0,∞); and δ is a location parameter, δ ∈ (−∞,∞). For Gaussian distribution FLSM becomes fBm.
The self-similarity index H characterizes fractal properties of the self-scaling process and the autocovariance or codifference function for processes with infinite variance (33). There are several methods to obtain the self-similarity index. Estimation by the rescaled range analysis (R/S) proposed by Hurst (34) is a very popular method. Another commonly used technique is based on the value of the exponent B from the periodogram (27,35):
 |
(6) |
The range of dependence in the time series is expressed by memory d of the process, which is given by the relation of the self-similarity index H to the stability index α:
 |
(7) |
If d > 0 the process has a long memory (shown by the codifference function), d = 0 indicates a random process without memory, and d < 0 reveals a process with a short memory (33). In the last case, the process generates an antipersistent time series where each increase of the value is more likely to be followed by a decrease, and a decrease by a subsequent increase.
Although current-clamp conditions allow maintaining the electroporated membrane under control for a long time, the strong feedback affects the results and distorts the electropore dynamics. It is not certain if the power spectrum 1/f B, observed from ChP, results from the inherent dynamics of the electropore or if it should be linked to the feedback instead. We do not know what the contribution from the feedback is and what would be the natural (i.e., without feedback) dynamics of the electropore. Moreover, the fluctuating potential across the membrane increases capacitance current resulting from charging and discharging of the membrane, whose exact value is difficult to estimate and depends on the membrane capacitance varying during the experiment. Hence, it is not known if ChP provides an adequate tool to study dynamical properties of the membranes in various environments. Finally, based on the results obtained from ChP, it is very difficult to formulate a model which could improve our understanding of the phenomena during electroporation without deeper knowledge of the feedback.
The observation that only the very moment of creating a hydrophilic electropore is critical for the membrane stability, reported in this work, allowed introducing a new experimental method chronoamperometry after current clamp (CACC) electroporation, combining advantages of the current-clamp and voltage-clamp approaches. The CACC electroporation eliminates the feedback, preserving a long-lasting hydrophilic nanopore whose natural dynamics is not blurred. The stochastic analysis of the nanopore conductance obtained from CACC shows that fluctuations with self-scaling properties are also maintained without feedback. The method provides quantitative information on the electropore evolution and gives new insight into the processes contributing to electroporation, the electropore dynamics, and possibly its shape.
METHODS AND MATERIALS
CACC electroporation—a method to study natural dynamics of the electropore
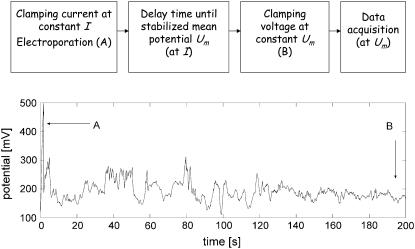
The CACC electroporation, presented in Fig. 2, includes two stages of the experiment. At the first stage, the hydrophilic pore is created and stabilized. This stage is critical for membrane stability—it is not possible to maintain a stable membrane and obtain a long-lived electropore without strict control over the applied electrical signal. Introducing negative feedback, as in current-clamp experiments, gently creates a stable hydrophilic pore. Therefore, at the first stage of CACC the current is clamped. The hydrophilic electropore appears when the transmembrane potential reaches the critical breakdown value UB (Fig. 2 A). The appearance of the hydrophilic electropore is manifested by a sudden drop of the potential to the value below the critical breakdown potential UB as soon as the first electropore is created, impeding further electroporation and appearance of the subsequent electropores. Then, the electropore stabilizes its size for ∼100–200 s, still at constant current I. The resulting fluctuations of the potential are monitored. When the average potential value in the fluctuations stabilizes around a mean value, Um, an experimenter switches off the current source and instantaneously clamps the potential (Fig. 2 B), starting the second stage of the experiment in which CACC data are recorded (Fig. 3). It is important that the potential value U was set close to Um, and U < UB. At values of the potential that are too low, the electropore gradually closes. On the other hand, potentials that are too high endanger the membrane stability and do not create a stable nanopore. As a result, the experimenter obtains a long-lived electropore with a fairly stable conductance, close to the conductance achieved at the current-clamp stage of the experiment.
FIGURE 2.
Schematic of the CACC electroporation (upper panel) and the first stage of CACC in which the membrane is electroporated under current-clamp conditions (bottom panel). The electropore is formed at A and the experiment is switched from current-clamp to voltage-clamp at B.
FIGURE 3.
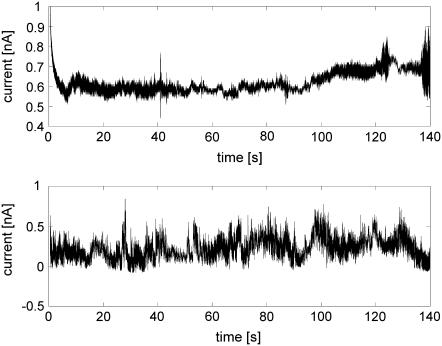
Current fluctuations in the second stage of CACC (voltage clamp) for 1.5 M AlCl3 (upper panel) and 2 M NaCl (bottom panel).
Chemicals and measurements
Egg yolk phosphatidylcholine (PC) was obtained from Fluka (Buchs, Switzerland), analytical-grade NaCl, hexahydrate AlCl3 obtained from POCH (Gliwice, Poland), and n-decane from Aldrich (Gillinghem-Dorset, UK). The chemicals were used without additional purification. The electrolytes with NaCl were buffered with 0.01 M HEPES (Aldrich) to pH = 7.0.
The experiments were performed on planar lipid bilayer membranes formed by the Mueller-Rudin method (36) in a round aperture, 1.0 mm in diameter, in two Teflon hydrophobic septum separated cells, each filled with 8 ml of electrolyte. The experiments were performed at temperature T = 20.5 ± 1°C. The forming solution contained PC dissolved in n-decane (20 mg/ml). Measurements were performed with a four-electrode (Ag/AgCl) capacitance meter and potentiostat-galvanostat described in Kalinowski and Figaszewski (37), controlled by dedicated computer software. The process of membrane formation was monitored by changes of the membrane capacitance. Since the membrane capacitance, C, rises when the bilayer is forming, it was assumed that the membrane was fully formed when the curve saturated and the drift ΔC < 10 pF/min. Electroporation was carried out by means of the CACC method, data were sampled with fs = 100 Hz, the measurement accuracy was 2%, applied constant voltage U ≤ 300 mV. Both stages of CACC were performed for ∼150–200 s each.
The comparative CACC experiments were carried out for various concentrations of NaCl and AlCl3 so that it could be compared to the effect of sodium ions, natural in the physiological environment of the membrane, and aluminum ions whose very strong affinity to lipid membranes has been reported (38) and which has a strongly stabilizing effect on the electropores. The measured value of the conductivity for AlCl3 was verified with the results reported in Vila et al. (39).
Numerical methods
Two sets of data were recorded during experiments. At the first stage, when the nanopore was initialized and stabilizing under current-clamp conditions, the classical ChP method was executed to obtain the control data. For the data from ChP, conductivity G of the membrane with the nanopore was calculated as
 |
(8) |
where I is the value of the clamped current and ic estimates capacitance current resulting from the spontaneous change of the potential U, described as
 |
(9) |
The membrane capacitance C was represented by the value measured before electroporation at the potential 100 mV. Note that this method gives only an approximate value of the capacitance current since the exact membrane capacitance, C, at each moment of the experiment is not known. Also, the component of the capacitance current resulting from fluctuations of the membrane capacitance was neglected. At the second stage of the experiment, the target CACC data were recorded under voltage-clamp conditions. Here, the conductance of the electroporated membrane was directly obtained from the measured current values divided by the applied potential. Due to the constant voltage, the capacitance current in CACC electroporation is less significant, resulting only from the fluctuations of the membrane capacitance. Therefore CACC electroporation gives more accurate values of the conductance. However, the capacitance current cannot be eliminated completely, which may result in negative values of the measured current when the pore closes and the membrane capacitance rises.
Pore size was roughly approximated based on the relation for a conductance, G, of a cylindrical pore with radius, r, in the membrane with the thickness, dm (dm ≈ 7 nm), filled with the electrolyte of the conductivity, g, assumed the same for the bulk and pore:
 |
(10) |
The possible contribution of ion-pore wall interaction, affecting ion concentration inside the pore and consequently the pore conductivity, g, has been neglected. Therefore, based on the spectrometric study on electroporated lipid vesicles (40), the pore size may be underestimated.
Mathematical calculations, modeling, and visualization were performed by software based on MATLAB 6.5 (The MathWorks, Natick, MA). Periodograms S(f) were calculated using Welch's averaged, modified periodogram method implemented in MATLAB 6.5. By default, in this method, the time series is divided into eight sections with 50% overlap, each section is windowed with a Hamming window, and eight modified periodograms are computed and averaged. Periodograms obtained by the Welch method were compared with periodograms obtained by the standard periodogram method to verify that there was no significant difference. The value of exponent B in periodogram was obtained from the double logarithmic representation by the least squares method. Since the data are nonstationary, the exponent was also calculated for the differenced data (with step 2). In accordance with the method presented in Eke et al. (35), the value obtained this way was then enlarged by 2 and compared with B from the original data. This way B was acquired from periodograms of the stationary data.
The self-similarity index, H, was calculated from exponent B according to Eq. 6, which allowed for individual choice of the frequency limit where scaling properties could be observed. Memory of the process was calculated based on Eq. 7. General amplitude of the fluctuations was represented by S1, obtained at 1 Hz on the original data
 |
(11) |
Statistical analysis was performed on conductance increments obtained from the differenced conductance time series. The number of bins in histograms was assumed to be the square root of the total series length. The hypothesis that the data have a Gaussian distribution was tested by three methods: the Lillieforce test, the Bera-Jarque test, and normal probability plots. Statistical analysis of the long-tailed distributions and fitting data with the appropriate α-stable distribution was performed by the program STABLE by J. P. Nolan (41). The PDF was fitted based on the maximum likelihood estimation (MLE) method described in Nolan (42). For control, estimations based on the sample characteristic function and on the quantile method were also employed (43).
RESULTS AND DISCUSSSION
Self-scaling characteristics of the electropore natural fluctuations
The approximated median diameter of the electropores created at the current-clamp stage of CACC ranged from 0.7 to 10 nm, depending on the value of the applied current and the electrolyte. The nanopore size is on the verge of the critical radius calculated from the classical energy model or even slightly below it when a low current was applied. It additionally supports the concepts that most probably only a single hydrophilic electropore succeeds to form before the potential abruptly drops below the critical breakdown potential, UB.
Current recorded at the voltage-clamp stage of CACC shows stochastic fluctuations (Fig. 3). It confirms experimentally Weaver's hypothesis on the natural fluctuations of the electropore (1). The fluctuations may be due to the competition between electroporating and resealing processes given in the energy balance of the electropore. Fluctuations of the current were observed also in another voltage-clamp experiment, reported by Melikov and colleagues (44). However in this experiment the voltage was clamped in short pulses at its initial value used for electroporation, i.e., above the breaking potential. This means that there is a high chance for appearance of multiple pores (as stated by the authors), which contributes to the observed fluctuations.
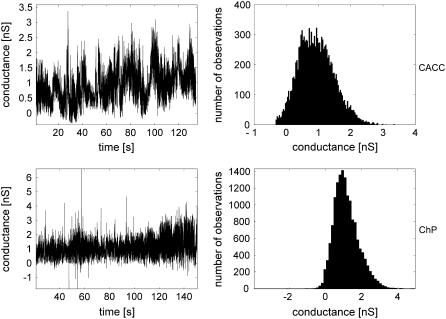
Although current-clamp experiments provide better stabilization of the electropore, the fluctuations of the conductance in CACC recorded under voltage-clamp conditions (Fig. 4, upper panels) are also well stabilized for a long enough period and the average value of the conductance is usually very close to the conductance obtained by ChP at the current-clamp stage (Fig. 4, bottom panels). Stability of the electropore results from a good balance between the line and surface components of the pore energy, opposing each other. It is an open question if the fluctuations observed in the nanopore conductance show local changes of their values due to the stochastic evolution of the nanopore shape.
FIGURE 4.
(Upper panels) Natural conductance fluctuations in CACC experiment at U = 250 mV, Gmean = 0.87 nS. (Bottom panels) Estimated conductance fluctuations of the same nanopore in the ChP experiment at I = 0.2 nA, Gmean = 1.05 nS. Data obtained for 2 M NaCl (C = 2.8 nF).
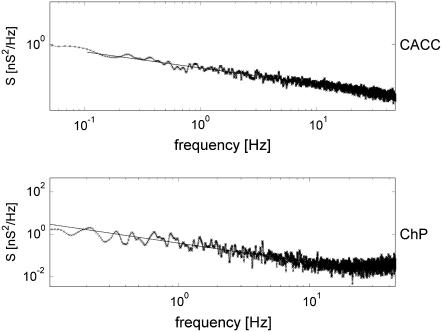
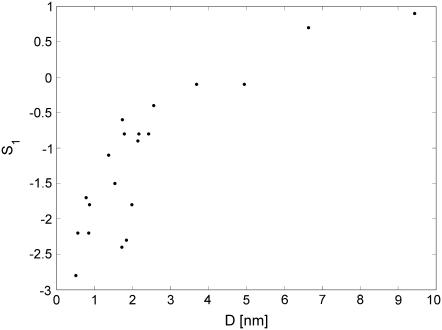
Spectral analysis showed that self-scaling properties of the conductance fluctuations, observed in ChP, appear also in CACC. Fig. 5 shows periodograms of the same nanopore from CACC (upper panel) and ChP (bottom panel). The power-law dependence, 1/f B, is maintained, although with a different value of the exponent B. The exponent B, obtained for CACC data, was almost independent of the electropore size. The amplitude, S1, was usually more likely to assume a greater value for big electropores both in CACC (Fig. 6) and ChP. The power spectral density was sensitive to the electrolyte composition. Typical values of B and S1 are presented in Table 1. Qualitatively, in terms of B and S1, the results from CACC have a tendency similar to the results obtained from ChP (Table 1). However, the values of B were more sensitive to the environment and more distinctive when obtained from CACC. The value of S1, which reflects dynamics more generally, was similar in both methods. It shows that the classical ChP is also able to reflect natural dynamics of the electropore, although less distinctively.
FIGURE 5.
(Upper panel) Periodogram of the conductance fluctuations in CACC indicates scaling properties (1/f B) of the process, B = 1.14, Sl = −1.8 nA2/Hz. (Bottom panel) Periodogram of the estimated conductance fluctuations in ChP, 1/f B noise below 10 Hz, B = 0.91, Sl = −1.5 nA2/Hz. Analysis provided for the data presented in Fig. 3.
FIGURE 6.
Dependence of the fluctuations amplitude S1 on the estimated diameter of the nanopore. Data obtained for 2 M NaCl.
TABLE 1.
Exponents B of the power-law periodograms for CACC and ChP (median values with standard deviations) and amplitude of the conductance fluctuations, represented by S1 for electropores of the conductance between 1 and 3 nS
| Electrolyte | Concentration [M] | BCACC | BChP | S1_CACC | S1_ChP |
|---|---|---|---|---|---|
| NaCl | 2 | 1.2 ± 0.1 | 1 ± 0.1 | −1.8 | −1.6 |
| NaCl | 0.2 | 1.5 ± 0.1 | 1.2 ± 0.2 | −2.1 | −2.15 |
| AlCl3 | 1.5 | 1.7 ± 0.1 | 1.4 ± 0.1 | −3.0 | −3.0 |
| AlCl3 | 0.2 | 1.45 ± 0.1 | 1.15 ± 0.1 | −2.2 | −2.45 |
| NaCl + AlCl3 | 0.2 + 0.02 | 1.5 ± 0.1 | 1.2 ± 0.1 | −2.9 | −2.8 |
Both methods, CACC and ChP, showed significant decrease of the general membrane dynamics, expressed by lower values of S1 when aluminum ions were present in the electrolyte at high concentration. The influence of a particular ion on electropore dynamics depended on the ionic concentration. At higher ionic concentration, the electropores are smaller and the membrane is more stable. Although the mechanism of this effect is not exactly known, it may be related to structural changes of the lipid membrane and decreased mobility of lipid molecules, as shown for monovalent salts by fluorescence correlation spectroscopy, confirmed by MD simulations (45), and Monte Carlo simulations (46) based on the modified Pink model (47). The ratio between the noise amplitude at high and low limit frequencies, expressed by B, depended on the concentration, although in a different manner for AlCl3 and NaCl. Higher concentration of NaCl reduced the value of B, which meant that shorter movements of the nanopore edge prevailed. High aluminum concentration generally reduced electropore dynamics, and high frequency component was dampened even more significantly.
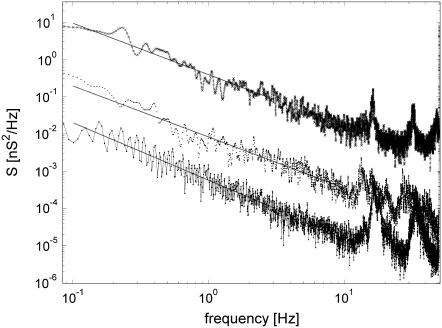
Power spectral density of many CACC series showed distinct peaks at certain frequency values (Fig. 7). Their number and location depended on the ionic composition and concentration. The characteristic peak frequencies, if observed, increased with the ionic concentration. Their origin is not clear although they may be associated with characteristic frequency of the nanopore fluctuations. Appearance of such characteristic peak frequencies in ChP was rare and the peaks were very indistinct if observed. If the nanopore fluctuations have a certain characteristic frequency, it can be blurred by the feedback present in ChP.
FIGURE 7.
Periodograms for 2 M NaCl, B = 1.38, Sl = −0.6 nA2/Hz, Dmean = 1.73 nm (crosses, upper curve), 0.2 M NaCl, B = 1.37, Sl = −2.1 nA2/Hz, Dmean = 2.1 nm (diamonds, middle curve), and 1.5 M AlCl3, B = 1.55, Sl = −3.0 nA2/Hz, Dmean = 1.3 nm (squares, bottom curve).
Fractional motion in the fluctuations: memory of the process
At constant potential, the electropore evolution, studied in CACC, is a continuous process with no preferred conductivity levels. The probabilistic properties of the conductance can be investigated by representing it as a sum of conductance transitions. By that we obtain a cumulative stochastic process G (t) of the electropore conductance
 |
(12) |
where Xi (t) represents the ith conductance transition. Expressing the conductance fluctuations by means of the increments reduces the problem with nonstationarity of the process. Furthermore, this approach naturally leads to modeling the conductance as a self-similar process.
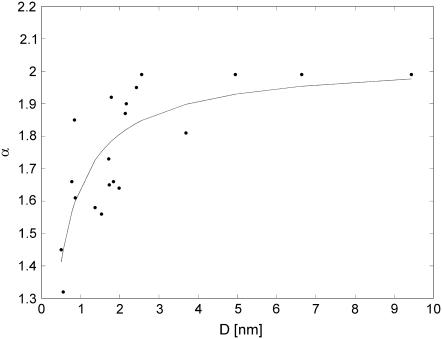
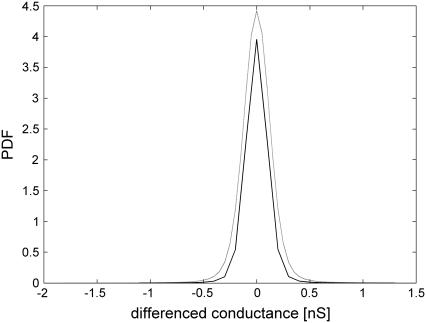
In most cases, especially for nanopores with the lowest diameter, histograms of the differenced conductance suggested a non-Gaussian process with long tails (not shown). Statistical tests also rejected the hypothesis on the normal distribution, which contradicted the appearance of fBm. Observation of long tails suggested that FLSM could be considered. Since most heavy-tailed distributions are not stable (43), another statistical method was employed to test if the hypothesis is plausible. The PDF of the conductance transitions was classified by means of the MLE test (42) with the confidence interval 0.95. The test estimated PDFs of the conductance transitions by α-stable PDFs. The scaling parameter α ranged from 1.3 to 1.99 for NaCl and from 1.6 to 1.99 for AlCl3, increasing with the nanopore size (Fig. 8) and reaching α = 2 in some cases. The increasing tendency was observed for all tested electrolytes. In ChP, the tails were less significant; α tended to assume higher values from this range.
FIGURE 8.
Stability index depends on the nanopore size. Data obtained for 2 M NaCl fitted with the sigmoidal curve.
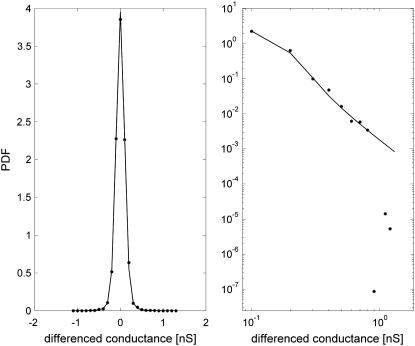
Since the statistical tests for stability may fail if there is a small departure from stability in the tail region, the test based on MLE was complemented by estimation based on the sample characteristic function method, and the estimation based on the quantile method, as suggested in Nolan (43). In the case of stably distributed data, all tests should give comparable results. Typically, the difference between the estimated values of α by MLE and the other estimators was Δα ∈ [0.03, 0.1], and maximal departure was Δmax = 0.15. In most cases, the PDFs estimated by MLE matched well with the smoothed data. Certain departure, if observed, could be attributed to the aging of the electropore during the experiment, which affected stationarity of the increments. Fig. 9 shows the PDF estimation for 1.5 M AlCl3, where the sample PDF based on the experimental data (stars) was compared to the α-stable PDF (solid line) estimated by MLE. The tail region of the data and estimated PDF is selectively presented on a double logarithmic scale in the right panel of Fig. 9.
FIGURE 9.
(Left panel) PDF of the conductance dynamics approximated by MLE as a long-tailed α-stable distribution (α = 1.78, β = 0.012, γ = 0.07, δ = −0.37E-04, solid line) and the smoothed data (stars). Data obtained for 1.5 M AlCl3 (B = 1.64, G = 2.4 nm, Δα = 0.04). (Right panel) Tail region of the distribution in double logarithmic plot (smoothed data—stars, PDF estimated by MLE—solid line).
The compliance with the stationarity condition (Eq. 5) was tested for a = 3 (Fig. 10). It showed a fairly good agreement between PDFs of the increments obtained with step 2 and with step 6 rescaled by a H, although certain influence from aging of the electropore was present. The result suggests that the increments can be approximately classified as a stationary α-stable FSN process.
FIGURE 10.
Stationarity analysis of the increments if the step is 6 (estimated PDF: α = 1.73, β = −0.025, solid line) and the step is 2 (estimated PDF: α = 1.78, β = 0.012, multiplied by 3H, H = 0.32, dashed line). Data obtained for 1.5 M AlCl3 (B = 1.64, G = 2.4 nm).
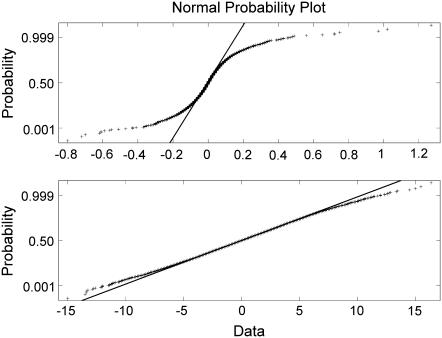
Dependence of the stability index α on the electropore size, observed in CACC, shows an interesting property. As the electropore size increases, the value of α increases to 1.99, and reaches 2 in some cases. This result means that the heavy tails lose their significance for big nanopores; however, MLE does not specify if the distribution is Gaussian. The hypothesis on the Gaussian distribution for the big nanopores was tested differently. The results were not unanimous and depended on the method. The Lillieforce test rejected the hypothesis (tested significance levels: 0.05 and 0.01) but the Bera-Jarque test did not reject the hypothesis on the normal distribution if α = 2 (significance level 0.05). Therefore, normal probability plots were used to examine the tendency in the PDF when the nanopore size was increasing. The test results for a small nanopore (D ≈ 0.9 nm, α = 1.61) and a big nanopore (D ≈ 6.6 nm, α = 1.99) in 2 M NaCl showed PDF approaching Gaussian distribution for the big nanopore (Fig. 11). Normal probability plots showed very good agreement when α = 2 (not shown). It could be assumed that the conductance fluctuations of a big electropore (e.g., D > 6 nm for 2 M NaCl, Fig. 8) typically tend to fBm.
FIGURE 11.
Normal probability plot (crosses) for a small nanopore (D ≈ 0.9 nm, α = 1.61, upper panel) and a big nanopore (D ≈ 6.6 nm, α = 1.99, bottom panel) shows PDF approaching Gaussian distribution (solid lines) when the nanopore increases the size. Data obtained for 2 M NaCl.
The transition from long tails to Gaussian-like distribution with finite variance may reflect the different shape of the electropore edge. MD simulations show (11–13) that in the first stage of electroporation, water molecules penetrate the hydrophobic core of the bilayer, forming highly irregular wire-like structures (prepores), which can join each other. When the prepores increase their size to the nanometer scale, the lipid headgroups start to translocate to the interior of the bilayer. The translocation process is much slower than the reorientation of the solvent molecules at the bilayer-water interface, and it may be sensitive to the ions in the solvent. Subsequently, hydrophilic pores of a very nonregular shape appear, which surround and stabilize the water columns. Their shape is very different from usually postulated cylindrical shape of electropores. In the process, the pores are extending their size until the membrane ruptures. However the potential across the membrane, assumed in MD, significantly exceeds the real experimental values, e.g., 3 V in Tieleman (11). The potential in CACC is set to the value below the critical UB, which stabilizes extension of the electropores whose appearance was observed in MD. There is a possibility that in such conditions lipid headgroups, translocated into the membrane interior, manage to form a more regular edge of the electropore. A big electropore of such a regular shape is less susceptible to abrupt significant changes of its edge and effective surface by incorporation of adjoining water wires and other defects, contributing to the long tails in probability distribution.
To test the memory of the process, the self-similarity index, H, was estimated (Table 2). In CACC, for the studied electrolytes, H ranged from 0.1 to 0.35. Limiting values of the process memory calculated from the comparison between H and 1/α for small (d0) and for big (dL) nanopores are presented in Table 2. The resulting values are always negative. Therefore, the tested time series were antipersistent, and they were governed by a short-memory process. It means that further opening of the nanopore by the electric field is most likely to be opposed by subsequent reduction of the electropore size. This result more quantitatively shows the competition between opening and resealing processes for each of the electrolytes, resulting from surface and line tension. Visually, the shorter the memory of the process, the rougher the fluctuations in the time series. Small nanopores in highly concentrated NaCl showed the shortest memory, which may result from strongly opposite processes affecting the nanopore edge.
TABLE 2.
Self-similarity index H and limiting values of the process memory d for the small (d0) and big (dL) nanopores
| Electrolyte | Concentration [M] | H | d0 | dL | Memory |
|---|---|---|---|---|---|
| NaCl | 2 | 0.1 | −0.6 | −0.4 | short |
| NaCl | 0.2 | 0.25 | −0.5 | −0.25 | short |
| AlCl3 | 1.5 | 0.35 | −0.35 | −0.15 | short |
| AlCl3 | 0.2 | 0.2 | −0.4 | −0.3 | short |
The most negative values of d for 2 M NaCl indicate the shortest memory of the process.
Fluctuations observed in ChP arise from the overlap of the feedback with the processes related to the line and surface tensions. The negative feedback opposes each change of the conductance, adding to the effect of the line tension when the electropore is expanding or cooperating with the surface tension when the electropore is shrinking. The question is whether the feedback could be dominant over two other processes. The action of negative feedback should contribute to further shortening of the memory, which would result (Eqs. 6 and 7) in B assuming lower values, only slightly greater than 1. The results presented in Table 1 generally confirm this conjecture, showing very short memory of the fluctuations recorded in ChP. The only exception was for highly concentrated NaCl solution, where B < 1 could be observed in some cases. However, the capacitance current was the greatest there, and it may have contributed to this effect. The relation between the value of B and the electrolyte composition, observed from CACC, was maintained in ChP. For example, highly concentrated AlCl3 had the weakest short memory in both experiments. This result indicates that the feedback does not cover completely the contribution from line and surface tensions sensitive to the electrolyte. It confirms that for very unstable membranes ChP may be a good alternative to CACC.
CONCLUSIONS
A new experimental method to study electroporated lipid membranes was proposed and tested. The CACC electroporation is a combination of the current-clamp and voltage-clamp techniques and allows the study of natural dynamics of a single hydrophilic nanopore. The method maintains membrane stability, eliminating feedback and reducing the capacitance current. The experimental results show that the electroporated membranes can tolerate voltage-clamp conditions unless electroporation is initiated at a constant potential. The membrane has a surprisingly strong capability to preserve its natural continuous organization, even at very high electric potential, when no feedback is involved. The membrane is exposed to the danger of the irreversible break only until the hydrophilic electropore is fully created and certain equilibrium is achieved. The initial stage of electroporation needs either the feedback, present in the current-clamp technique, or application of the short-time impulses. Decreasing the potential to a value below UB, after the pore creation, prevents the rupture, and the potential can be clamped. Experiments show that the electropore maintains the average size achieved at the current-clamp stage of electroporation, provided the potential is clamped at the appropriate value. This result proves that the electropore size can be controlled more easily than expected. The method is relatively simple to apply and may lay the foundation of new electroporation techniques used for delivering molecules into liposomes or even cells. The results from CACC show that the electroporated cell under constant potential below UB may maintain an electropore of a stabilized size.
The electropores studied in CACC at a constant potential show a naturally fluctuating dynamics, which contradicts the idea that fluctuations can occur with the feedback only. Spectral analysis showed scaling properties and self-similarity of the fluctuations, expressed by the power-law spectrum 1/fB. The value of exponent B and general membrane dynamics (S1) is sensitive to the environment, as shown by an exemplary study provided for Na+ and Al3+ at different concentrations. The results from CACC are related to the results obtained from ChP, where fluctuations have self-scaling properties too. It shows that classical ChP is related to the natural dynamics of the nanopore and for very unstable membranes ChP may be a good alternative.
The statistical analysis of the fluctuations obtained in CACC showed that the PDF could be quite well estimated by α-stable distribution, with α depending on the electropore size. The process of electropore fluctuations for small electropores can be modeled as a FLSM with short memory, tending to fBm when the nanopore increases its size. Disappearance of the long tails in the fluctuations of big electropores indicates the possibility of a different edge structure. A more regular edge of a big electropore could prevent abrupt changes of its size, and long tails in the probability distribution would disappear.
The antipersistent nature of the conductance fluctuations, quantitatively evaluated by the process memory, reflects competition between processes related to the line and surface tensions in the membrane. The study shows that the results from ChP and CACC are related; however, the memory of the process from ChP is shortened by the negative feedback opposing each change of the electropore conductance. The memory value shows dependence on the membrane environment. The stochastic study provides a new method for a quantitative evaluation of the competing processes and their dependence on the membrane composition and the solute. The results can improve application of electroporation in particular conditions.
Acknowledgments
The author thanks Dr. Slawomir Kalinowski for development of the instrumentation used in the experimental part of the project and discussion.
References
- 1.Weaver, J. C., and Yu. A. Chizmadzhev. 1996. Theory of electroporation: a review. Bioelectrochem. Bioenerg. 41:135–160. [Google Scholar]
- 2.Benz, R., F. Beckers, and U. Zimmermann. 1979. Reversible electrical breakdown of lipid bilayer membranes: a charge-pulse relaxation study. J. Membr. Biol. 4:181–204. [DOI] [PubMed] [Google Scholar]
- 3.Teissie, J., M. Golzio, and M. P. Rols. 2005. Mechanisms of cell membrane electropermeabilization: a minireview of our present (lack of?) knowledge. Biochim. Biophys. Acta. 1724:270–280. [DOI] [PubMed] [Google Scholar]
- 4.Kotulska, M., K. Kubica, S. Koronkiewicz, and S. Kalinowski. 2007. Modeling the induction of lipid membrane electropermeabilization. Bioelectrochemistry. 70:64–70. [DOI] [PubMed] [Google Scholar]
- 5.Neumann, E., S. Kakorin, and K. Toensing. 1999. Fundamentals of electroporative delivery of drugs and genes. Bioelectrochem. Bioenerg. 48:3–16. [DOI] [PubMed] [Google Scholar]
- 6.Heller, R., R. Gilbert, and L. M. Mir. 1999. Clinical applications of electrochemotherapy. Adv. Drug Deliv. Rev. 35:119–129. [DOI] [PubMed] [Google Scholar]
- 7.Snoj, M., Z. Rudolf, M. Cemazar, B. Jancar, and G. Sersa. 2005. Successful sphincter-saving treatment of anorectal malignant melanoma with electrochemotherapy, local excision and adjuvant brachytherapy. Anticancer Drugs. 16:345–348. [DOI] [PubMed] [Google Scholar]
- 8.Rols, M. P., Y. Tamzali, and J. Teissie. 2002. Electrochemotherapy of horses. A preliminary clinical report. Bioelectrochemistry. 55:101–105. [DOI] [PubMed] [Google Scholar]
- 9.Hu, Q., R. P. Joshi, and K. H. Schoenbach. 2005. Simulations of nanopore formation and phosphatidylserine externalization in lipid membranes subjected to a high-intensity, ultrashort electric pulse. Phys. Rev. E. 72:031902–031912. [DOI] [PubMed] [Google Scholar]
- 10.Kotnik, T., and D. Miklavčič. 2006. Theoretical evaluation of voltage inducement on internal membranes of biological cells exposed to electric field. Biophys. J. 90:480–491. [DOI] [PMC free article] [PubMed] [Google Scholar]
- 11.Tieleman, D. P. 2004. The molecular basis of electroporation. BMC Biochem. 19:5–10. [DOI] [PMC free article] [PubMed] [Google Scholar]
- 12.Leontiadou, H., A. E. Mark, and S. J. Marrink. 2004. Molecular dynamics simulations of hydrophilic pores in lipid bilayers. Biophys. J. 86:2156–2164. [DOI] [PMC free article] [PubMed] [Google Scholar]
- 13.Tarek, M. 2005. Membrane electroporation: a molecular dynamics simulation. Biophys. J. 88:4045–4053. [DOI] [PMC free article] [PubMed] [Google Scholar]
- 14.Neu, J. C., and W. Krassowska. 1999. Asymmetric model of electroporation. Phys. Rev.E. 59:3471–3482. [Google Scholar]
- 15.Chizmandzev, Y. A., J. Teissie, and D. Walz. 2004. Lipid bilayer electropermeabilization. In Bioelectrochemistry of Membranes. D. Walz, J. Teissie, G. Milazzo, editors. Birkhäuser, Basel, Germany. 173–203.
- 16.Robello, M., and A. Gliozzi. 1989. Conductance transition induced by an electric field in lipid bilayers. Biochim. Biophys. Acta. 982:173–176. [DOI] [PubMed] [Google Scholar]
- 17.Kalinowski, S., G. Ibron, K. Bryl, and Z. Figaszewski. 1998. Chronopotentiometric studies of electroporation of bilayer lipid membranes. Biochim. Biophys. Acta. 1369:204–212. [DOI] [PubMed] [Google Scholar]
- 18.Koronkiewicz, S., S. Kalinowski, and K. Bryl. 2002. Programmable chronopotentiometry as a tool for the study of electroporation and resealing of pores in bilayer lipid membranes. Biochim. Biophys. Acta. 1561:222–229. [DOI] [PubMed] [Google Scholar]
- 19.Koronkiewicz, S., and S. Kalinowski. 2004. Influence of cholesterol on electroporation of bilayer lipid membranes: chronopotentiometric studies. Biochim. Biophys. Acta. 1661:196–203. [DOI] [PubMed] [Google Scholar]
- 20.Kalinowski, S., S. Koronkiewicz, M. Kotulska, and K. Kubica. 2007. Simulation of electroporated cell by chronopotentiometry. Bioelectrochemistry. 70:83–90. [DOI] [PubMed] [Google Scholar]
- 21.Scalas, E., A. Ridi, M. Robello, and A. Gliozzi. 1998. Flicker noise in bilayer lipid membranes. Europhys. Lett. 43:101–105. [Google Scholar]
- 22.Kotulska, M., S. Koronkiewicz, and S. Kalinowski. 2004. Self-similar processes and flicker noise from a fluctuating nanopore in a lipid membrane. Phys. Rev. E. 69:031920–031930. [DOI] [PubMed] [Google Scholar]
- 23.Kotulska, M., S. Koronkiewicz, and S. Kalinowski. 2002. Cholesterol induced changes in the characteristics of the time series from planar lipid bilayer membrane during electroporation. Acta Phys. Pol. B. 33:1115–1124. [Google Scholar]
- 24.Diederich, A., B. Günther, and M. Winterhalter. 1998. Influence of surface charges on the rupture of black lipid membranes. Phys. Rev. E. 58:4883–4889. [Google Scholar]
- 25.Siwy, Z., and A. Fulinski. 2002. Origin of 1/fα noise in membrane channel currents. Phys. Rev. Lett. 89:158101–158104. [DOI] [PubMed] [Google Scholar]
- 26.Bezrukov, S. M., and M. Winterhalter. 2000. Examining noise sources at the single-molecule level: 1/f noise of an open maltoporin channel. Phys. Rev. Lett. 85:202–205. [DOI] [PubMed] [Google Scholar]
- 27.Mercik, S., and K. Weron. 2001. Stochastic origins of the long-range correlations of ionic current fluctuations in membrane channels. Phys. Rev. E. 2001:051910–051919. [DOI] [PubMed] [Google Scholar]
- 28.Lamperti, J. W. 1962. Semi-stable stochastic processes. Trans. Am. Math. Soc. 104:62–78. [Google Scholar]
- 29.Mandelbrot, B., and J. W. Van Ness. 1968. Fractional Brownian motions, fractional noises and applications. SIAM Rev. 10:422–437. [Google Scholar]
- 30.Maejima, M. 1989. Self-similar processes and limit theorems. Sugaku Expositions. 2:102–123. [Google Scholar]
- 31.Burnecki, K., J. Rosinski, and A. Weron. 1998. Spectral representation and structure of self-similar processes. In Stochastic Processes & Related Topics. I. Karatzas, B. Rajput, and M. S. Taqqu, editors. Birkhäuser, Basel, Germany. 1–14.
- 32.Samorodnitsky, G., and M. S. Taqqu. 1994. Stable Non-Gaussian Random Processes: Stochastic Models with Infinite Variance. Chapman & Hall, London.
- 33.Weron, A., K. Burnecki, S. Mercik, and K. Weron. 2005. Complete description of all self-similar models driven by Levy stable noise. Phys. Rev. E. 71:016113. [DOI] [PubMed] [Google Scholar]
- 34.Hurst, H. E. 1951. Long-term storage capacity of reservoirs. Trans. Am. Soc. Civ. Eng. 116:770–808. [Google Scholar]
- 35.Eke, A., P. Herman, J. B. Bassingthwaighte, G. M. Raymond, D. B. Percival, M. Cannon, I. Balla, and C. Ikrenyi. 2000. Physiological time series: distinguishing fractal noises from motions. Pflugers Arch. Eur. J. Physiol. 439:403–415. [DOI] [PubMed] [Google Scholar]
- 36.Mueller, P., D. O. Rudin, H. T. Tien, and W. C. Wescott. 1963. Methods for the formation of single bimolecular lipid membranes in aqueous solutions. J. Phys. Chem. 67:534–535. [Google Scholar]
- 37.Kalinowski, S., and Z. Figaszewski. 1995. A four-electrode system for measurements of bilayer lipid membrane capacitance. Meas. Sci. Technol. 6:1043–1049. [Google Scholar]
- 38.Akeson, M. A., D. N. Munns, and R. G. Burau. 1989. Adsorption of Al3+ to phosphatidylcholine vesicles. Biochim. Biophys. Acta. 986:33–40. [DOI] [PubMed] [Google Scholar]
- 39.Vila, J., E. Rilo, L. Segade, O. Cabeza, and L. M. Varela. 2005. Electrical conductivity of aqueous solutions of aluminum salts. Phys. Rev. E. 71:031201–031208. [DOI] [PubMed] [Google Scholar]
- 40.Griese, T., S. Kakorin, and E. Neumann. 2002. Conductometric and electrooptic relaxation spectrometry of lipid vesicle electroporation at high fields. PCCP. 4:1217:27.
- 41.Program “STABLE”. Available at: http://academic2.american.edu/∼jpnolan/stable/stable.html.
- 42.Nolan, J. P. 2001. Maximum likelihood estimation of stable parameters. In Lévy Processes: Theory and Applications. O. E. Barndorff-Nielsen, T. Mikosch, and S. I. Resnick, editors. Birkhäuser, Boston. 379–400.
- 43.Nolan, J. P. 1999. Fitting data and assessing goodness-of-fit with stable distributions. Proc. ASA-IMS Conf. Heavy Tailed Distributions. J. P. Nolan and A. Swami, editors.
- 44.Melikov, K. C., V. A. Frolov, A. Shcherbakov, A. V. Samsonov, Y. A. Chizmadzhev, and L. V. Chernomordik. 2001. Voltage-induced nonconductive pre-pores and metastable single pores in unmodified planar lipid bilayer. Biophys. J. 80:1829–1836. [DOI] [PMC free article] [PubMed] [Google Scholar]
- 45.Böckman, R. A., A. Hac, T. Heimburg, and H. Grubmüller. 2003. Effect of sodium chloride on a lipid bilayer. Biophys. J. 85:1–9. [DOI] [PMC free article] [PubMed] [Google Scholar]
- 46.Kotulska, M., and K. Kubica. 2005. Structural and energetic model of the mechanisms for reduced self-diffusion in a lipid bilayer with increasing ionic strength. Phys. Rev. E. 72:061903–061909. [DOI] [PubMed] [Google Scholar]
- 47.Kubica, K. 2001. Monte Carlo simulation towards ripple phase modeling. Comput. Chem. 25:245–250. [DOI] [PubMed] [Google Scholar]


