

Abstract
We present a probability density approach to modeling localized Ca2+ influx via L-type Ca2+ channels and Ca2+-induced Ca2+ release mediated by clusters of ryanodine receptors during excitation-contraction coupling in cardiac myocytes. Coupled advection-reaction equations are derived relating the time-dependent probability density of subsarcolemmal subspace and junctional sarcoplasmic reticulum [Ca2+] conditioned on “Ca2+ release unit” state. When these equations are solved numerically using a high-resolution finite difference scheme and the resulting probability densities are coupled to ordinary differential equations for the bulk myoplasmic and sarcoplasmic reticulum [Ca2+], a realistic but minimal model of cardiac excitation-contraction coupling is produced. Modeling Ca2+ release unit activity using this probability density approach avoids the computationally demanding task of resolving spatial aspects of global Ca2+ signaling, while accurately representing heterogeneous local Ca2+ signals in a population of diadic subspaces and junctional sarcoplasmic reticulum depletion domains. The probability density approach is validated for a physiologically realistic number of Ca2+ release units and benchmarked for computational efficiency by comparison to traditional Monte Carlo simulations. In simulated voltage-clamp protocols, both the probability density and Monte Carlo approaches to modeling local control of excitation-contraction coupling produce high-gain Ca2+ release that is graded with changes in membrane potential, a phenomenon not exhibited by so-called “common pool” models. However, a probability density calculation can be significantly faster than the corresponding Monte Carlo simulation, especially when cellular parameters are such that diadic subspace [Ca2+] is in quasistatic equilibrium with junctional sarcoplasmic reticulum [Ca2+] and, consequently, univariate rather than multivariate probability densities may be employed.
INTRODUCTION
The mechanical function of the heart depends on complex bidirectional interactions between electrical and calcium (Ca2+) signaling systems. Each time the heart beats, current flowing through the ion channels in the plasma membrane (sarcolemma) causes a characteristic change in membrane voltage known as an action potential (AP). Membrane depolarization during the AP causes L-type Ca2+ channels to open, and Ca2+ current through these channels causes the release of a larger amount of Ca2+ from the sarcoplasmic reticulum, a process known as Ca2+-induced Ca2+ release (CICR). This leads to a large, transient increase in [Ca2+] in each heart cell, and contraction occurs when these Ca2+ ions bind to myofilaments, a sequence of events known as excitation-contraction (EC) coupling. In addition, intracellular [Ca2+] feeds back upon and changes the cell's membrane potential through the Ca2+ dependence of several ion channels and membrane transporters.
Mathematical and computational modeling has proved to be an important tool for understanding cardiac electrophysiology and EC coupling. Computer simulations have been used to test hypotheses about heart cell function and predict underlying mechanisms (1–4). Most investigations have employed deterministic models that ignore molecular fluctuations and assume an isopotential cell, an approach that is valid for simulating current flowing through a large population of voltage-gated ion channels. Even though the individual channels open and close stochastically, each channel experiences the same voltage, so identical rate constants apply to each channel and only average behavior needs to be considered. However, this approach is not suitable for simulating CICR release during EC coupling because the overall release flux represents a collection of discrete events, known as Ca2+ sparks, evoked by local—rather than global—increases in Ca2+ concentration (5). That is, each spark reflects Ca2+ release from a cluster of Ca2+-regulated intracellular Ca2+ channels known as ryanodine receptors (RyRs) that is triggered by entry of Ca2+ through nearby L-type Ca2+ channels (6). Thus, different groups of RyRs experience different local Ca2+ concentrations and stochastically gate in a manner that depends on whether nearby sarcolemmal Ca2+ channels have recently been open or closed. One consequence of this “local control” (7) mechanism of cardiac CICR is that deterministic “common pool” models—whole cell models in which all RyR clusters in a myocyte experience the same [Ca2+]—fail to reproduce several important experimental observations. In particular, the high gain and positive feedback of common pool models ensures that Ca2+ is released in an all-or-none fashion (2,3,8–10) as opposed to being graded with the amount of Ca2+ influx, as observed in numerous experiments (6,11,12). Deterministic common pool models of cardiac CICR during EC coupling that have been able to reproduce graded release have done so in an ad hoc fashion (4,13–16).
Models of EC coupling are able to simulate graded Ca2+ release mechanistically by treating L-type Ca2+ channels and juxtaposed Ca2+ release sites as stochastic “Ca2+ release units” (CaRUs), each of which is associated with its own diadic subspace Ca2+ concentration. When activated spontaneously or through membrane depolarization these CaRUs may deplete Ca2+ stored in localized regions of junctional SR and, on a slower timescale, interact with one another via diffusion of Ca2+ within the network SR and bulk myoplasm. This approach, however, requires relatively large computational resources to perform Monte-Carlo simulations of stochastic Ca2+ release from a large population of CaRUs. Indeed, the number of simulated CaRUs is often reduced to unphysiological values in such models to obtain shorter run times (7,17–19).
Two recent deterministic models have used a minimal Ca2+ release unit formulation of interactions between L-type channels and RyR clusters to produce graded release (20,21). In these models ordinary differential equations for the fraction of Ca2+ release units in each of a small number of states are solved under the assumption that subspace [Ca2+] is an algebraic function of the bulk myoplasmic and network SR [Ca2+]. This function depends on Ca2+ release unit state and is determined by balancing the Ca2+ fluxes into and out of the diadic subspace. While the large number of Ca2+ release units in cardiac myocytes—estimated in the range of 10,000–20,000 via both structural (22) and functional (23) observations—does indeed suggest that it should be possible to produce deterministic local control models of EC coupling, the assumption that diadic subspace [Ca2+] is in quasistatic equilibrium with bulk myoplasmic and network SR Ca2+ may be overly restrictive. Indeed, this modeling approach is only valid when the dynamics of subspace [Ca2+] are very fast compared to stochastic Ca2+ release unit transition rates. Moreover, [Ca2+] in a particular subspace is likely to depend on the local “junctional” SR [Ca2+] rather than the bulk or network SR [Ca2+], especially if junctional SR depletion influences RyR gating, as suggested by both simulations (18) and recent experiments (24,25).
Here we present an alternative deterministic formalism for modeling local control of CICR during cardiac EC coupling that captures the collective behavior of a large population of Ca2+ release units without this restrictive assumption. We utilize the fact that the number of Ca2+ release units is large (similar to Hinch (20) and Greenstein et al. (21)), but we do not assume a simple algebraic relationship between the local diadic subspace [Ca2+] associated with each Ca2+ release unit and the bulk Ca2+ concentrations. Instead, we define a set of multivariate continuous probability density functions for the diadic subspace and junctional SR [Ca2+] conditioned on CaRU state (26–28). As described below, these probability density functions solve a system of advection-reaction equations that are derived from the stochastic ordinary differential equations used in Monte Carlo simulations of local control. These equations are solved numerically using a high-resolution finite difference scheme while coupled to ordinary differential equations for the bulk myoplasmic and network SR [Ca2+]. This produces a minimal model of cardiac EC coupling that avoids computationally demanding Monte Carlo simulation while accurately representing heterogeneous local Ca2+ signals; in particular, the statistical recruitment of CaRUs and the dynamics of junctional SR depletion, spark termination, and junctional SR refilling.
Some of these results have previously appeared in abstract form (29).
MODEL FORMULATION
The minimal whole cell model of cardiac EC coupling that is the focus of this article can be formulated as a traditional Monte Carlo calculation in which heterogeneous local Ca2+ signals associated with a large number of CaRUs are simulated. In this Monte Carlo formulation, a diadic subspace and junctional SR compartment is associated with each CaRU and the [Ca2+] in these compartments is found by solving a large number of ordinary differential equations. Alternatively, these heterogeneous local Ca2+ signals can be simulated using a novel probability density approach that represents the distribution of diadic subspace and junctional SR Ca2+ concentrations with a system of partial differential equations (see below). Because many of the equations and parameters of the whole cell model of EC coupling are identical in the two formulations, we begin by presenting the Monte Carlo formulation.
Whole cell model of EC coupling: Monte Carlo formulation
Fig. 1 shows a diagram of the components and fluxes of the model of local Ca2+ signaling and CaRU activity during cardiac EC coupling that is the focus of this article. As illustrated in Fig. 1 A, each Ca2+ release unit includes two restricted compartments (the diadic subspace and junctional SR) with [Ca2+] denoted by  , respectively, where the superscripted n is an index over a total number of Ca2+ release units (denoted by N). Each Ca2+ release unit includes an L-type Ca2+ channel dihydropiridine receptor (DHPR) and a minimal representation of a cluster of RyRs that is either fully closed or fully open. The fluxes
  indicate Ca2+ entry into a subspace via the DHPR or RyR cluster, respectively. Diffusion of Ca2+ between the nth diadic subspace and bulk myoplasm (cmyo) is indicated by
  . Similarly,
  indicates diffusion between the network SR (cnsr) and junctional SR compartment associated with the nth Ca2+ release unit.
FIGURE 1.

Diagrams of model components and fluxes. (A) Each Ca2+ release unit consists of two restricted compartments (the diadic subspace and junctional SR with [Ca2+] denoted by cds and cjsr, respectively), a two-state L-type Ca2+ channel (DHPR), and a two-state Ca2+ release site (a RyR “megachannel” (18)). The t-tubular [Ca2+] is denoted by cext and the fluxes  ,
,  ,
,  ,
,  , Jin, Jncx, Jserca, and Jleak are described in the text. (B) The bulk myoplasm (cmyo) and network SR (cnsr) Ca2+ concentrations in the model are coupled via
  to a large number of Ca2+ release units (for clarity only four are shown), each with different diadic subspace (
 ) and junctional SR (
 ) Ca2+ concentration.
Fig. 1 B illustrates how the bulk myoplasm and network SR Ca2+ concentrations in the model are coupled via the diffusion fluxes ( ) to a large number of Ca2+ release units (for clarity only four are shown). Importantly, each of the N Ca2+ release units may have a different diadic subspace (
 ) and junctional SR (
 ) Ca2+ concentration. Four additional fluxes directly influence the bulk myoplasm: a background Ca2+ influx denoted by Jin, extrusion of Ca2+ via the Na+-Ca2+ exchanger (Jncx), SR Ca2+-ATPase (SERCA) pumps (Jserca) that resequester Ca2+ into the network SR, and a passive leak out of the network SR to the bulk myoplasm (Jleak).
A complete description of CICR would include stochastic gating of roughly N = 20,000 CaRUs, each of which would contain multiple L-type Ca2+ channels (1–10) (30) and RyRs (30–300) (31), with each individual channel described by a Markov chain that consists of two to several tens of states. However, previous Monte Carlo simulations of EC coupling focusing on local control have often used Markov models of reduced complexity (7,18,20). Because such minimal models capture the essential characteristics of EC coupling gain and gradedness in simulated whole cell voltage clamp protocols, this level of resolution will suffice for our main purpose, which is to introduce the probability density approach as an alternative to Monte Carlo simulation.
A minimal four-state Ca2+ release unit model
Previous modeling studies indicate that the gating of the cluster of RyRs associated with each CaRU is all-or-none (7,17,18) and this suggests the following minimal two-state model of an RyR “megachannel”,
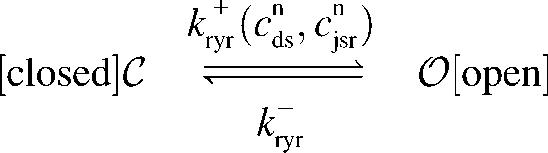 , ,
|
(1) |
where the Ca2+ activation of the cluster of RyRs is a sigmoidal function of the diadic subspace [Ca2+] (18),
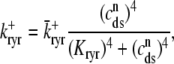 |
and the influence of junctional SR [Ca2+] on RyR gating is included by making the half-maximal activation of the RyR megachannel (Kryr) a decreasing function of  ,
,
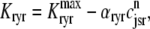 |
so that depletion of the junctional SR will render CaRUs refractory to activation after release terminates (18).
Similarly, to illustrate and validate the probability density approach it is sufficient to consider a two-state model of the L-type Ca2+ channel (DHPR),
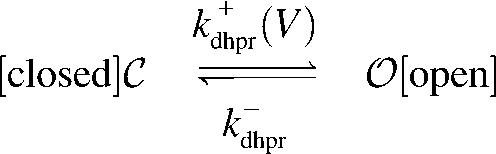 , ,
|
(2) |
with a voltage-dependent activation rate  given by (4)
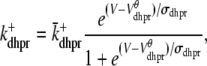 |
and constant deactivation rate  that sets the mean open time (0.2 ms) and maximum open probability (0.1) of the channel. Although this two-state DHPR model ignores voltage- and Ca2+-dependent inactivation of L-type Ca2+ channels, these processes do not significantly influence the triggering of CICR during the whole-cell voltage clamp protocols that are the focus of this article (cf. Hinch (20)).
When the kinetic schemes of the RyR megachannel and DHPR (Eqs. 1 and 2) are combined we obtain the following minimal four-state model of a Ca2+ release unit,
 |
(3) |
where the horizontal transitions represent RyR opening and closing whereas vertical transitions represent DHPR gating.
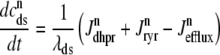
Concentration balance equations
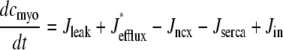
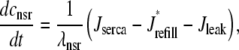
In the Monte Carlo formulation of the minimal whole cell model of EC coupling there are 2 + 2N ordinary differential equations representing Ca2+ concentration balance for the bulk myoplasm, network SR, N diadic subspaces, and N junctional SRs. Consistent with Fig. 1 these equations are
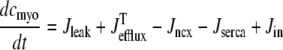 |
(4) |
 |
(5) |
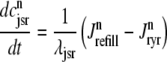 |
(6) |
 |
(7) |
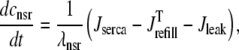
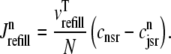
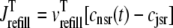
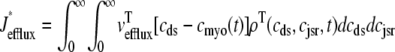
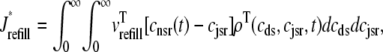
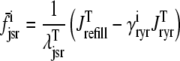
where 1 ≤ n ≤ N in Eqs. 5 and 6 and the total efflux and refill fluxes occurring in Eqs. 4 and 7 include a contribution from each CaRU and thus are given by  and
and  . Similarly, the total (trigger) flux via DHPR channels and the total release flux via RyR megachannels throughout the whole cell model are given by
 |
(8) |
The effective volume ratios λnsr, λds, and λjsr in Eqs. 5–7 are defined with respect to the physical volume (Vmyo) and include a constant-fraction Ca2+ buffer capacity for the myoplasm (βmyo). For example, the effective volume ratio associated with the network SR is
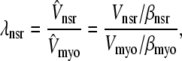 |
with effective volumes defined by  and
and  . Because each individual diadic subspace is assumed to have the same physical volume (Vds) and buffering capacity (βds), the effective volume ratio that occurs in Eq. 5 is
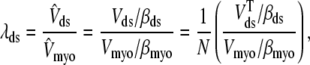 |
(9) |
where the second expression defines λds in terms of the total physical volume of all the diadic subspaces in aggregate ( ). Similar assumptions and equations apply for the junctional SR so that the definition of λjsr follows Eq. 9.
We also define an overall myoplasmic [Ca2+] that includes contributions from the bulk myoplasm and each of the N diadic spaces (scaled by their effective volumes),
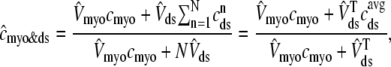 |
(10) |
where the second equality uses natural definitions for the total effective diadic subspace volume,  , and the average diadic subspace [Ca2+],
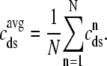 |
(11) |
Similarly, the overall SR [Ca2+] involves both the junctional and network SR,
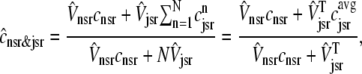 |
(12) |
where  ,
,  , and the average junctional SR [Ca2+] is defined as
 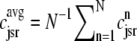 .
.
Description of fluxes
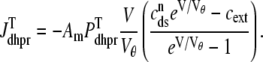
The trigger Ca2+ flux into each of the N diadic spaces through DHPR channels ( in Eq. 5) is given by
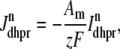 |
(13) |
where Am = Cmβmyo/Vmyo. The inward Ca2+ current ( ) is given by
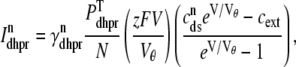 |
(14) |
where Vθ = RT/zF,  is the total (whole cell) permeability of the L-type Ca2+ channels, and
  is a random variable that is 0 when the L-type Ca2+ channel associated with the nth CaRU is closed and 1 when this channel is open (Eqs. 2 and 3).
Similarly, the flux through the RyR megachannel associated with the nth CaRU ( ) is given by
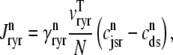 |
(15) |
where  = 0 or 1 when the release site is closed or open, respectively (Eqs. 1 and 3). Diffusion from each subspace into the bulk myoplasm is given by
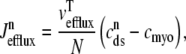 |
(16) |
and, similarly, diffusion from the network SR to each junctional SR compartment is given by
 |
(17) |
The remaining four fluxes that appear in Eqs. 4–6 include Jin (background Ca2+ influx), Jncx (Na+-Ca2+ exchange), Jserca (SR Ca2+-ATPases), and Jleak (the network SR leak). The functional form of these four fluxes that directly influence the bulk myoplasmic [Ca2+] follows previous work (3,32,33) (see Appendix A).
Whole cell model of EC coupling: probability density formulation
The probability density approach to modeling local Ca2+ signaling and CaRU activity during cardiac EC coupling is an alternative to Monte Carlo simulation that is valid when the number of Ca2+ release units is large. We begin by defining continuous multivariate probability density functions for the diadic subspace ( ) and junctional SR (
 ) Ca2+ concentrations jointly distributed with the state of the Ca2+ release unit (
 ) (34,35,26), that is,
 |
(18) |
where the index  runs over the four Ca2+ release unit states (see Eq. 3) and the tildes on
  ,
,  , and
, and  indicate random quantities. If the meaning of Eq. 18 is not obvious, it may be helpful to imagine performing a Monte Carlo simulation as described in the previous section with a very large number of CaRUs. At any time t one could randomly sample one CaRU from this population to produce an instance of the random variables
  ,
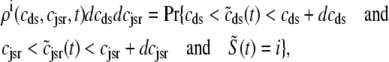
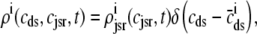
,  , and
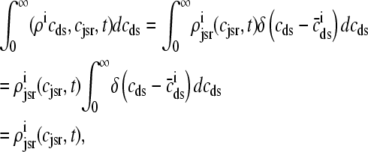
, and  , corresponding to the current state of the sampled L-type channel and RyR cluster and the diadic subspace and junctional SR [Ca2+] associated with this CaRU. The quantity ρi(cds, cjsr, t) defined in Eq. 18 simply indicates the probability with which you would find this sampled CaRU in state i with diadic subspace [Ca2+] in the range [cds, cds + dcds] and junctional SR [Ca2+] in the range [cjsr, cjsr + dcjsr] provided the total number of CaRUs is very large.
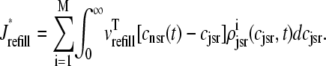
For the multivariate probability densities defined by Eq. 18 to be consistent with the dynamics of the Monte Carlo model of cardiac EC coupling described in the previous section, they must satisfy the following system of advection-reaction equations (26–28),
 |
(19) |
 |
(20) |
 |
(21) |
 |
(22) |
where the advection rates  are functions of cds and cjsr that can be read off the ordinary differential equations for the evolution the diadic subspace and junctional SR [Ca2+]. Consistent with Eqs. 5 and 6 we have
 |
(23) |
 |
(24) |
where  indicates whether or not the L-type Ca2+ channel is open (
 ,
,  ) and, similarly,
  indicates whether or not the RyR channel cluster is open (
 ,
,  ). Eqs. 23 and 24 include four fluxes that may influence the diadic subspace and junctional SR [Ca2+] and consistent with Eqs. 13–17 these are given by
 |
(25) |
 |
(26) |
 |
(27) |
 |
(28) |
The advection terms in Eqs. 19–22 involving partial derivatives with respect to cds and cjsr correspond to the deterministic dynamics of diadic subspace and junctional SR Ca2+ that depend on Ca2+ release unit state via  and
and  (Eqs. 5 and 6). Conversely, the reaction terms in Eqs. 19 and 22 correspond to the stochastic gating of the four-state Ca2+ release unit model whose transition rates are presented above (Eqs. 1–3). That is, Ca2+ release unit state changes move probability from one joint probability density to another in a manner that may [
 ] or may not [
 ,
,  , and
, and  ] depend on the diadic subspace and junctional SR [Ca2+].
It is important to note that the functional form of the fluxes  and
and  occurring in Eqs. 23 and 24 involve the bulk myoplasmic and network SR Ca2+ concentrations (cmyo(t) and cnsr(t) in Eqs. 26 and 27). These bulk Ca2+ concentrations satisfy ordinary differential equations (ODEs) that are similar in form to the concentration balance equations used in the Monte Carlo approach (Eqs. 4 and 7),
 |
(29) |
 |
(30) |
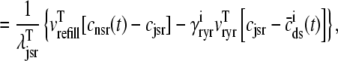
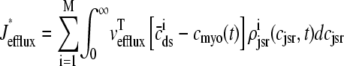
where Jleak, Jncx, Jserca, and Jin are defined as in the Monte Carlo approach (see Appendix A), but Jefflux* and Jrefill* are functionals of the probability densities [ρi(cds, cjsr, t)] governed by Eqs. 19–22, that is,
 |
(31) |
 |
(32) |
where 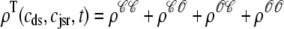 is the total probability distribution of the diadic subspace and junctional SR [Ca2+] irrespective of the state of a randomly sampled CaRU, and the double integrals account for all possible values of diadic and junctional SR [Ca2+].
Summary of model formulation
The probability density and Monte Carlo formulations of the minimal model of EC coupling presented above have much in common. For example, the dynamics of the bulk myoplasmic and network SR [Ca2+] take similar forms (compare Eqs. 29 and 30 to Eqs. 4 and 7). However, the two approaches differ fundamentally in how the heterogeneous localized Ca2+ concentrations associated with a large number of Ca2+ release units are represented. In the traditional Monte Carlo simulation, 2N ordinary differential equations are solved to determine the dynamics of [Ca2+] in the diadic subspace and junctional SR compartments associated with N Ca2+ release units (Eqs. 5 and 6). In the probability density formulation, time-dependent multivariate probability densities for the diadic subspace and junctional SR [Ca2+] jointly distributed with CaRU state are updated by solving four coupled advection-reaction equations (Eqs. 19–22), one for each state of the chosen CaRU model (Eq. 3). Further details of the probability density approach are presented in Appendices B–D.
RESULTS
In the following sections, traditional Monte Carlo simulations of voltage-clamp protocols using the minimal whole cell model of EC coupling presented above are shown to produce high-gain Ca2+ release that is graded with changes in membrane potential, a phenomenon not exhibited by so-called “common pool” models of excitation-contraction coupling. Analysis of these Monte Carlo results suggests a simplification of the advection-reaction equations that form the basis of the probability density approach. This reduced probability density formulation is subsequently validated against, and benchmarked for computational efficiency by comparison to, traditional Monte Carlo simulations.
Representative Monte Carlo simulations
Fig. 2 A shows representative Monte Carlo simulations of the minimal whole cell model of EC coupling presented above (Eqs. 1–17 and Appendix A). In this simulated voltage-clamp protocol, the holding potential of −80 mV is followed by a 20-ms duration test potential to −30, −20, and −10 mV (dotted, dot-dashed, and solid lines, respectively). Because these simulations involve a large but finite number of Ca2+ release units (N = 5000), the resulting Ca2+ influx through L-type Ca2+ channels ( ), elevation in the average diadic subspace concentration (
 ), and the induced Ca2+ release flux (
 ) are erratic functions of time. As expected, the test potential of −10 mV leads to greater Ca2+ influx, higher diadic subspace [Ca2+], and more Ca2+ release than the test potentials of −30 and −20 mV. When the test potential is −10 mV a 30× “gain” is observed, here defined as the ratio
  where the overbar indicates an average over the duration of the pulse. Importantly, Ca2+ release exhibited by this Monte Carlo model is graded with changes in membrane potential (compare traces) and depolarization duration (not shown), phenomena that are not exhibited by common pool models of excitation-contraction coupling.
FIGURE 2.

(A) Monte Carlo simulation of the whole cell model exhibits graded release during step depolarization from a holding potential of −80 mV to −30, −20, and −10 mV (dotted, dot-dashed, and solid lines, respectively). From top to bottom: command voltage, average diadic subspace [Ca2+] ( , Eq. 11), total Ca2+ flux via L-type PM Ca2+ channels (
 , Eqs. 8, 13, and 14), and total Ca2+-induced Ca2+ release flux (
 , Eqs. 8 and 15). The simulation used N = 5000 Ca2+ release units. (B) Monte Carlo simulations similar to panel A except that the step potential is −10 (solid lines) and +10 mV (dotted lines), respectively. Here and below parameters are as in Tables 1–3.
Figs. 2 B shows a direct comparison between test potentials of −10 and 10 mV. These test potentials result in nearly identical whole cell Ca2+ currents (averaged over the duration of the pulse,  = 1.6 and 1.4 μM/s, respectively). In spite of this, the induced Ca2+ release flux is significantly greater when the test potential is −10 mV (
 = 47 μM/s) as opposed to 10 mV (21 μM/s). This phenomenon occurs because the L-type channel open probability is greater at 10 mV than −10 mV (Eq. 2), while the driving force for Ca2+ ions is reduced (Eqs. 13 and 14). Although the overall trigger Ca2+ flux is nearly the same at these two test potentials, Ca2+ release is more effectively induced when the trigger Ca2+ is apportioned in larger quantities among a smaller number of diadic subspaces, because the influx that does occur is then more likely to trigger Ca2+ sparks. This physiologically realistic aspect of local control during EC coupling is observed in Monte Carlo simulations (see also (19,21)), but cannot be reproduced by common pool models (7), nor is it seen in models in which SR Ca2+ release depends explicitly on whole-cell Ca2+ current (e.g., (16)).
The solid lines of Fig. 3 show [Ca2+] in the bulk myoplasm (cmyo) and network SR (cnsr) during and after the −10 mV voltage pulse (note change in timescale). Approximately 400 ms is required for the bulk myoplasm and network SR concentrations to return to resting levels. Note that although the voltage pulse ends at t = 30 ms, the bulk myoplasmic [Ca2+] continues to increase for ∼20 ms. Similarly, the network SR [Ca2+] concentration continues to decrease until t = 80 ms.
FIGURE 3.

Solid lines show the dynamics of bulk myoplasmic (cmyo) and network SR (cnsr) [Ca2+] in the whole cell voltage clamp protocol of Fig. 2 with step potential of −10 mV (note longer timescale). Dashed lines show the overall myoplasmic ( , Eq. 10) and network SR (
 , Eq. 12) [Ca2+] that include contributions from diadic subspaces and junctional SR, respectively. Note that
  is only slightly greater than cmyo and the two traces are not distinguishable.
The dashed line of Fig. 3 shows that the total SR [Ca2+] including both network and junctional SR (Eq. 12) is transiently less than the network SR [Ca2+] ( ), reflecting the fact that for several hundred milliseconds after the voltage pulse junctional SR Ca2+ is depleted. While the ratio between the total junctional SR effective volume and the network SR effective volume is
  , the corresponding ratio between the total diadic subspace volume and the myoplasmic volume is much smaller (
 ). Consequently, the elevated average diadic subspace [Ca2+] during the depolarizing voltage step (
 μM as shown in Fig. 2) does not significantly increase the overall myoplasmic [Ca2+] (
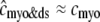 and the two traces overlap in Fig. 3). On the other hand, depleted junctional SR Ca2+ during and after the voltage pulse (
 μM, not shown) represents a significant depletion of the overall SR Ca2+ content (
 in Fig. 3). Although junctional SR depletion develops rapidly after the initiation of the voltage pulse, refilling of these compartments via diffusion of Ca2+ from the network SR (
 in Eq. 6) is not complete until ∼400 ms after the termination of the voltage pulse (compare solid and dashed lines).
Dynamics of a representative Ca2+ release unit
Fig. 4 shows the dynamics of an individual Ca2+ release unit from the Monte Carlo simulations above (test potential of −10 mV, solid line of Fig. 2). Fig. 4 A shows the state of this representative Ca2+ release unit and the associated diadic subspace and junctional SR Ca2+ concentrations. When the DHPR initially opens (transition from state  in Eq. 3) an influx of trigger Ca2+ leads to ∼7 μM increase in diadic subspace [Ca2+] and causes the RyR cluster to open (
 transition). The resulting Ca2+-induced Ca2+ release quickly drives the diadic subspace [Ca2+] to ∼150 μM but over the next 10 ms the resulting decrease in junctional SR [Ca2+] leads to decreasing diadic subspace [Ca2+]. Note that junctional SR depletion is nearly complete in Fig. 4 before the
  transition that ends Ca2+ release; however, this example is not representative in this regard because most sparks terminate via stochastic attrition whereas depletion is only partial. Superimposed on the gradual decrease in diadic subspace [Ca2+] are square pulses of increased [Ca2+] (±7 μM) due to the stochastic openings of the L-type Ca2+ channel associated with this CaRU (
 transitions).
FIGURE 4.

(A) Dynamics of the diadic subspace ( ) and junctional SR (
 ) Ca2+ concentrations associated with a single Ca2+ release unit during the voltage clamp protocol of Figs. 2 and 3. (B) The dynamics of these local Ca2+ concentrations in the (cds,cjsr)-plane. Trajectory color indicates CaRU state: both the L-type channel and the RyR cluster closed (𝒞𝒞, black); L-type channel open and RyR cluster closed (𝒪𝒞, green); L-type channel closed and RyR cluster open (𝒞𝒪, blue); both the L-type channel and the RyR cluster open (𝒪𝒪, red). Colored dashed lines correspond to estimates of diadic subspace [Ca2+] given by Eq. 33.
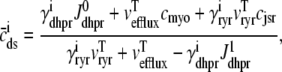
The observation that diadic subspace [Ca2+] decreases during the voltage pulse suggests that its dynamics are fast compared to the time evolution of junctional SR [Ca2+]. In fact, for the physiologically realistic parameters used in Figs. 2–4, the diadic subspace [Ca2+] ( ) is well approximated by assuming quasistatic equilibrium with the junctional SR (
 ), bulk myoplasmic (cmyo), and network SR (cnsr) Ca2+ concentrations. Setting the
  /dt = 0 in Eq. 5 and solving for
  we find that
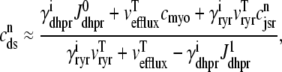 |
(33) |
where  and
and  depend on Ca2+ release unit state and
  and
and  are functions of plasma membrane voltage defined by
 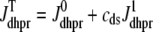 with
with  as in Eq. 28.
Fig. 4 B replots the dynamics of the diadic subspace and junctional SR [Ca2+] shown in Fig. 4 A in the (cds, cjsr)-plane. The black arrows indicate the direction of the trajectories and color of the solid lines indicates CaRU state (𝒞𝒞, black; 𝒪𝒞, green; 𝒪𝒪, red; 𝒞𝒪, blue). The diagonal trajectory is one consequence of diadic subspace [Ca2+] being “slaved” to junctional SR [Ca2+] as the junctional SR depletes. The four colored dotted lines correspond to the four functional relationships between  and
and  given by Eq. 33 (one for each CaRU state). The dynamics of diadic subspace [Ca2+] (solid lines) are well approximated by these dotted lines (save for short time intervals immediately following CaRU state transitions), demonstrating the validity of the quasistatic approximation leading to Eq. 33.
Dynamics of the population of Ca2+ release units
Fig. 4 shows the dynamics of the diadic subspace and junctional SR [Ca2+] associated with a single Ca2+ release unit during a voltage clamp step (Figs. 2 and 3). Conversely, Fig. 5 presents the state of each of the 5000 CaRUs at a particular moment in time (t = 30 ms, halfway through the test potential of −10 mV). To interpret this figure, it is important to understand that the four central panels of Fig. 5 correspond to the four CaRU states and are arranged in a manner corresponding to the transition state diagram of Eq. 3. At this moment during the simulation, ∼5% of the Ca2+ release units have open L-type channels ( ) whereas ∼30% have an open RyR cluster (
 ). Note that for each of the four subpopulations of CaRUs there is a linear relationship between cds and cjsr, that is, the open circles tend to be arranged in lines, the position of which depends on CaRU state (and the slope of which depends on whether or not the RyR cluster is open). Thus, Fig. 5 demonstrates that across the entire population of Ca2+ release units, the observed diadic subspace [Ca2+] is well approximated by the quasistatic approximation given by Eq. 33.
FIGURE 5.

The open circles are a snapshot at t = 30 ms of the diadic subspace ( ) and junctional SR (
 ) Ca2+ concentrations in the Monte Carlo simulation of Fig. 2. Each of the four central panels corresponds to a particular Ca2+ release unit state and size of each subpopulation at this moment is indicated by
  through
  . The horizontally (vertically) oriented histograms give the marginal distribution of diadic subspace (junctional SR) [Ca2+] conditioned on CaRU state. Histograms are scaled for clarity and in some cases also truncated (asterisks).
Fig. 5 also shows histograms of the observed distribution of diadic subspace [Ca2+] (horizontal) and junctional SR [Ca2+] (vertical). The histograms associated with CaRU state 𝒞𝒞 clearly indicate that most of these 3387 CaRUs have replete junctional SR ( ), something that is not obvious from the open circles in the (cds, cjsr)-plane. Similarly, most of the 154 CaRUs in state 𝒪𝒞 are associated with replete junctional SR. Conversely, the junctional SR [Ca2+] for the 1369 CaRUs in state 𝒞𝒪 is broadly distributed with the “average” junctional SR severely depleted (∼100 μM). At t = 30 ms only 90 CaRUs are in state 𝒪𝒪 and the distributions of junctional SR [Ca2+] and diadic subspace [Ca2+] associated with this state are bimodal.
A univariate probability density formulation for junctional SR [Ca2+]
It is important to note that the Monte Carlo simulations presented in Fig. 5 are only a snapshot of the population of 5000 Ca2+ release units. As the simulation progresses, imagine the open circles moving around in these four (cds, cjsr)-planes consistent with Eqs. 5 and 6 with occasional jumps from one plane to another when a CaRU changes state. These four planes are analogous to the four time-dependent joint probability densities that form the basis of the probability density approach presented above (Eq. 18).
The observation that the diadic subspace [Ca2+] is well approximated by Eq. 33 across the entire population of Ca2+ release units (Fig. 5) suggests that the multivariate joint probability density functions defined in Eq. 18 will be well approximated by
 |
(34) |
where  is a function of CaRU state and the junctional SR, bulk myoplasmic, and network SR [Ca2+] analogous to Eq. 33,
 |
(35) |
where  ,
,  ,
,  , and
, and  are as defined in the previous section. The univariate probability density
  (cjsr, t) that appears in Eq. 34 is the marginal density of the junctional SR [Ca2+] jointly distributed with CaRU state defined by
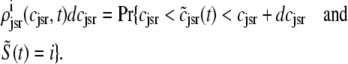 |
(36) |
That is, when the observed form of the joint multivariate probability densities (Eq. 34) is integrated with respect to diadic subspace [Ca2+] we obtain
 |
(37) |
where the last equality uses the unit mass of the δ function, 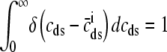 .
.
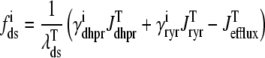
As shown in Appendix C, the observed form of the multivariate probability densities (Eq. 34) and the definition of the marginal density (first equality in Eq. 37) can be used to reduce Eqs. 19–22 into a univariate version of the probability density formulation that focuses on the dynamics of the marginal densities for the junctional SR [Ca2+] jointly distributed with CaRU state [ (cjsr, t)]. The resulting advection-reaction equations are (26–28),
 |
(38) |
 |
(39) |
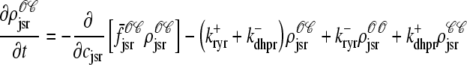 |
(40) |
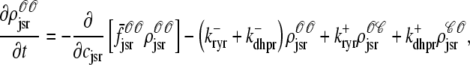 |
(41) |
where the advection rates  ,
,  ,
,  , and
, and  are given by Eq. 24 with the substitution of
  for cds, that is,
 |
(42) |
 |
(43) |
where  is the function of cmyo(t), cjsr, and CaRU state (i) given by Eq. 35.
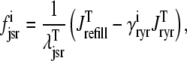
In this univariate probability density formulation, the bulk myoplasmic and network SR [Ca2+] are still given by Eqs. 29 and 30, but Jefflux* and Jrefill* are now functionals of the joint marginal probability densities [ (cjsr, t)],
 |
(44) |
 |
(45) |
Comparison of probability density and Monte Carlo results
The four histograms presented in Fig. 6, A–D, show the marginal distributions of junctional SR [Ca2+] observed in Fig. 5 on identical scales. When presented in this fashion it becomes apparent that at t = 30 ms only a small fraction (∼5%) of the Ca2+ release units have open L-type Ca2+ channels (states 𝒪𝒞 and 𝒪𝒪), while ∼30% contain open RyR clusters ( ). Note that in Fig. 6 A the histogram bin representing Ca2+ release units with closed L-type Ca2+ channel, closed RyR cluster, and replete junctional SR is truncated; in fact, ∼80% of CaRUs in state 𝒞𝒞 have
  . With this understanding, a comparison of Fig. 6, A and B, shows that CaRUs with open RyR clusters are more likely to be depleted than CaRUs with closed RyR clusters, but CaRUs with closed RyR clusters are not necessarily replete, because recovery of junctional SR [Ca2+] is not complete until ∼400 ms after RyR closure (cf. Fig. 3).
FIGURE 6.

Histograms of the junctional SR Ca2+ concentrations ( ) at t = 30 ms in the Monte Carlo simulation of Figs. 2–5 jointly distributed with CaRU state. These histograms are plotted on the same scale, but one is truncated for clarity. For comparison, the solid lines show the four joint probability densities
  ,
,  ,
,  , and
, and  for junctional SR [Ca2+] (Eq. 34) calculated via numerical solution of Eqs. 29, 30, and 38–45. The probability density calculation of the fraction of subunits in each of the four states is denoted by πi (Eq. 46).
The solid lines of Fig. 6, A–D, show snapshots of the four joint probability densities  ,
,  ,
,  , and
, and  as calculated using the probability density approach (t = 30 ms). These results were obtained by numerically solving Eqs. 29, 30, and 38–45 using the numerical scheme presented in Appendix D (parameters as in Figs. 2–5). Importantly, the entire distribution of junctional SR Ca2+ concentrations observed for each CaRU state in the probability density calculation (solid lines) agrees with the corresponding Monte Carlo result (histograms), thereby validating the probability density methodology and our implementation of both approaches. In particular, notice that the fraction of CaRUs in each state given by
 |
(46) |
in the probability density calculation is consistent with the Monte Carlo simulation Fig. 5, for example, in Fig. 6 A  and this corresponds to
  in Fig. 5 A.
While Fig. 6 shows the four marginal probability densities [ (cjsr, t)] for the junctional SR [Ca2+] jointly distributed with CaRU state at a particular moment in time, Fig. 7 A shows the total probability density
 |
(47) |
evolving over time. Initially the mass of this probability density is concentrated at cjsr ≈ 1000 μM (a in Fig. 7). During the 20-ms voltage pulse, a significant fraction of the probability density (∼65%) moves to junctional SR Ca2+ concentrations that are more than half-depleted (b), while ∼35% remains above 500 μM. Interestingly, the probability density remains bimodal for ∼200 ms after the voltage pulse ends (c and d). During this time, the probability mass that corresponds to depleted junctional SR (c) gradually moves to higher values of cjsr as these junctional SR compartments are refilled via Ca2+ transport from the network SR. At the same time, the probability mass that corresponds to replete junctional SR compartments (d) follows the network SR [Ca2+] that decreases from t = 30–100 ms and increases again when t > 100 ms (recall the solid line in Fig. 3). Perhaps most importantly, Fig. 7 shows that the shape and temporal evolution of the distributions that form the basis of the probability density approach can be quite complicated.
FIGURE 7.

Waterfall plot (A) and snapshots (B) of the time evolution of the total probability density for the junctional SR [Ca2+] (ρT(cjsr, t) given by Eq. 47) calculated via numerical solution of Eqs. 29, 30, and 38–45. The solid black lines show the 20-ms voltage step to −10 mV. See text for description of a–d.
Monte Carlo simulations converge to the probability density result
The coupled system of advection-reaction equations used in the univariate probability density approach (Eqs. 38–41) are the master equations for the marginal probability densities for junctional SR [Ca2+] jointly distributed with the Ca2+ release unit state (Eq. 36). Solving these partial differential equations is equivalent to performing Monte Carlo simulation of diadic subspace [Ca2+], junctional SR [Ca2+], and CaRU state provided that: 1), diadic subspace [Ca2+] is a fast dynamic variable in quasistatic equilibrium with junctional SR [Ca2+]; and 2), the number of Ca2+ release units (N) is large enough. Fig. 6 demonstrates agreement between probability density simulations of a minimal whole cell model of EC coupling and corresponding Monte Carlo simulations using N = 5000 CaRUs. Because this agreement will only improve when the number of CaRUs is increased to physiologically realistic values (N = 20,000), the probability density approach is clearly a viable method of modeling heterogeneous diadic subspace and junctional SR [Ca2+] during EC coupling.
Fig. 8 clarifies this point by showing how the total release flux ( , open squares) observed in Monte Carlo simulation converges to the probability density result (solid lines) as the number of Ca2+ release units is increased from N = 50–20,000. Each panel shows a representative Monte Carlo simulation with voltage step to −10 mV (solid gray line) as well as the mean and standard deviation of 10 trials (open squares and error bars). As expected, the fluctuations in the total release flux decrease in magnitude as the number of CaRUs used in the Monte Carlo calculation increases. Similarly, Fig. 9 shows histograms of the junctional SR [Ca2+] (irrespective of CaRU state) at t = 30 ms in Monte Carlo simulations performed with a greater or lesser number of CaRUs. Notice that the probability density function ρT(cjsr, t) (Eq. 47) accurately represents the distribution of junctional SR [Ca2+] so long as the number of CaRUs is 5000 or more. Indeed, in both Figs. 8 and 9 the Monte Carlo simulations are converging to the probability density result well before the Monte Carlo calculations include a physiological number of Ca2+ release units (N = 20,000). This indicates that the probability density approach to modeling local Ca2+ signaling and Ca2+ release unit activity in cardiac myocytes is a viable alternative to Monte Carlo simulation.
FIGURE 8.

Total Ca2+ release flux ( ) in Monte Carlo simulations utilizing increasing numbers of Ca2+ release units (N = 50, 500, 5000, and 20,000, respectively). Each panel shows a representative Monte Carlo simulation (solid gray line) and the mean and standard deviation of 10 trials (open squares and error bars). The solid lines show the corresponding probability density result (same in each panel).
FIGURE 9.

Histograms of junctional SR [Ca2+] ( ) at t = 30 ms in the Monte Carlo simulations similar to Fig. 5 but with increasing numbers of Ca2+ release units (N = 50, 500, 5000, and 20,000, respectively) One bin representing ∼57% probability of a replete junctional SR is truncated for clarity (asterisk). The solid lines show the probability density calculation of ρT(cjsr, t) (Eq. 47), the distribution of the total probability density for the junctional SR [Ca2+] (same in each panel).
The probability density calculation exhibits gain and gradedness
To further compare the probability density and Monte Carlo approaches, Fig. 10 A summarizes a large number of simulated whole cell voltage clamp protocols such as those presented in Fig. 2. The open circles and error bars of Fig. 10 A show the trigger Ca2+ influx via L-type Ca2+ channels integrated over the 20-ms voltage step to test potentials in the range −40–40 mV (mean ± SD for 10 Monte Carlo simulations using 10,000 CaRUs). For comparison, the solid lines of Fig. 10 A show that the trigger Ca2+ influx in the probability density calculation agrees with the Monte Carlo simulations. Similarly, the open squares of Fig. 10 A show the voltage dependence of the Ca2+ release flux plotted in a manner that illustrates the pronounced EC coupling gain in the Monte Carlo calculations, while the dashed lines of Fig. 10 A show that the Ca2+ release flux observed in the corresponding probability density calculations also exhibits high gain. When these trigger and release fluxes are normalized and replotted in Fig. 10 B, the gradedness of Ca2+ release with respect to membrane potential and Ca2+ influx is highlighted. In particular, we note that both the Monte Carlo and probability density calculations exhibit graded Ca2+ release and that the voltage dependence of the EC coupling gain is nearly identical in the two formulations (see Fig. 10 C).
FIGURE 10.

Summary of simulated whole cell voltage clamp protocols such as those presented in Fig. 2 using both the Monte Carlo and probability density formulations. (A) Open circles and error bars show trigger Ca2+ influx via L-type Ca2+ channels integrated over the 20-ms voltage step to test potentials in the range −40–40 mV (mean ± SD for 10 Monte Carlo simulations using 10,000 CaRUs). Open squares and error bars show the voltage dependence of the resulting Ca2+ release. The solid and dashed lines of Fig. 10 A show that the trigger and release fluxes as calculated using the probability density approach agrees with these Monte Carlo simulations. (B) Results from panel A normalized and replotted to emphasize gradedness of Ca2+ release with respect to membrane potential and Ca2+ influx. (C) EC coupling gain as a function of membrane potential for Monte Carlo (open squares and error bars) and probability density (solid line) calculations.
Computational efficiency of the probability density approach
The convergence between the Monte Carlo and probability density calculations presented above indicates that the probability density approach is a viable alternative to Monte Carlo simulations of heterogeneous local [Ca2+] and Ca2+ release unit activity in cardiac myocytes. In fact, as shown in Fig. 10, the probability density approach leads to EC coupling dynamics that are nearly identical to Monte Carlo calculations so long as these Monte Carlo simulations involve a realistic number of Ca2+ release units (N > 5000).
Because the probability density and Monte Carlo calculations are essentially equivalent in terms of the cellular responses they predict, it is of interest to explore the computational efficiency of the two approaches. The solid squares of Fig. 11 show the run time required to perform a simulated whole cell voltage clamp protocol such as those presented in Fig. 2 using traditional Monte Carlo simulation methods. As expected, the run time increases with the number of Ca2+ release units used and this run time scales linearly with the number of CaRUs when N is large. For comparison, the thick dashed line of Fig. 11 shows the 2.1-min run time required for the univariate probability density approach, that is, numerical solution of Eqs. 29, 30, and 38–45 (see Appendix D). Notice that the intersection of the filled squares and the thick dashed line in Fig. 11 shows that a Monte Carlo simulation using ∼500 CaRUs leads to the same run time as the probability density approach. Not only is this smaller than the true number of CaRUs in a ventricular myocyte, but in practice multiple Monte Carlo runs would have to be performed and averaged to obtain a definitive result. For example, if 10 trials are to be averaged as in Fig. 8, then the appropriate comparison is given by the open squares and the thick dashed line and these show that the probability density approach requires less run time than 10 Monte Carlo simulations with 50 CaRUs. Intriguingly, and perhaps most importantly, when the traditional Monte Carlo simulations use a physiologically realistic number of CaRUs, the probability density approach is ∼35 times faster than Monte Carlo (73 vs. 2.1 min). Although the computational efficiency of the probability density approach as compared to Monte Carlo simulation may be model dependent, in the context of this whole cell model an additional 20× acceleration is easily obtained (see thin dotted line in Fig. 8 and Discussion). For this reason we suggest that the probability density approach be further investigated and developed as a computationally efficient alternative to Monte Carlo simulations of the local control of EC coupling in cardiac myocytes.
FIGURE 11.

Solid squares show the run time required to perform a simulated whole cell voltage clamp protocol such as those presented in Fig. 2 using traditional Monte Carlo simulation methods when the number of Ca2+ release units is increased from N = 50 to 20,000. Open squares show 10 times the Monte Carlo run time to account for averaging multiple trials as in Fig. 8. The thick dashed line and thin dot-dashed lines show the run time required for the univariate probability density approach using mesh sizes of L = 50, 100, and 200 and a time step of 1 μs. The thin dotted line shows the univariate probability density approach run time using mesh sizes of L = 100 and a time step of 0.02 ms (see Discussion and Appendix D). Total simulation time is 60 ms.
DISCUSSION
In this article we have introduced, validated, and benchmarked a novel probability density approach to modeling localized Ca2+ influx via L-type Ca2+ channels and Ca2+-induced Ca2+ release mediated by clusters of RyRs during excitation-contraction coupling in cardiac myocytes. To illustrate the approach we have focused on a minimal whole cell model of cardiac EC coupling that includes a four-state Ca2+ release unit representing voltage-dependent activation of an L-type Ca2+ channels as well as Ca2+-induced Ca2+ release mediated by a two-state RyR cluster that includes regulation by both diadic subspace and junctional SR Ca2+. However, it is important to note that the probability density formulation does not require a minimal Ca2+ release unit model; in fact, the approach is fully generalizable to CaRUs with an arbitrary number of states (see Appendix B).
As illustrated by leftmost schematic in Fig. 12, the Monte Carlo formulation of the minimal whole cell model of EC coupling that is the focus of this article includes 2 + 2N ordinary differential equations representing [Ca2+] balance for the bulk myoplasm, network SR, N diadic subspaces, and N junctional SRs. Alternatively, the probability density formulation represents the dynamics of these heterogeneous local Ca2+ signals using a system of advection-reaction equations for the time-dependent probability density of diadic subspace and junctional SR [Ca2+] conditioned on Ca2+ release unit state. In this formulation, the number of equations (M) is equal the number of unique states that define the gating behavior of the CaRU. As originally derived, these joint probability densities are two-dimensional, that is, at a specified time they are functions of both cds and cjsr. The system of advection-reaction equations satisfied by these multivariate probability densities is the “master equation” for diadic subspace and junctional SR [Ca2+] jointly distributed with the Ca2+ release unit state. The only approximation used in the derivation of these equations is that the number of CaRUs units is very large ( ).
).
FIGURE 12.

(From left to right) Schematic representation of the (2N + 2)-compartment Monte Carlo model of the local control of EC coupling that is the starting point of this article. Schematic representation of the multivariate “Probability Density” formulation that can be reduced to the univariate probability density formulation when diadic subspace Ca2+ is in quasistatic equilibrium with junctional SR Ca2+ (slaved diadic subspace). An alternative reduction is possible if diadic subspace and junctional SR Ca2+ are both fast dynamic variables (fast domain limit). The large open squares represent the (cds,cjsr)-plane of the probability density approach and the dotted lines represent the cds and cjsr nullclines. Values in brackets show how run times of each method scale with increasing number of Ca2+ release units (N), number of Ca2+ release unit states (M), and the number of mesh points used in the probability density approach (L).
In the Monte Carlo simulations of the whole cell model of cardiac EC coupling we observed that diadic subspace [Ca2+] was in quasistatic equilibrium with junctional SR [Ca2+]. Fig. 12 illustrates this feature of the simulations with two thick gray lines in two (cds,cjsr)-planes labeled “slaved diadic subspace” (the lines have different slopes as in Fig. 5). In this situation the multivariate probability density functions defined in Eq. 18 are well approximated by univariate (marginal) probability densities representing the time-dependent probability density of junctional sarcoplasmic reticulum [Ca2+] jointly distributed with CaRU state. These marginal probability densities are one-dimensional, that is, at a specified time they are functions of cjsr (illustrated by narrow rectangles in Fig. 12). When the system of advection-reaction equations satisfied by these marginal probability densities was solved numerically using a high-resolution finite difference scheme (see Appendix D), a realistic but minimal model of cardiac excitation-contraction coupling is produced that includes a novel representation of heterogeneous junctional SR [Ca2+].
Importantly, we have validated this novel probability density approach to modeling local control of Ca2+ release against traditional Monte Carlo simulations with a physiologically realistic number of CaRUs. In simulated voltage-clamp protocols, the univariate probability density formulation of our whole cell model of cardiac EC coupling produced high-gain Ca2+ release that was graded with changes in membrane potential. Indeed, the voltage dependence of trigger Ca2+ influx via L-type Ca2+ channels, the resulting Ca2+ release via RyR clusters, and the observed EC coupling gain obtained using the univariate probability density formulation are nearly identical to that seen in corresponding Monte Carlo calculations. This agreement validates the conceptually novel aspects of the probability density formulation as well as our implementation of both approaches.
Relationship to other simplified models of EC coupling
It is instructive to compare and contrast the probability density approach introduced in this article to models of the local control of EC coupling that have previously appeared. As shown diagrammatically in Fig. 12, the Monte Carlo local control model of EC coupling that is our starting point includes 2N + 2 compartments, similar to the functional organization of some previously published Monte Carlo models of local control (19), but distinct from two recently published simplified models (20,21) that do not make a distinction between junctional and network SR.
The one requirement for the validity of the multivariate probability density approach is that the number of CaRUs units is very large (denoted by  in Fig. 12). Although previously published models of local control also assume that the number of CaRUs is very large (20,21), the multivariate probability density approach represents this “large system size” limit in a manner that accounts for the heterogeneous diadic subspace and junctional SR Ca2+ concentrations.
Similar to previously published simplified models of local control (20,21), we make use of the fact that diadic subspace Ca2+ is a fast dynamic variable. Because Hinch (20) and Greenstein et al. (21) do not distinguish junctional and network SR, the assumption of fast diadic subspace Ca2+ immediately leads to a simplified local control model involving M ODEs (one for each CaRU state). Conversely, in this article the observation that diadic subspace Ca2+ is in quasistatic equilibrium with junctional SR Ca2+ allows us to reduce the multivariate probability density formulation to a univariate form that still accounts for the dynamics of junctional SR depletion. This reduction from the multivariate to univariate probability density approach is denoted by the arrow labeled “fast ds/slow jsr” in Fig. 12.
Note that if diadic subspace and junctional SR [Ca2+] changes were both fast compared to the stochastic gating of Ca2+ release units, the Monte Carlo simulations of Fig. 2 would have revealed δ-function-like probability densities. That is, rather than observing the linear relationship between diadic subspace and junctional SR [Ca2+] in each (cds,cjsr)-plane that suggested Eq. 34, we would instead have observed that the probability density in each plane was well approximated by
 |
where 1 ≤ i ≤ M is the index over CaRU states and  and
and  are functions of cmyo and cnsr found by simultaneously solving Eqs. 5 and 6 with the left-hand sides equal to zero. Although this “fast domain limit” was not observed in our Monte Carlo simulations, for completeness it is denoted in Fig. 12 by the arrow labeled “fast ds/fast jsr”. If the simplified models of local control that have previously appeared (20,21) were generalized to account for heterogeneous junctional SR [Ca2+], they would correspond to the “fast domain limit” of the multivariate probability density approach presented here.
Computational efficiency of the probability density approach
While the probability density and Monte Carlo calculations are essentially equivalent in terms of the dynamics cellular responses they predict, the probability density approach can be significantly faster than Monte Carlo simulation (Fig. 11). Indeed, when both methods are applied using the same (nonadaptive) time step, our current implementation of the univariate probability density approach is ∼35× faster than Monte Carlo simulations that employ a physiologically realistic number of CaRUs. Intriguingly, when this comparison is made using time steps that are distinct and as large as possible while ensuring numerical stability and accuracy of each calculation, we find that the univariate probability density approach can be up to 650× faster than the corresponding Monte Carlo simulations. For example, the thin dotted line of Fig. 11 indicates a 6.6-s run time for the probability density approach with a time step of 0.02 ms. This suggests that the probability density approach could be further investigated and developed as a computationally efficient alternative to Monte Carlo simulations of the local control of EC coupling in cardiac myocytes.
Although the computational efficiency of the probability density approach is intriguing, it is important to note that the relative merits of Monte Carlo and probability density simulation methods are in general model dependent. For example, the time required for the Monte Carlo simulation of the whole cell voltage clamp protocols such as those presented in Fig. 2 is, at least ultimately, a linear function of the number of CaRUs (i.e., the limiting slope of the solid squares of Fig. 10 is one). Similarly, we have observed that the computational efficiency of the univariate probability density calculation presented in Figs. 6 and 7 scales linearly with the number of Ca2+ release unit states (M) and the number of mesh points used to discretize the junctional SR [Ca2+] (L) (not shown). Indeed, the thin dotted lines of Fig. 11 show the run time of the probability density approach decreasing or increasing by a factor of two when the standard number of mesh points (L = 100) is decreased or increased to 50 or 200, respectively. Of course, the standard value of L = 100 was chosen because further refinement resulted in a negligible change in the probability density result. However, we expect that the number of mesh points required for an accurate probability density calculation will generally depend on the details of the chosen Ca2+ release unit model. In the same way, increasing the number M of CaRU states will lead to a less efficient probability density calculation.
Indeed, the relative merits of the probability density and Monte Carlo simulation methods can be clarified if we assume that the computational effort involved in updating one mesh point of the probability density calculation is equivalent to Monte Carlo simulation of one Ca2+ release unit. If we let N denote the number of Ca2+ release units, M the number of states of the CaRU model, and L the number of mesh points used in the probability density calculation, then in a traditional Monte Carlo calculation, there are 2N ODEs to integrate for the local Ca2+ concentrations as well as N Markov chains to update at each time step, for a (very roughly calculated) computational effort of 3N. Conversely, in the univariate probability density approach, there are M partial differential equations (PDEs) to solve with L mesh points each, for a computational effort of ML. Given the fact that the physiologically realistic number of CaRUs is N = 20,000 and the observed number of mesh points required in our probability density calculations is L = 100, we might have expected the univariate probability density approach to be ∼150× computationally more efficient than Monte Carlo for the minimal M = 4 state CaRU model used here (consistent with the observed values of 35–700 in Fig. 11). Continuing this reasoning, we might expect the univariate probability density approach to outperform Monte Carlo calculations for any CaRU model with fewer than 600 states (M ≤ 3N/L).
On the other hand, if model parameters were such that it was not a good approximation to assume that in each CaRU diadic subspace [Ca2+] is in quasistatic equilibrium with junctional SR [Ca2+], then the appropriate probability density alternative to Monte Carlo simulation would be multivariate. In this case, each of the M joint probability densities would require a two-dimensional L × L mesh that discretizes both the diadic subspace and junctional SR [Ca2+]. If we presume that the computational effort of the multivariate probability density approach scales as ML2, then we would expect it to be superior to Monte Carlo calculations involving N = 20,000 CaRUs when the chosen CaRU model has fewer than six states (M ≤ 3N/L2). Consistent with this back-of-the-envelope estimate, when we do not assume fast diadic subspace [Ca2+] but instead numerically solve the two-dimensional system of advection-reaction equations given by Eqs. 19–22, we find the multivariate probability density approach is only marginally faster than Monte Carlo simulation (not shown). However, these estimates and preliminary benchmarks fail to account for accelerations of the multivariate probability density approach that could be obtained by using more sophisticated numerical schemes (e.g., a nonuniform or adaptive mesh) and model reduction techniques applicable to the probability density but not the Monte Carlo formulation. For this reason we recommend the probability density approach for further development as a computationally efficient alternative to Monte Carlo simulations of the local control of EC coupling in cardiac myocytes.
Acknowledgments
Some preliminary results appeared previously in abstract form (29).
This material is based on work supported by the Joint Division of Mathematical Sciences/National Institute of General Medical Sciences Initiative to Support Research in the Area of Mathematical Biology (National Science Foundation Grant No. 0443843 to M.S.J., E.A.S., and G.D.S.) and National Science Foundation Molecular and Cell Biology CAREER award No. 0133132 to G.D.S. We utilized computational facilities at the College of William and Mary enabled by grants from the National Science Foundation and Sun Microsystems.
APPENDIX A: DESCRIPTION OF FLUXES INFLUENCING BULK MYOPLASMIC AND NETWORK SR [Ca2+]
The whole cell model of EC coupling that is the focus of this article includes several fluxes that directly influence the dynamics of the bulk myoplasmic and network SR [Ca2+]. For example, the Na+-Ca2+ exchanger current that appears in Eq. 29 takes the form (4,3,32),
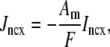 |
where
 |
Am = Cmβmyo/Vmyo, cext is the extracellular Ca2+ concentration, and [Na+]myo and [Na+]ext are the intracellular and extracellular sodium concentrations, respectively (for parameters see Tables 1 and 3).
TABLE 1.
Model parameters: volume fractions, Ca2+ buffering, and exchange between restricted domains and the bulk, physical constants, and fixed ion concentrations
| Parameter | Definition | Value |
|---|---|---|
| N | No. of diadic subspaces | 50–20,000 |
| Vnsr | Network SR volume | 3.15 × 10⁻⁷μL |
| Vmyo | Myoplasmic volume | 2.15 × 10⁻⁵μL |
 |
Total diadic subspace volume | 2 × 10⁻⁸μL |
 |
Total junctional SR volume | 3.5 × 10⁻⁸μL |
| Cm | Capacitive membrane area | 1.534 × 10⁻⁴μF |
| βds | Subspace buffering factor | 0.5 |
| βjsr | Junctional SR buffering factor | 0.05 |
| βnsr | Network SR buffering factor | 1.0 |
| βmyo | Myoplasmic buffering factor | 0.05 |
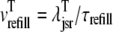 |
Junctional SR refilling rate | 0.018 s−1 |
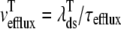 |
Diadic subspace efflux rate | 5.2 s−1 |
| F | Faraday's constant | 96,480 coul mol−1 |
| R | Gas constant | 8314 mJ mol−1 K−1 |
| T | Absolute temperature | 310 K |
| cext | Extracellular Ca2+ concentration | 1.8 mM |
| [Na+]ext | Extracellular Na+ concentration | 140 mM |
| [Na+]myo | Intracellular Na+ concentration | 10.2 mM |
TABLE 3.
Model parameters: Na+-Ca2+ exchange current, SERCA pumps, and background Ca2+ influx
| Parameter | Definition | Value |
|---|---|---|
| Kfs | Forward half-saturation constant for SERCA pump | 0.17 μM |
| Krs | Reverse half-saturation constant | 1702 μM |
| ηfs | Forward cooperativity constant | 0.75 |
| ηrs | Reverse cooperativity constant | 0.75 |
| vserca | Maximum SERCA pump rate | 8.6 μM s−1 |
 |
Magnitude of Na+-Ca2+ exchange current | 150 μA μF−1 |
| Kncx,n | Na+ half saturation constant | 87.5 × 10³μM |
| Kncx,c | Ca2+ half saturation constant | 1.38 × 10³μM |
 |
Saturation factor | 0.1 |
| ηncx | Voltage dependence of Na+-Ca2+ exchange | 0.35 |
| vleak | SR Ca2+ leak rate constant | 2.4 × 10⁻⁶ s−1 |
| gin | Maximum conductance of background Ca2+ influx | 1.5 × 10⁻⁴ mS μF−1 |
TABLE 2.
Ca2+ release unit parameters (L-type Ca2+ channel and RyR cluster)
| Parameter | Definition | Value |
|---|---|---|
 |
Total RyR cluster release rate | 0.9 s−1 |
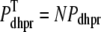 |
Total DHPR permeability | 3.5 × 10⁻⁵ cm s−1 |
 |
DHPR activation threshold | −10 mV |
| σdhpr | DHPR activation parameter | 6.24 mV |
 |
Maximum rate of DHPR opening | 556 s−1 |
 |
Rate of DHPR closing | 5000 s−1 |
 |
Maximum rate of RyR opening | 2000 s−1 |
 |
Rate of RyR closing | 100 s−1 |
 |
Maximum binding constant for RyR | 7.4 μM |
| αryr | Coefficient of RyR luminal regulation | 0.0024 |
The SERCA-type Ca-ATPase flux that appears in Eqs. 29 and 30 includes both forward and reverse modes (33) and is given by
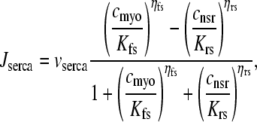 |
(48) |
with parameters as in Table 3. In addition, Eqs. 29 and 30 include a leakage Ca2+ flux given by 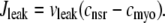
Following Rice et al. (32), Eq. 29 includes a constant background Ca2+ influx that takes the form,
 |
where Iin = gin(V − ECa) and ECa = (RT/2F) ln(cext/cmyo).
APPENDIX B: GENERALIZATION OF THE PROBABILITY DENSITY APPROACH
The probability density approach is completely general and in principle the methodology can be applied to Ca2+ release unit models of arbitrary complexity. Let S(t) = i ∈ {1, . . . , M} be the state of a continuous time discrete state Markov chain model of an individual Ca2+ release unit and let the M × M matrix Q be the infinitesimal generator matrix for this stochastic process composed of rates that may be constant or, alternatively, arbitrary functions of voltage, diadic subspace [Ca2+], or junctional SR [Ca2+]. Let us also rewrite the multivariate probability density functions defined in Eq. 18 using slightly more compact notation,
 |
where c is a vector including both the diadic subspace and junctional SR Ca2+ concentrations. Using Bayes' formula these joint probability densities can be related to the probability densities for diadic subspace and junctional SR [Ca2+] conditioned on the state of the channel,
 |
That is, if the probability density  is integrated over all possible diadic subspace and junctional SR Ca2+ concentrations, the probability πi of finding the randomly sampled Ca2+ release unit in state i is obtained,
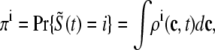 |
where  .
.
Using this notation, the advection-reaction equations (Eqs. 19–22) for the probability density of diadic subspace and junctional SR [Ca2+] jointly distributed with the state of the Ca2+ release unit become,
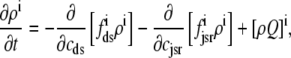 |
(49) |
where ρ is a row vector given by 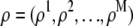 in which each element ρi is a function of cds and cjsr; and
  is the ith element of the row vector resulting from a vector-matrix product of ρ and Q.
APPENDIX C: DERIVATION OF THE UNIVARIATE PROBABILITY DENSITY APPROACH
Using Eqs. 34–37 the advection-reaction equations of the multivariate probability density formulation (Eqs. 19–22) can be reduced to the univariate version (Eqs. 38–41). For example, here we show that making the substitution given by Eq. 34 in Eq. 22 and integrating the resulting equations with respect to diadic subspace [Ca2+] leads term by term to Eq. 41. The first term of the left-hand side of Eq. 22 involving the partial derivative with respect to time becomes
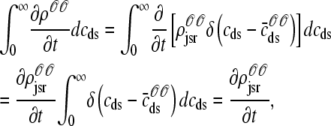 |
i.e., the first term of Eq. 41. The first term on the right-hand side of Eq. 22 involving the partial derivative with respect to cds is disappears, that is,
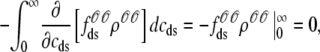 |
because the probability density 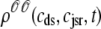 evaluates to zero at the minimum and maximum physical values for diadic subspace [Ca2+]. The second term on the right-hand side of Eq. 22 involving the partial derivative with respect to cjsr becomes
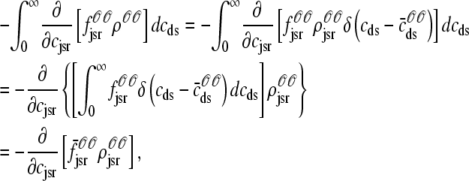 |
where  due to the sifting property of the δ function, in agreement with Eqs. 41 and 43. Finally, the three reaction terms in Eq. 22 reduce as required because
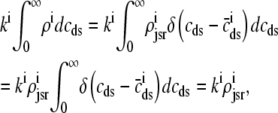 |
where  , 𝒪𝒞, and 𝒞𝒪;
  ,
,  .
.
APPENDIX D: NUMERICAL SCHEME FOR THE UNIVARIATE PROBABILITY DENSITY APPROACH
In the notation of Appendix B, the advection-reaction equations (Eqs. 38–41) used in the univariate probability density approach take the form,
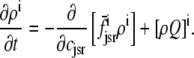 |
(50) |
Numerical solution of these equations was performed using a total variation diminishing scheme following (36,37). Briefly, we discretize junctional SR [Ca2+] according to cjsr, =
=  Δcjsr +
  where
where  = 0, 1, ···, L and Δcjsr = (
 )/L. With these preliminaries, the numerical scheme can be written as
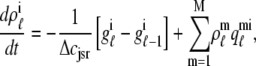 |
where  is the transition rate in the mth row and ith column of Q evaluated at a junctional SR [Ca2+] of cjsr,
  . In this expression,
  and
and  are given by
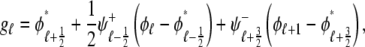 |
(51) |
where we have dropped the superscripted i,  , and
, and  is the first-order Roe flux defined by (36,38)
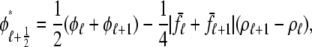 |
where  is the discretized advection rate appearing in Eq. 50. The quantities ψ+ and ψ− occurring in Eq. 51 are flux limiters given by
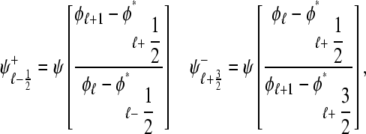 |
where
 |
The ordinary differential equations in the univariate model (Eqs. 29–30) were integrated using Euler's method with a time step of 1 μs. The efflux and refill fluxes of Eqs. 31 and 32 were approximated by
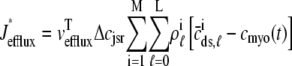 |
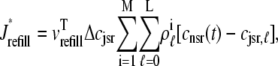 |
where  is given by Eq. 35 with the junctional SR [Ca2+] evaluated at cjsr,
 .
.
References
- 1.DiFrancesco, D., and D. Noble. 1985. A model of cardiac electrical activity incorporating ionic pumps and concentration changes. Philos. Trans. R. Soc. Lond. B Biol. Sci. 307:353–398. [DOI] [PubMed] [Google Scholar]
- 2.Nordin, C. 1993. Computer model of membrane current and intracellular Ca2+ flux in the isolated guinea pig ventricular myocyte. Am. J. Physiol. 265:H2117–H2136. [DOI] [PubMed] [Google Scholar]
- 3.Jafri, M., J. Rice, and R. Winslow. 1998. Cardiac Ca2+ dynamics: the roles of ryanodine receptor adaptation and sarcoplasmic reticulum load. Biophys. J. 74:1149–1168. [DOI] [PMC free article] [PubMed] [Google Scholar]
- 4.Luo, C., and Y. Rudy. 1994. A dynamic model of the cardiac ventricular action potential. II. Afterdepolarizations, triggered activity, and potentiation. Circ. Res. 74:1097–1113. [DOI] [PubMed] [Google Scholar]
- 5.Cheng, H., W. Lederer, and M. Cannell. 1993. Calcium sparks: elementary events underlying excitation-contraction coupling in heart muscle. Science. 262:740–744. [DOI] [PubMed] [Google Scholar]
- 6.Cannell, M., H. Cheng, and W. Lederer. 1995. The control of calcium release in heart muscle. Science. 268:1045–1049. [DOI] [PubMed] [Google Scholar]
- 7.Stern, M. 1992. Theory of excitation-contraction coupling in cardiac muscle. Biophys. J. 63:497–517. [DOI] [PMC free article] [PubMed] [Google Scholar]
- 8.Glukhovsky, A., D. Adam, G. Amitzur, and S. Sideman. 1998. Mechanism of Ca2+ release from the sarcoplasmic reticulum: a computer model. Ann. Biomed. Eng. 26:213–229. [DOI] [PubMed] [Google Scholar]
- 9.Snyder, S., B. Palmer, and R. Moore. 2000. A mathematical model of cardiocyte Ca2+ dynamics with a novel representation of sarcoplasmic reticular Ca2+ control. Biophys. J. 79:94–115. [DOI] [PMC free article] [PubMed] [Google Scholar]
- 10.Tang, Y., and H. Othmer. 1994. A model of calcium dynamics in cardiac myocytes based on the kinetics of ryanodine-sensitive calcium channels. Biophys. J. 67:2223–2235. [DOI] [PMC free article] [PubMed] [Google Scholar]
- 11.Fabiato, A. 1985. Time and calcium dependence of activation and inactivation of calcium-induced release of calcium from the sarcoplasmic reticulum of a skinned canine cardiac Purkinje cell. J. Gen. Physiol. 85:247–289. [DOI] [PMC free article] [PubMed] [Google Scholar]
- 12.Wier, W., T. Egan, J. Lpez-Lpez, and C. Balke. 1994. Local control of excitation-contraction coupling in rat heart cells. J. Physiol. 474:463–471. [DOI] [PMC free article] [PubMed] [Google Scholar]
- 13.Bondarenko, V., G. Bett, and R. Rasmusson. 2004. A model of graded calcium release and L-type Ca2+ channel inactivation in cardiac muscle. Am. J. Physiol. Heart Circ. Physiol. 286:H1154–H1169. [DOI] [PubMed] [Google Scholar]
- 14.Wong, A., A. Fabiato, and J. Bassingwaigthe. 1992. Model of calcium-induced calcium release in cardiac cells. Bull. Math. Biol. 54:95–116. [DOI] [PMC free article] [PubMed] [Google Scholar]
- 15.Hilgemann, D., and D. Noble. 1987. Excitation-contraction coupling and extracellular calcium transients in rabbit atrium: reconstruction of basic cellular mechanisms. Proc. R. Soc. Lond. B Biol. Sci. 230:163–205. [DOI] [PubMed] [Google Scholar]
- 16.Shiferaw, Y., M. Watanabe, A. Garfinkel, J. Weiss, and A. Karma. 2003. Model of intracellular calcium cycling in ventricular myocytes. Biophys. J. 85:3666–3686. [DOI] [PMC free article] [PubMed] [Google Scholar]
- 17.Rice, J., M. Jafri, and R. Winslow. 1999. Modeling gain and gradedness of Ca2+ release in the functional unit of the cardiac diadic space. Biophys. J. 77:1871–1884. [DOI] [PMC free article] [PubMed] [Google Scholar]
- 18.Sobie, E., K. Dilly, J. dos Santos Cruz, W. Lederer, and M. Jafri. 2002. Termination of cardiac Ca2+ sparks: an investigative mathematical model of calcium-induced calcium release. Biophys. J. 83:59–78. [DOI] [PMC free article] [PubMed] [Google Scholar]
- 19.Greenstein, J., and R. Winslow. 2002. An integrative model of the cardiac ventricular myocyte incorporating local control of Ca2+ release. Biophys. J. 83:2918–2945. [DOI] [PMC free article] [PubMed] [Google Scholar]
- 20.Hinch, R. 2004. A mathematical analysis of the generation and termination of calcium sparks. Biophys. J. 86:1293–1307. [DOI] [PMC free article] [PubMed] [Google Scholar]
- 21.Greenstein, J., R. Hinch, and R. Winslow. 2006. Mechanisms of excitation-contraction coupling in an integrative model of the cardiac ventricular myocyte. Biophys. J. 90:77–91. [DOI] [PMC free article] [PubMed] [Google Scholar]
- 22.Chen-Izu, Y., S. McCulle, C. Ward, C. Soeller, B. Allen, C. Rabang, M. Cannell, C. Balke, and L. Izu. 2006. Three-dimensional distribution of ryanodine receptor clusters in cardiac myocytes. Biophys. J. 91:1–13. [DOI] [PMC free article] [PubMed] [Google Scholar]
- 23.Cleemann, L., W. Wang, and M. Morad. 1998. Two-dimensional confocal images of organization, density, and gating of focal Ca2+ release sites in rat cardiac myocytes. Proc. Natl. Acad. Sci. USA. 95:10984–10989. [DOI] [PMC free article] [PubMed] [Google Scholar]
- 24.Terentyev, D., S. Viatchenko-Karpinski, H. Valdivia, A. Escobar, and S. Gyšrke. 2002. Luminal Ca2+ controls termination and refractory behavior of Ca2+ -induced Ca2+ release in cardiac myocytes. Circ. Res. 91:414–420. [DOI] [PubMed] [Google Scholar]
- 25.Brochet, D., D. Yang, A. D. Maio, W. Lederer, C. Franzini-Armstrong, and H. Cheng. 2005. Ca2+ blinks: rapid nanoscopic store calcium signaling. Proc. Natl. Acad. Sci. USA. 102:3099–3104. [DOI] [PMC free article] [PubMed] [Google Scholar]
- 26.Mazzag, B., C. Tignanelli, and G. Smith. 2005. The effect of residual Ca2+ on the stochastic gating of Ca2+ -regulated Ca2+ channel models. J. Theor. Biol. 235:121–150. [DOI] [PubMed] [Google Scholar]
- 27.Huertas, M., and G. Smith. 2006. a. The dynamics of luminal depletion and the stochastic gating of Ca2+-activated Ca2+ channels and release sites. J. Theor. Biol. In press. [DOI] [PubMed]
- 28.Huertas, M., and G. Smith. 2006. b. The effect of luminal depletion on the dynamics of Ca2+ -regulated Ca2+ channels. Biophysical Society Annual Meeting. 1078-Pos.
- 29.Williams, G., M. Huertas, E. Sobie, M. Jafri, and G. Smith. 2006. A probability density model of stochastic functional unit activity in cardiac myocytes. Biophysical Society Annual Meeting. 1079-Pos.
- 30.Bers, D., and V. Stiffel. 1993. Ratio of ryanodine to dihydropyridine receptors in cardiac and skeletal muscle and implications for E-C coupling. Am. J. Physiol. 264:C1587–C1593. [DOI] [PubMed] [Google Scholar]
- 31.Franzini-Armstrong, C. 1999. The sarcoplasmic reticulum and the control of muscle contraction. FASEB J. 13(Suppl 2):S266–S270. [DOI] [PubMed] [Google Scholar]
- 32.Rice, J., M. Jafri, and R. Winslow. 2000. Modeling short-term interval-force relations in cardiac muscle. Am. J. Physiol. Heart Circ. Physiol. 278:H913–H931. [DOI] [PubMed] [Google Scholar]
- 33.Shannon, T., K. Ginsburg, and D. Bers. 2000. Reverse mode of the sarcoplasmic reticulum calcium pump and load-dependent cytosolic calcium decline in voltage-clamped cardiac ventricular myocytes. Biophys. J. 78:322–333. [DOI] [PMC free article] [PubMed] [Google Scholar]
- 34.Bertram, R., and A. Sherman. 1998. Population dynamics of synaptic release sites. SIAM J. Appl. Math. 58:142–169. [Google Scholar]
- 35.Nykamp, D., and D. Tranchina. 2000. A population density approach that facilitates large-scale modeling of neural networks: analysis and an application to orientation tuning. J. Comput. Neurosci. 8:19–50. [DOI] [PubMed] [Google Scholar]
- 36.Casti, A., A. Omurtag, A. Sornborger, E. Kaplan, B. Knight, J. Victor, and L. Sirovich. 2002. A population study of integrate-and-fire-or-burst neurons. Neural Comput. 14:957–986. [DOI] [PubMed] [Google Scholar]
- 37.Huertas, M., and G. Smith. 2006. A multivariate population density model of the dLGN/PGN relay. J. Comput. Neurosci. 21:171–189. [DOI] [PubMed] [Google Scholar]
- 38.Hundsdorfer, W., and J. Verwer. 2003. Numerical solution of time-dependent advection-diffusion-reaction equations. Springer.