Abstract
Molecular dynamics simulations are used to measure the change in properties of a hydrated dipalmitoylphosphatidylcholine bilayer when solvated with ethanol, propanol, and butanol solutions. There are eight oxygen atoms in dipalmitoylphosphatidylcholine that serve as hydrogen bond acceptors, and two of the oxygen atoms participate in hydrogen bonds that exist for significantly longer time spans than the hydrogen bonds at the other six oxygen atoms for the ethanol and propanol simulations. We conclude that this is caused by the lipid head group conformation, where the two favored hydrogen-bonding sites are partially protected between the head group choline and the sn-2 carbonyl oxygen. We find that the concentration of the alcohol in the ethanol and propanol simulations does not have a significant influence on the locations of the alcohol/lipid hydrogen bonds, whereas the concentration does impact the locations of the butanol/lipid hydrogen bonds. The concentration is important for all three alcohol types when the lipid chain order is examined, where, with the exception of the high-concentration butanol simulation, the alcohol molecules having the longest hydrogen-bonding relaxation times at the favored carbonyl oxygen acceptor sites also have the largest order in the upper chain region. The lipid behavior in the high-concentration butanol simulation differs significantly from that of the other alcohol concentrations in the order parameter, head group rotational relaxation time, and alcohol/lipid hydrogen-bonding location and relaxation time. This appears to be the result of the system being very near to a phase transition, and one occurrence of lipid flip-flop is seen at this concentration.
INTRODUCTION
The first line of defense for a cell against intrusive extracellular molecules is the plasma membrane. This protective barrier, a double layer of lipid molecules with a potpourri of membrane proteins, must be resilient in preventing unwanted small molecules from passing through the membrane because a change in the intracellular ion concentration could be detrimental to the cell. Because of its hydrophobic interior, the lipid bilayer prevents the passage of most polar molecules. The rate of molecule permeation depends on molecule size and hydrophobicity, and small nonpolar molecules such as O2 can easily diffuse across the bilayer. The interactions between a bilayer and small molecules that are amphiphilic, such as short-chained alcohols, have more exotic diffusivity behavior. Because the hydrophobic portion of an alcohol favorably interacts with lipid hydrocarbon chains, the polar hydroxyl group remains free to form hydrogen bonds with polar lipid atoms that are located near the water/lipid interface. Even in lipid-free environments, short-chain alcohols in an aqueous solution will aggregate as the alcohol concentration increases to prevent unfavorable interactions between the hydrophobic alkyl chains and water (1).
Membrane fluidity is often examined when the interactions between small molecules and a lipid bilayer are studied (2,3). A variety of factors alter membrane fluidity, such as bilayer composition and temperature. For example, yeast and bacteria modify the composition of their membranes to control its fluidity. In eukaryotes, low concentrations of cholesterol increase lipid bilayer rigidity, whereas high concentrations prevent crystallization of lipid hydrocarbon chains. Membrane fluidity is also dependent on temperature, as has been seen in both simulations and experiments (2,4).
Membrane fluidity may also play a role in anesthesia. Even though anesthesia is widely used in many medical applications and has been the subject of many simulation studies (5–7), the interplay between anesthetic molecules and cells is still not completely understood. Anesthetic molecules can interact with transmembrane ion channels and render them dysfunctional, which can inhibit cellular communication. One possibility is that anesthetic molecules diffuse into the lipid bilayer, which results in an increase in lateral pressure on neighboring transmembrane proteins (8,9).
Because membrane lipids serve as a solvent for transmembrane proteins whose conformations may be altered in the presence of anesthetics, it is important to examine how anesthetic molecules alter the structure and behavior of a lipid membrane. Both Meyer and Overton found that the potency of an anesthetic molecule increases with its solubility in olive oil (10–12). To further explore this finding, we examine how short-chained alcohols (specifically ethanol, propanol, and butanol molecules) alter the fluidity of a dipalmitoylphosphatidylcholine (DPPC) lipid bilayer. Molecular dynamics (MD) simulations are ideal for this study because they provide a detailed picture of the structural and dynamic changes of individual lipid molecules as well as a glimpse at hydrogen bond formation. There have been a number of other atomistic and mesoscale studies that have examined the interactions between a lipid bilayer and alcohol molecules (3,13–20), and we extend their results by examining how alcohol chain length and concentration influence interactions between alcohol molecules and a DPPC bilayer.
SIMULATION METHODS
Our simulations consist of a fully hydrated bilayer with 128 DPPC molecules (64 per leaflet) and 3655 water molecules. The DPPC lipid structure was based on a united atom model where the lipid acyl chain hydrogen atoms are not explicitly represented. The starting configuration for the bilayer was obtained from the Tieleman group website (21). The GROMOS87 force field (22) was used for the lipid headgroups, and the NERD force field (23–25) was used for the acyl chain tails. The alcohol structures are also based on the united atom model, and therefore only the hydroxyl hydrogen is explicitly represented. The alcohol bonded and nonbonded parameters are from the GROMOS87 force field (22); the water parameters come from the Simple Point Charge (SPC) model (26).
To examine how alcohol chain length and concentration affect the mechanical properties of a phospholipid bilayer, we simulated seven systems, six of which include a DPPC bilayer and an alcohol solution. The seventh system served as a control and did not include alcohol molecules. In this article, the alcohol concentration refers to the moles of alcohol initially located in the alcohol/water mixture. Alcohol concentration can also be defined as the moles of alcohol located in the bulk solvent (17). In Table 1, we report the six alcohol concentrations using both definitions. To distinguish between the two concentrations for each alcohol chain length, we will refer to one as having a low concentration and the second as having a high concentration. The alcohol molecules were added to the bilayer/water system by increasing the simulation box size in the z direction and inserting the alcohol molecules into the newly created volume. We concluded that the simulations were equilibrated when the area per lipid had become stable, and this took a slightly different amount of time for each alcohol concentration (Table 1). The measurement of area per lipid is frequently used to monitor simulation equilibration because it is an experimentally accessible property and it reflects the state of a membrane. For example, an increase in the lateral pressure will result in a reduction in the lipid chain motion for a membrane in the liquid-crystalline state, and this decrease in lipid volume can be measured via the cross-sectional lipid area. The equilibration phase was followed by an additional 10 ns of simulations for data analysis. The center-of-mass motion of each leaflet was removed every time step during this phase.
TABLE 1.
Number of alcohol molecules and equilibration time for each concentration
| Number of alcohol molecules | Molar ratio of alcohol/lipid | (1) Alcohol concentration (M) | (2) Alcohol in the bulk solvent (mol %) | Equilibration time (ns) | |
|---|---|---|---|---|---|
| Ethanol | 59 | 0.5:1 | 0.85 | 1.9 | 51 |
| Ethanol | 280 | 2.2:1 | 3.40 | 10.6 | 60 |
| Propanol | 13 | 0.1:1 | 0.19 | 0.2 | 62 |
| Propanol | 95 | 0.7:1 | 1.30 | 1.8 | 62 |
| Butanol | 8 | 0.1:1 | 0.11 | 0 | 61 |
| Butanol | 39 | 0.3:1 | 0.55 | 0.9 | 63 |
The alcohol concentration definition represents (1) the moles of alcohol in the initial alcohol/water mixture and (2) the alcohol (mol %) in the bulk solvent. The bulk solvent for (2) was located 1 nm from the point ρsolvent = ρlipid.
The time step used for the ethanol and propanol simulations was 2 fs. Initially, the butanol simulations also had a time step of 2 fs. However, toward the end of the equilibration phase, the butanol simulations had to be restarted a few times because of overlapping atom contacts. Therefore, a time step of 1 fs was used for the remaining equilibration phase and the following data collection period.
The simulations were performed with the MD package GROMACS 3.2, and some data were evaluated using standard GROMACS tools (27,28). The simulations were coupled to a heat bath (T = 325 K) using a Berendsen thermostat (29) with a coupling time constant of 0.1 ps, and the system pressure was maintained at 1.0 bar anisotropically using a Berendsen barostat with a coupling constant of 0.2 ps. Bond lengths were constrained using the LINCS algorithm (30). The Lennard–Jones interaction cutoff was 1.0 nm with a switch function starting at 0.8 nm. The electrostatics were calculated using the PME method (31) with a short-range cutoff of 1.0 nm.
RESULTS AND DISCUSSION
Membrane fluidity
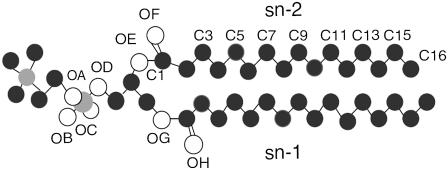
The main phase transition temperature for DPPC (Fig. 1) is 314 K, and because the simulations were maintained at 325 K, the bilayer was in the fluid phase. One way of examining how alcohols alter bilayer fluidity is through the area per lipid. Because the area per lipid is accessible through both simulations and experiments, it is possible to compare the two values. In simulations, the area per lipid is determined by dividing the x and y dimensions of a simulation cell by the number of lipids per leaflet.
FIGURE 1.
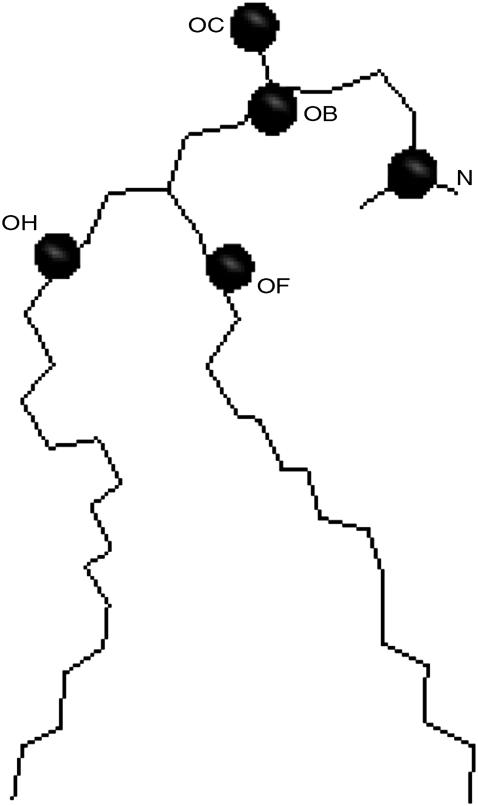
Structure of DPPC (hydrogen atoms are not included).
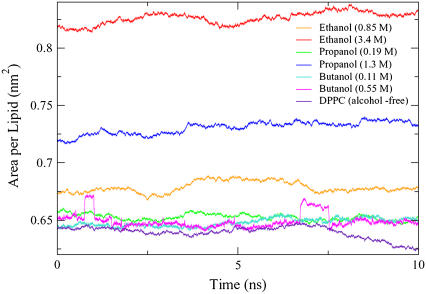
The average area per lipid for the control system (no alcohol molecules) during the 10-ns data collection period was 0.639 nm2. This simulated value is similar to previously determined values for DPPC, where an experimental measurement found an area per lipid of 0.629 ± 0.013 nm2 (32) and a simulation study reported a value of 0.630 nm2 (33). The fluctuations in the area per lipid for the simulations are shown in Fig. 2.
FIGURE 2.
The DPPC area per lipid for the control and six alcohol simulations during the data collection phase. The control, ethanol, and propanol simulations have a 2-fs time step, and the butanol simulations have a 1-fs time step.
Experimentally, Ly and Longo determined the area per lipid for vesicles composed of 1-stearoyl,2-oleoyl phosphatidylcholine (SOPC) that were in the presence of methanol, ethanol, propanol, and butanol solutions (34). They found that for an alcohol of a given chain length, the area per lipid increased as the alcohol concentration increased. A significant difference between these experimental results and the simulation results can be seen for the butanol systems in Table 1. In the simulations, the area per lipid increases with alcohol concentration in the ethanol and propanol systems but not the butanol simulations. The high-concentration butanol simulation also shows two distinct jumps in lipid area during the 10-ns time period, and we examine the membrane behavior in these elevated-lipid-area regions in the following sections.
Density profiles
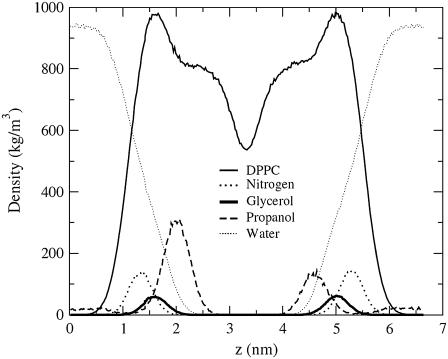
To determine how concentration and chain length influence alcohol placement relative to the bilayer interface, we examine the density profiles for each concentration. The density profile for the low-concentration propanol solution in Fig. 3 shows that the propanol peak is slightly below the glycerol group, and density profiles for the other concentrations (not shown) have alcohol peaks with similar placements relative to the DPPC glycerol group. These results are similar to those of another study, where Feller et al., using both spectroscopic and simulation methods, found that ethanol was typically located between the phosphate and the carbonyl groups (13).
FIGURE 3.
Density profiles for the low-concentration propanol solution for DPPC (solid line), the DPPC nitrogen atom (dotted line), the DPPC glycerol oxygen (heavy solid line), propanol (dashed line), and water (lightly dotted line). Density profiles have been centered at 3.3 nm.
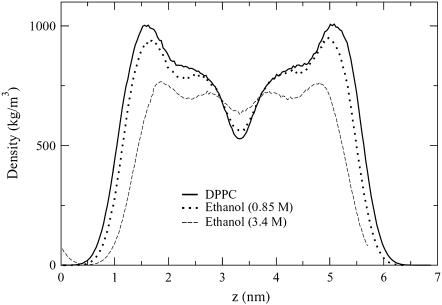
In comparing lipid density profiles for different alcohol concentrations, Fig. 4 shows that as the alcohol concentration increases, not only does the bilayer thickness decrease, but an additional lipid peak near the center of the bilayer appears. This new peak indicates that the lipid density near the center of the bilayer has increased, and this is the most pronounced for the high-concentration ethanol simulation. The location of the peak suggests that leaflet interdigitation occurs.
FIGURE 4.
Density profiles for DPPC in an alcohol-free environment and with two ethanol solutions. Density profiles have been centered at 3.3 nm.
Interdigitation occurs when lipid chains from one bilayer leaflet are found in a region of space normally occupied only by lipid chains from the opposite leaflet. One effect of interdigitation is a decrease in bilayer thickness. Interdigitation has been examined both experimentally (35) and via simulations (17–20). Using Dissipative Particle Dynamics (DPD), Kranenburg and colleagues found that for a tensionless bilayer, the interdigitated phase is a function of the alcohol chain length, where long-chain alcohols require a higher alcohol concentration to stabilize the interdigitated phase than short-chain alcohols (18,19). It would be interesting to compare interdigitation results between the atomistic and mesoscale simulations. However, our simulations sample the NPT ensemble rather than the NγT ensemble. Detailed results on the differences between NγT and NPT atomistic simulations will be published elsewhere (A. N. Dickey and R. Faller, in preparation). Preliminary results indicate that the low-concentration ethanol simulation shows a slight decrease in the area per lipid (3%) in the NγT ensemble, whereas the decrease in the area per lipid in the high-concentration ethanol simulation is significantly larger (10%).
Alcohol and lipid hydrogen bonding
Even though the propanol density profile indicates that the most common location for propanol molecules is slightly below the lipid glycerol group, MD allows one to take a closer look at the lipid/alcohol hydrogen bonds and to examine the relation between hydrogen bond location and lifetime. In this article, the alcohol hydroxyl hydrogen atoms serve as the hydrogen bond donors, and the DPPC oxygen atoms are the hydrogen bond acceptors. The criteria that we use for hydrogen bond existence are that the distance between the hydrogen atom and the hydrogen bond acceptor be <3.5 Å and the angle between the hydrogen atom, hydrogen bond donor, and hydrogen bond acceptor be <30° (27, 28). In DPPC, there are eight oxygen atoms that can serve as hydrogen bond acceptors (Fig. 1).
Four oxygen atoms are bound to the phosphate atoms (OA–OD), two atoms are located in the glycerol group (OE, OG), and two carbonyl oxygen atoms are slightly below the glycerol group (OF, OH). A DPPC lipid may also serve as a hydrogen bond donor by lending a hydrogen atom from one of the CHn groups to the hydroxyl oxygen in the alcohol molecule. However, hydrogen bonds of this type are considerably weaker than the hydrogen bonds that form between the alcohol molecule hydrogen atoms and the DPPC oxygen atoms (36,37), and thus we do not include hydrogen bonds of this type in our study.
We calculated the hydrogen bonding structural relaxation over 5 ns by integrating the time correlation function
 |
(1) |
as defined by Luzar and Chandler where A(t) is equal to 1 if a hydrogen bond between a pair of atoms at time t exists and is 0 if a bond does not exist (38). Even if a bond does not exist continuously between time 0 and time t, the bond will still be included in the correlation function for the time periods where the bond does exist. The trajectories were analyzed every 10 ps, and the correlation function was integrated in two parts. The correlation curves showed that the hydrogen-bonding relaxation had fast and slow components. The fast relaxation segment was integrated numerically, and the slow relaxation segment was integrated by fitting a first-order exponential to the remaining data.
Table 2 shows that the hydrogen-bonding structural relaxation times are the longest for the hydrogen bonds that form between the alcohol molecules and the DPPC acceptor sites OB and OF in the ethanol and propanol simulations and OB, OC, and OF in the low-concentration butanol simulation. It is not surprising that OA, OD, OE, and OG have shorter relaxation times in comparison because these acceptors are slightly more hindered and less accessible for hydrogen bonding than OB, OC, OF, and OH. The high-concentration ethanol solution has the shortest average hydrogen-bonding relaxation time, and this trend fits with the high membrane fluidity that is seen at this concentration. As indicated by the short relaxation times, the ethanol molecules will be quite mobile at this concentration. Using NMR, Holte and Gawrisch (39) found ethanol-lipid lifetimes to be slightly longer than 0.5 ns, and in a simulation study, Patra et al. (3) found ethanol-lipid lifetimes to be 1.2 ns. The values in Table 2 are smaller than these. One factor that may result in this difference is that we calculate the hydrogen bond lifetimes between ethanol molecules and specific lipid acceptors rather than between ethanol molecules and the entire lipid.
TABLE 2.
The hydrogen-bonding structural relaxation times (ps) for each lipid acceptor
| Bond acceptor | E (0.85 M) | E (3.4 M) | P (0.19 M) | P (1.3 M) | B (0.11 M) | B (0.55 M) |
|---|---|---|---|---|---|---|
| OA | 31 | 27 | 39 | 39 | 11 | 139 |
| OB | 246 | 97 | 323 | 366 | 211 | 277 |
| OC | 106 | 65 | 154 | 103 | 271 | 516 |
| OD | 42 | 29 | 65 | 49 | 29 | 312 |
| OE | 54 | 59 | 115 | 83 | 89 | 450 |
| OF | 239 | 197 | 352 | 212 | 345 | 482 |
| OG | 10 | 14 | 9 | 12 | 10 | 417 |
| OH | 70 | 57 | 42 | 54 | 46 | 122 |
| Average | 100 | 68 | 137 | 115 | 127 | 339 |
To calculate the data-fitting error, we fit a first-order exponential to a new data set. This set includes the data points used in fitting the original exponential plus additional data points so that for each bonding location, the data set is 30% larger than the original set. The difference in the above-reported relaxation time and the relaxation time from the larger data set is the error. The largest error is 12.1% and is from the low-concentration propanol simulation, OD acceptor.
The relaxation time distribution for the high-concentration butanol simulation was quite different from those seen in the other alcohol concentrations, and the correlation time average was also significantly longer. This and other unusual behavior seen in the high-concentration butanol simulation are discussed in a later section.
To examine why the hydrogen bonds that include acceptors OB and OF have especially long relaxation times, we calculate the radial distribution function (rdf) between the alcohol hydroxyl oxygen atoms and the eight lipid acceptors in the ethanol, propanol, and low butanol concentrations. The resulting figure shows the relative probability of finding these atoms a distance r apart. Table 3 summarizes the rdf results, and it shows that the largest rdf peaks for OB, OC, OF, and OH are all located at 0.20 ± 0.01 nm, whereas the locations of the largest peaks for OA, OD, OE, and OG have higher values, indicating that the alcohol molecules do not approach these acceptors as closely. The height of the rdf peak for OF is also larger than that of the other acceptors.
TABLE 3.
Average values for the largest rdf peaks for the ethanol, propanol, and low butanol concentration acceptors
| Hydrogen bond acceptor | Most probable distance between alcohol and acceptor (nm) | Peak height |
|---|---|---|
| OA | 0.65 | 2.2 |
| OB | 0.20 | 8.9 |
| OC | 0.20 | 6.2 |
| OD | 0.51 | 2.6 |
| OE | 0.38 | 5.9 |
| OF | 0.20 | 31.6 |
| OG | 0.43 | 3.5 |
| OH | 0.21 | 8.9 |
The locations of the rdf peaks for OA, OD, OE, and OG are significantly larger than those for OB, OC, OF, and OH.
One interesting trend seen in Table 2 is that the hydrogen bonds that form at OB and OF typically have longer relaxation times than the hydrogen bonds that form at OC and OH, even though OC and OH are not sterically hindered as are OA, OD, OE, and OG. Table 3 also shows that the height of the largest rdf peak for OF is more than three times greater than the height of the OH peak. Both OB and OC are bound to the lipid head group phosphate atom, and both OF and OH are carbonyl oxygen atoms. One difference between OF and OH is that OF is located on the lipid sn-2 chain and OH is on the sn-1 chain. Because the sn-2 chain is on average closer to the membrane surface than the sn-1 chain, the positions of the two carbonyl oxygens are not identical. In one simulation study, it was found that because of DPPC asymmetry, the sn-1 and sn-2 carbonyl oxygen atoms have slightly different hydration numbers (2).
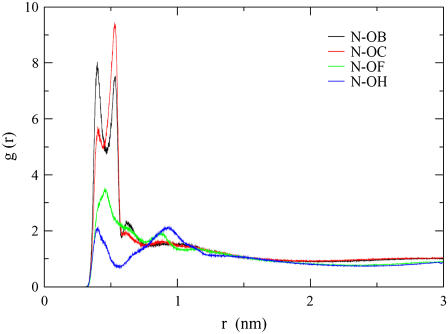
To examine how the location of OB, OC, OF, and OH differ with respect to the lipid head group, we calculate the rdf between the nitrogen (N) atom in the lipid choline group and these acceptors. We find that the first two OB peaks are of equal height and have distances of 0.40 nm and 0.53 nm (Fig. 5). For OC, however, the second peak, located at 0.53 nm, is larger than the first peak. This indicates that the N and OB spend equal amounts of time 0.40 nm and 0.53 nm apart, whereas it is more probable to find N and OC 0.53 nm apart. Similarly, because the first OF peak is larger than the first OH peak, it is more likely that the N is closer to OF than to OH.
FIGURE 5.
The first nitrogen (N)-OB rdf peak height is larger than that of N-OC. Likewise, the first N-OF rdf peak height is greater than that of N-OH. The rdf values in this figure are averaged over the ethanol, propanol, and low-butanol-concentration simulations (these five concentrations show the same trends when examined individually).
We calculated the P-N vector angle in the lipid head group for the control simulation (no alcohol molecules) and found that it had an average tilt of 85.5° with respect to the bilayer normal. This result is similar to that which was found in a separate DPPC simulation study, where the P-N vector had a value of 78° (40). Therefore, the P-N vector of the DPPC head group lies almost parallel to the membrane surface. This, in combination with the rdfs, suggests that the lipid head group conformation partially encloses OB and OF, forming a “quasipocket” (Fig. 6). This conformation would increase the structural relaxation time of an alcohol molecule that enters this region.
FIGURE 6.
An example of a DPPC lipid whose head group conformation partially encloses hydrogen bond acceptors OB and OF.
Alcohol hydrogen-bonding location
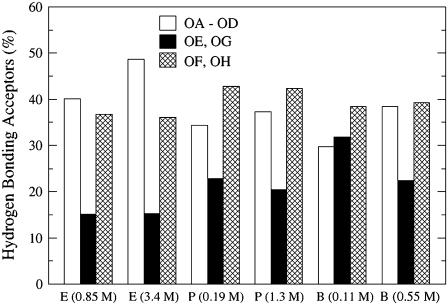
Fig. 7 shows that in all of the simulations except that of the low-concentration butanol, the alcohol molecules form a smaller number of hydrogen bonds with the glycerol oxygen atoms (OE, OG) than with the phosphate oxygen atoms (OA–OD) and the carbonyl oxygen atoms (OF, OH). This result suggests that the glycerol oxygen atoms are more hindered than the phosphate and carbonyl oxygen atoms. In both ethanol simulations, the ethanol molecules form more hydrogen bonds with the phosphate oxygen atoms than with the carbonyl oxygen atoms. In examining the average interaction energy between ethanol molecules and hydrogen bond acceptors in 1-palmitoyl-2-oleoyl-sn-glycero-3-phosphocholine (POPC), Feller et al. found that the attraction between the phosphate groups and the ethanol molecules was stronger than the attraction between the ethanol molecules and the glycerol acceptors (13). Using NMR with two-dimensional NOESY, Holte and Gawrisch found that the strongest lipid-ethanol crosspeaks were located at the glycerol and upper chain segments for both 0.1 and 1.0 ethanol:lipid (mol:mol) ratios (39). The propanol and butanol molecules form the largest number of hydrogen bonds with the carbonyl acceptor oxygen atoms, and the increase in hydrogen bonds at this location is most likely the result of an increase in van der Waals attractions between the alcohol alkyl chains and the lipid chains. A similar trend was seen in a coarse-grained theoretical study, where Frischknecht and Frink found that as the alcohol chain length increased, the alcohol molecules had a higher probability of moving farther into the hydrophobic region (17).
FIGURE 7.
Number of hydrogen bonds (%) that form at the phosphate oxygen acceptors (OA–OD), the glycerol oxygen acceptors (OE, OG), and the upper chain carbonyl oxygen acceptors (OF, OH). On the x axis, the alcohol concentrations are labeled as E for the ethanol solutions, P for the propanol solutions, and B for the butanol solutions.
Even though the ethanol and propanol hydrogen-bonding location didn't vary significantly with concentration, the hydrogen-bonding location did vary with butanol concentration. In the low-concentration butanol simulation, the likelihood of hydrogen bonding occurring at the phosphate, glycerol, and carbonyl oxygen atoms increased as the acceptors' environment increased in hydrophobicity. However, in the high-concentration butanol simulation, the number of hydrogen bonds that formed at the phosphate group was equal to the number of hydrogen bonds that formed at the carbonyl group. This result was surprising because the mole percentage of butanol molecules remaining in the solvent was quite low (Table 1).
Lipid head group and chain behavior
In studying membrane fluidity, it is interesting to examine how different segments of the lipid, specifically the head group and hydrocarbon chains, differ in their interactions with alcohol molecules. As seen earlier, the area per lipid increases with concentration in the ethanol and propanol simulations, and therefore, the rotational freedom of the lipid head groups will also likely increase with concentration in these systems. We calculated the rotational correlation function of the lipid head group using a vector that spanned from the phosphorus (P) atom to the N atom. The rotational correlation function is calculated using the autocorrelation function for the P-N vector (V)
 |
(2) |
where the rotational relaxation time (τ) is calculated from the integral of the autocorrelation function.
 |
(3) |
The integral is evaluated over 5 ns, where numerical integration is used for the fast relaxation component of the correlation curve and a first-order exponential is fit to the remaining data points.
Table 4 shows that the DPPC lipid head groups have an increased rotational freedom as the alcohol concentration increases in the ethanol and propanol simulations. A recent simulation study by Chanda et al. found that ethanol molecules can form hydrogen bonds with the lipid phosphate oxygen atoms that have comparable strength to the hydrogen bonds that form between the lipid phosphate oxygen atoms and water molecules. Because ethanol molecules can replace water molecules at the phosphate oxygen sites, the water hydration shell is no longer as rigid, allowing the phosphate-water structural relaxation times to decrease (14). For the butanol simulations, the rotational relaxation time actually increases with butanol concentration. This coincides with the hydrogen bonding relaxation times in Table 2, where the high-concentration butanol hydrogen bonds generally have longer relaxation times at the lipid phosphate and glycerol oxygen atoms than the other alcohol concentrations.
TABLE 4.
Rotational relaxation time of the DPPC P-N vector averaged over all lipids for each alcohol concentration
| Alcohol concentration (M) | Rotational relaxation time (ps) |
|---|---|
| Control (0.0) | 2229 |
| Ethanol (0.85) | 2183 |
| Ethanol (3.40) | 1337 |
| Propanol (0.19) | 2205 |
| Propanol (1.30) | 1626 |
| Butanol (0.11) | 2351 |
| Butanol (0.55) | 4550 |
The largest error is 3% and is from the high-concentration propanol simulation. The method used to calculate the error is described in the footnote of Table 2.
To examine the hydrophobic interactions between the alcohol molecules and the lipid acyl chains, we calculate the chain order parameters. In simulations, the order parameter is a useful measurement because it can be compared with the experimental deuterium order parameter, which can be determined through nuclear magnetic resonance spectroscopy measurements. Because the hydrocarbon chain structures are based on the united atom model, hydrogen atoms are not explicitly represented, and the C-H bonds are reconstructed assuming tetrahedral geometry of the CH2 groups. The order parameter is defined as
 |
(4) |
where θCD is the angle between the CD-bond and the bilayer normal; in experiments and in simulations the CD-bond is replaced by the CH-bond.
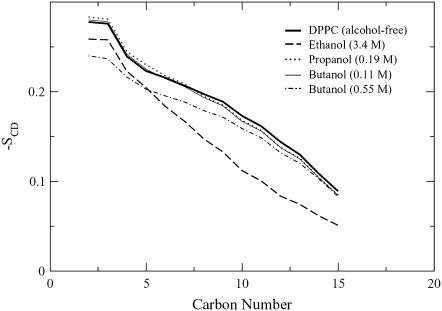
The order parameters are defined for carbon atoms Cn–1 through Cn+1, and thus for DPPC, order parameters are calculated for atoms C2 through C15. Fig. 8 shows that the high-concentration ethanol simulation has the smallest sn-2 chain order for carbons 5–15 and the low-concentration propanol and butanol simulations have the highest chain order.
FIGURE 8.
Order parameter profiles for the DPPC sn-2 chains.
The high order seen in both the low-propanol and butanol simulation sn-2 chains corresponds to the hydrogen-bonding relaxation times in Table 2. The low propanol and butanol concentration simulations have especially long relaxation times at the OF acceptor, which indicates that the bonding between these alcohol molecules and the lipid upper chain region is particularly favorable. It is not particularly surprising that the high ethanol concentration lipid chains show low order as seen in Fig. 8 because the alcohol concentration and area per lipid in this simulation were significantly higher than the other concentrations. However, it is surprising that the high butanol concentration has a lower-order parameter for the first five carbon atoms than the high-ethanol-concentration simulation. This seems to contradict the previously examined properties, where one might expect that the slow head group rotational relaxation rate and large alcohol/lipid hydrogen-bonding relaxation time would result in highly ordered lipid chains.
Alcohol crossings
Because one of the most important functions of the membrane is to prevent small molecules from diffusing into the intracellular region, we examined how bilayer permeation varied with alcohol chain length and concentration by counting the number of alcohol molecules that crossed the bilayer. An alcohol molecule was considered to have traversed the bilayer if it moved from the bottom leaflet to the top leaflet, or vice versa, by crossing through the center of the bilayer, which has the smallest bilayer lipid density. Therefore, we do not consider an alcohol molecule that moves to the opposite leaflet via the water phase as having crossed the bilayer. Also, we did not count any molecules if they passed through the center and moved <0.25 nm in the new leaflet before returning to the original leaflet. The crossing rate was the largest for the high-concentration ethanol and butanol simulations (Table 5).
TABLE 5.
The number of alcohol molecules that cross the bilayer, where the trajectories are 10 ns
| Alcohol concentration | Number of alcohol molecules that cross the bilayer |
|---|---|
| Ethanol (0.85 M) | 2 |
| Ethanol (3.4 M) | 46 |
| Propanol (0.19 M) | — |
| Propanol (1.3 M) | 1 |
| Butanol (0.11 M) | 3 |
| Butanol (0.55 M) | 16 |
No alcohol crossings are seen for the low-concentration propanol simulation.
A simulation performed by Patra et al. examined the interactions between an ethanol solution and a DPPC bilayer (molar ratio of 0.7:1 ethanol/lipid), and they found that 30 ethanol molecules cross the bilayer in a 40-ns trajectory (3). The fluidity of their control bilayer was slightly larger than that of ours (different force fields were used for the lipid chains), where the area per lipid in their alcohol-free system was 0.655 ± 0.002 nm2 and ours was 0.639 nm2. However, a comparison between the two studies can still be made if we multiply our ethanol results by a factor of 4 to mimic a 40-ns time span. In this case, we find that 8 ethanol molecules cross the bilayer in the low-concentration ethanol simulation (molar ratio of 0.5:1 ethanol/lipid) and 184 molcules cross the bilayer in the high-concentration ethanol simulation (molar ratio of 2.2:1 ethanol/lipid) in qualitative agreement with Patra's data.
Lipid Diffusion
Lipid mobility can be examined through the lateral diffusion coefficient, which is calculated from the slope of the mean-square displacement via the Einstein equation,
 |
(5) |
where d is the dimensionality of the system (d = 2 for lateral diffusion) and r(t) and r(0) are coordinates of the lipid molecules at time t and time 0. One experimental measurement found the diffusion coefficient for DPPC to be 0.095 × 10⁻⁶ cm2/s at 323 K (41). Lindahl et al. performed a 100-ns simulation and found that DPPC at 323 K has a diffusion coefficient of 0.12 × 10⁻⁶ cm2/s (27). We used linear regression to calculate the lateral diffusion coefficient and found a DPPC diffusion coefficient of 0.28 × 10⁻⁶ cm2/s in the control system. The DPPC diffusion coefficient values for the alcohol systems are shown in Table 6.
TABLE 6.
DPPC diffusion coefficient calculated from the lateral mean-square displacement
| Alcohol concentration (M) | Lateral diffusion coefficient (× 10−6 cm2/s) |
|---|---|
| Control (0.0) | 0.28 (0.08) |
| Ethanol (0.85) | 0.27 (0.04) |
| Ethanol (3.4) | 0.29 (0.02) |
| Propanol (0.19) | 0.30 (0.04) |
| Propanol (1.30) | 0.21 (0.09) |
| Butanol (0.11) | 0.27 (0.07) |
| Butanol (0.55) | 0.42 (0.11) |
Table 6 shows that there is only a slight increase in the lipid diffusion coefficient as the ethanol concentration increases. The diffusion coefficient decreases with an increase in alcohol concentration in the propanol simulations and increases with alcohol concentration in the butanol simulations.
Bilayer phase transition and lipid flip–flop
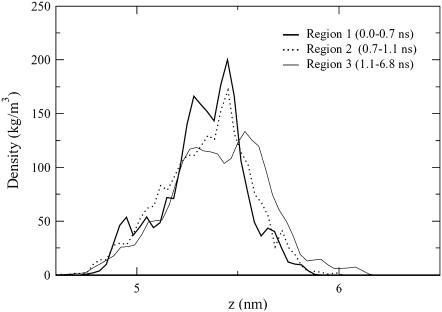
The high-concentration butanol simulation had a larger head group rotational relaxation time than did the control, whereas its sn-2 order parameter for the first five carbon atoms was significantly lower than that of the other alcohol concentrations. This result initially seems contradictory. However, after analyzing the trajectory segments that correspond to the two elevated-area-per-lipid regions, it appears that the butanol molecules induce a phase change in the bilayer. Two distinct jumps were seen in the high-concentration butanol area per lipid, and to examine their influence on the membrane behavior, we examined the high-area and low-area trajectory segments separately. The 10-ns trajectory is split into five regions for analysis, and the divisions are based on the area per lipid: Region 1 (0–0.7 ns), Region 2 (0.7–1.1 ns), Region 3 (1.1–6.8 ns), Region 4 (6.8–7.5 ns), and Region 5 (7.5–10 ns).
Fig. 9 shows the phosphorus atom density profiles for one leaflet for the first high-area region (Region 2) and the two low-area regions that surround the jump (Region 1 and Region 3). It can be seen that for the two low-area regions, there are two peaks that compete for the maximum density, whereas only a single peak appears in the high-area region. A single peak was seen previously in the low-concentration propanol simulation in Fig. 3 and is characteristic for a DPPC membrane in the liquid crystalline phase. The double peaks indicate that in the low-area regions, the DPPC phosphorus atoms have separated into two planes. Thus, the low order parameter values seen for carbons 2 through 5 in Fig. 8 for the high-concentration butanol simulation are a result of the chains not being aligned. The double-peak density profile also fits with the long hydrogen bonding relaxation times in Table 2, where a butanol molecule could simultaneously be close to the phosphate oxygen atoms in one plane and the glycerol oxygen atoms in the second plane.
FIGURE 9.
DPPC phosphorus atom density profile for one leaflet. The bilayer is centered at 3.3 nm.
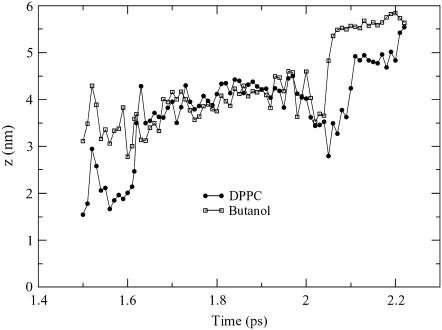
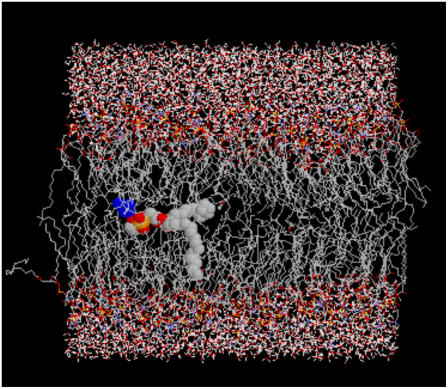
Another oddity seen in the high-concentration butanol simulation was an occurrence of lipid flip–flop. In a cellular membrane, it is rare for a lipid to spontaneously flip to the opposite leaflet on a short time scale, and therefore, a membrane-bound translocator, such as a scramblase or flippase, is used to transport lipids between leaflets. Lipid flip–flop has recently been discussed in two atomistic simulation studies. Kandasamy and Larson observed lipid flip–flop in a POPC system that contained cations and anions and suggest that the lipid flipping is tied to the movement of a cation that crosses the bilayer (42). In a second study, Tieleman and Marrink calculated the energy of pore formation in a membrane when a lipid was moved into the bilayer center, and their findings support the idea that defects play a role in lipid flip–flop (43). The lipid flip–flop event seen in the butanol simulation seems to have occurred through a combination of a membrane defect, as described by Tieleman and Marrink, and favorable interactions with another molecule, as found by Kandasamy and Larson. Fig. 10 shows the trajectory of the lipid crossing the bilayer. From 1.6 to 2.0 ns, the lipid trajectory is very similar to that of one of the butanol molecules, whose trajectory is also shown in Fig. 10. During this time frame, both the lipid and the butanol molecule are located in the center of the bilayer (3.3 nm). However, the lipid and butanol trajectories are not overly similar during the time period of 1.5–1.6 ns, which is when the lipid moves from the bottom leaflet to the bilayer center. Directly before the lipid leaves the bottom leaflet, a butanol molecule that is located next to the lipid crosses from the bottom leaflet to the top leaflet. Hence, it is possible that in the absence of this butanol molecule, a gap forms near the lipid that enables it to shift from the interface to the bilayer center. Fig. 11 shows the lipid and corresponding butanol molecule in the center of the bilayer, where t = 2 ns.
FIGURE 10.
The z-axis coordinates of the lipid that flip–flops as it traverses the bilayer. The lipid is closely aligned with a butanol molecule when it is located in the center of the bilayer (3.3 nm).
FIGURE 11.
A snapshot of the lipid in transit from the bottom leaflet to the top leaflet. While located in the center of the bilayer, the lipid partners with a butanol molecule (blue molecule).
CONCLUSION
We examine how alcohol concentration and chain length influence the behavior of a DPPC lipid bilayer. To investigate the importance of alcohol concentration, we examine how the lipid area changes in response to the addition of ethanol, propanol, and butanol solutions. We find that as the ethanol and propanol concentrations increase, the area per lipid increases. The opposite trend is seen for butanol, where an increase in concentration results in an area-per-lipid decrease. The high butanol concentration simulation also shows two distinct jumps in lipid area during the 10-ns time period. The distribution in the alcohol/lipid hydrogen-bonding location did not vary with concentration in the ethanol and propanol simulations; however, it did differ in the butanol simulations. The butanol molecules in the low-concentration butanol simulation form the largest number of hydrogen bonds at the carbonyl oxygen atoms, which is reasonable because butanol has limited solubility in water and has favorable interactions with the DPPC upper-chain region. However, the butanol molecules in the high-concentration butanol simulation form an equal number of hydrogen bonds at the phosphate and carbonyl acceptors, which is unexpected because very few butanol molecules remain in the bulk solvent.
Even though the alcohol concentration did not have a large impact on the distribution of the alcohol/lipid hydrogen-bonding location in the ethanol and propanol simulations, the length of the alcohol acyl chains did have an effect. For both ethanol concentrations, a larger number of alcohol/lipid hydrogen bonds form at the phosphate acceptor sites than at the carbonyl or glycerol sites. For both propanol concentrations, the largest number of hydrogen bonds form at the carbonyl sites. Similarly, the butanol molecules in the low-concentration butanol simulation form the largest number of hydrogen bonds at the carbonyl acceptors. This increase in hydrogen bond formation at the carbonyl sites in the propanol simulations and the low-concentration butanol simulation could be the result of an increase in van der Waals interaction strength between the alcohol acyl chains and the lipid chains.
DPPC has eight lipid oxygen atoms that can serve as hydrogen bond acceptors, and we observe that there are two particularly favorable acceptor sites for the alcohol molecules in the ethanol and propanol simulations, where one is a phosphate oxygen and the second is a carbonyl oxygen. These two sites form hydrogen bonds with alcohol molecules that have lifetimes that are generally much longer than the hydrogen bonds that form at the other six acceptor sites. The low-concentration butanol simulation shows less favor for the phosphate oxygen mentioned above; however, it does show a similar preference for the carbonyl oxygen. After examining the radial distribution functions between the acceptors and the lipid head group nitrogen atom, it appears that the lipid head groups tilt such that a region between the head group and the sn-2 lipid chain partially enclose the two favored acceptor sites, resulting in an increase in the hydrogen bond lifetimes at these locations.
The lipid head group rotational relaxation time decreases with an increase in ethanol and propanol concentration but increases with butanol concentration. The high-concentration butanol simulation also has a significantly longer average hydrogen-bonding relaxation time than the other systems, particularly at the glycerol group acceptors. Because of the unusual lipid behavior in the high-concentration butanol simulation, we analyze the high-area and low-area trajectory segments from this simulation separately, where two distinct jumps are seen in the high-concentration butanol area per lipid. The phosphate density profile shows two distinct phase regimes during the 10-ns trajectory, where in the low-area regions, the DPPC phosphorus atoms separate into two planes. The fluctuation in area per lipid between the high—area region, which has a single peak in the DPPC phosphorus density profile, and the low—area region, which has two phosphorus planes per leaflet, suggests that the system may be near a phase transition. Induction of a membrane phase change via a small molecule has been seen before for the disaccharide sugar trehalose (44), which is able to preserve membranes in the dehydrated state. Another surprising event in the high-concentration butanol simulation was an occurrence of lipid flip-flop. This appears to have occurred through two mechanisms, where, in the first stage, a gap forms near the lipid when a neighboring butanol molecule crossed to the other leaflet. This defect enabled the lipid to move to the center of the bilayer, where it spent nearly 0.4 ns shadowing a butanol molecule before making its final jump to the opposite leaflet.
Acknowledgments
We thank Professor Marjorie Longo and Dr. Hung Ly for inspiring work in this area and Professor Mikko Karttunen for insightful discussions. A.N.D. also thanks L. C. Dickey for many fruitful conversations on this topic.
This work was supported by NIH–NIGMS through Grant Number T32-GM08799.
References
- 1.Glinski, J., G. Chavepeyer, J. Platten, and P. Smet. 1998. Surface properties of diluted aqueous solutions of normal short-chained alcohols. J. Chem. Phys. 109:5050–5053. [Google Scholar]
- 2.Sum, A., R. Faller, and J. de Pablo. 2003. Molecular simulation study of phospholipid bilayers and insights of the interactions with disaccharides. Biophys. J. 85:2830–2844. [DOI] [PMC free article] [PubMed] [Google Scholar]
- 3.Patra, M., E. Salonen, E. Terama, I. Vattulainen, R. Faller, B. Lee, J. Holopainen, and M. Karttunen. 2006. Under the influence of alcohol: The effect of ethanol and methanol on lipid bilayers. Biophys. J. 90:1121–1135. [DOI] [PMC free article] [PubMed] [Google Scholar]
- 4.Franks, N., and W. Lieb. 1982. Molecular mechanisms of general anesthesia. Nature. 300:487–493. [DOI] [PubMed] [Google Scholar]
- 5.Koubi, L., M. Tarek, S. Bandyopadhyay, M. Klein, and D. Scharf. 2001. Membrane structural perturbations caused by anesthetics and nonimmobilizers: A molecular dynamics investigation. Biophys. J. 81:3339–3345. [DOI] [PMC free article] [PubMed] [Google Scholar]
- 6.Tu, K., M. Tarek, M. Klein, and D. Scharf. 1998. Effects of anesthetics on the strucutre of a phospholipid bilayer: molecular dynamics investigation of halothane in the hydrated liquid crystal phase of dipalmitoylphosphatidylcholine. Biophys. J. 75:2123–2134. [DOI] [PMC free article] [PubMed] [Google Scholar]
- 7.Tang, P., and Y. Xu. 2002. Large-scale molecular dynamics simulations of general anesthetic effects on the ion channel in the fully hydrated membrane: The implication of molecular mechanisms of general anesthesia. Proc. Natl. Acad. Sci. USA. 99:16035–16040. [DOI] [PMC free article] [PubMed] [Google Scholar]
- 8.Cantor, R. 2001. The lateral pressure profile in membranes: A physical mechanism of general anesthesia. Biochemistry. 36:2339–2344. [DOI] [PubMed] [Google Scholar]
- 9.Cantor, R. 2001. Breaking the Meyer-Overton rule: Predicted effects of varying stiffness and interfacial activity on the intrinsic potency of anesthetics. Biophys. J. 80:2284–2297. [DOI] [PMC free article] [PubMed] [Google Scholar]
- 10.Campagna, J. A., K. W. Miller, and S. A. Forman. 2003. Mechanisms of actions of inhaled anesthetics. N. Engl. J. Med. 348:2110–2124. [DOI] [PubMed] [Google Scholar]
- 11.Meyer, H. 1899. Zur theorie der alkoholnarkose. Arch. Exp. Pathol. Pharmakol. 42:109–118. [Google Scholar]
- 12.Overton, E. 1901. Studien uber die Narkose Zugleich ein Beitrag zur Allgemeinen Pharmakologie. Verlag von Gustav Fisher, Jena, Germany.
- 13.Feller, S., C. Brown, D. Nizza, and K. Gawrisch. 2002. Nuclear Overhauser enhancement spectroscopy cross-relaxation rates and ethanol distribution across membranes. Biophys. J. 82:1396–1404. [DOI] [PMC free article] [PubMed] [Google Scholar]
- 14.Chanda, J., S. Chakraborty, and S. Bandyopadhyay. 2006. Sensitivity of hydrogen bond lifetime dynamics to the presence of ethanol at the interface of a phospholipid bilayer. J. Phys. Chem. B. 110:3791–3797. [DOI] [PubMed] [Google Scholar]
- 15.Chanda, J., and S. Bandyopadhyay. 2006. Perturbation of phospholipid bilayer properties by ethanol at a high concentration. Langmuir. 22:3775–3781. [DOI] [PubMed] [Google Scholar]
- 16.Lee, B., R. Faller, A. K. Sum, I. Vattulainen, M. Patra, and M. Karttunen. 2004. Structural effects of small molecules on phospholipid bilayers investigated by molecular simulations. Fluid Phase Equil. 225:63–68. [Google Scholar]
- 17.Frischknecht, A., and L. Frink. 2006. Alcohols reduce lateral membrane pressures: Predictions from molecular theory. Biophys. J. 91:4081–4090. [DOI] [PMC free article] [PubMed] [Google Scholar]
- 18.Kranenburg, M., M. Vlaar, and B. Smit. 2004. Simulating induced interdigitation in membranes. Biophys. J. 87:1596–1605. [DOI] [PMC free article] [PubMed] [Google Scholar]
- 19.Kranenburg, M., and B. Smit. 2004. Simulating the effect of alcohol on the structure of a membrane. FEBS. 568:15–18. [DOI] [PubMed] [Google Scholar]
- 20.Dickey, A. N., and R. Faller. 2005. Investigating interactions of biomembranes and alcohols: A multiscale approach. J. Polym. Sci. [B]. 43:1025–1032. [Google Scholar]
- 21.Tieleman, D. 2002. University of Calgary, Department of Biological Sciences. http://moose.bio.ucalgary.ca/download.html.
- 22.van Gunsteren, W., P. Kruger, S. Billeter, A. Mark, A. Eising, W. Scott, P. Hünenberger, and I. Tironi. 1996. Biomolecular Simulation: The GROMOS 96 Manual and User Guide. VdF, Zurich, Switzerland.
- 23.Nath, S., F. Escobedo, and J. de Pablo. 1998. On the simulation of vapor-liquid equilibria for alkanes. J. Chem. Phys. 108:9905–9911. [Google Scholar]
- 24.Nath, S., and J. de Pablo. 2000. Simulation of vapour-liquid equilibria for branched alkanes. Mol. Phys. 98:231–238. [Google Scholar]
- 25.Nath, S., B. Banaszak, and J. de Pablo. 2001. A new united atom force field for alpha-olefins. J. Chem. Phys. 114:3612–3636. [Google Scholar]
- 26.Berendsen, H., J. Postma, W. van Gunsteren, and J. Hermans. 1981. Interaction models for water in relation to protein hydration. In Intermolecular Forces. B. Pullman, editor. D. Reidel Publishing Company, Dordrect, The Netherlands.
- 27.Lindahl, E., B. Hess, and D. van der Spoel. 2001. Gromacs 3.0: A package for molecular simulation and trajectory analysis. J. Mol. Mod. 7:306–317. [Google Scholar]
- 28.Berendsen, H., D. van der Spoel, and R. van Drunen. 1995. Gromacs: A message-passing parallel molecular dynamics implementation. Comp. Phys. Comm. 91:43–56. [Google Scholar]
- 29.Berendsen, H., J. Postma, W. van Gunsteren, A. DiNola, and J. Haak. 1984. Molecular dynamics with coupling to an external bath. J. Chem. Phys. 81:3684–3690. [Google Scholar]
- 30.Hess, B., H. Bekker, H. Berendsen, and J. Fraaije. 1997. Lincs: A linear constraint solver for molecular simulations. J. Comp. Chem. 18:1463–1472. [Google Scholar]
- 31.Essman, U., L. Perela, M. Berkowitz, H. Darden, and L. Pedersen. 1995. A smooth particle mesh Ewald method. J. Chem. Phys. 103:8577–8592. [Google Scholar]
- 32.Nagle, J., R. Zhang, S. Tristram-Nagle, W. Sun, H. Petrache, and R. Suter. 1996. X-ray structure determination of fully hydrated l-alpha phase dipalmitoylphosphatidylcholine bilayers. Biophys. J. 70:1419–1431. [DOI] [PMC free article] [PubMed] [Google Scholar]
- 33.Tieleman, D., and H. Berendsen. 1996. Molecular dynamics simulations of a fully hydrated dipalmitoylphosphatidylcholine bilayer with different macroscopic boundary conditions and parameters. J. Chem. Phys. 105:4871–4880. [Google Scholar]
- 34.Ly, H., and M. Longo. 2004. The influence of short-chain alcohols on interfacial tension, mechanical properties, area/molecule, and permeability of fluid lipid bilayers. Biophys. J. 87:1013–1033. [DOI] [PMC free article] [PubMed] [Google Scholar]
- 35.Rowe, E., and T. Cutrera. 1990. Differential scanning calorimetric studies of ethanol interactions with distearoylphosphatidylcholine: transition to the interdigitated phase. Biochemistry. 29:10398–10404. [DOI] [PubMed] [Google Scholar]
- 36.Gu, Y., T. Kar, and S. Scheiner. 1999. Fundamental properties of the CH-O interaction: Is it a true hydrogen bond? J. Am. Chem. Soc. 121:9411–9422. [Google Scholar]
- 37.Pandit, S., D. Bostick, and M. Berkowitz. 2003. Mixed bilayer containing dipalmitoylphosphatidylcholine and dipalmitoylphosphatidylserine: Lipid complexation, ion binding, and electrostatics. Biophys. J. 85:3120–3131. [DOI] [PMC free article] [PubMed] [Google Scholar]
- 38.Luzar, A., and D. Chandler. 1996. Hydrogen-bond kinetics in liquid water. Nature. 379:55–57. [DOI] [PubMed] [Google Scholar]
- 39.Holte, L., and K. Gawrisch. 1997. Determining ethanol distributions in phospholipid multilayers with MAS-NOESY spectra. Biochemistry. 36:4669–4674. [DOI] [PubMed] [Google Scholar]
- 40.Pandit, S., D. Bostick, and M. Berkowitz. 2003. Molecular dynamics simulation of a dipalmitoylphosphatidylcholine bilayer with NaCl. Biophys. J. 84:3743–3750. [DOI] [PMC free article] [PubMed] [Google Scholar]
- 41.Kuo, A., and C. Wade. 1979. Lipid lateral diffusion by pulsed nuclear magnetic resonance. Biochemistry. 18:2300–2308. [DOI] [PubMed] [Google Scholar]
- 42.Kandasamy, S., and R. Larson. 2006. Cation and anion transport through hydrophilic pores in lipid bilayers. J. Chem. Phys. 125: article 074901. [DOI] [PubMed]
- 43.Tieleman, D., and S. Marrink. 2006. Lipids out of equilibrium: Energetics of desorption and pore mediated flip-flop. J. Am. Chem. Soc. 128:12462–12467. [DOI] [PubMed] [Google Scholar]
- 44.Crowe, J., F. Tablin, W. Wolkers, K. Gousset, N. Tsvetkova, and J. Ricker. 2003. Stabilization of membranes in human platelets freeze-dried with trehalose. Chem. Phys. Lipids. 122:41–52. [DOI] [PubMed] [Google Scholar]


