Abstract
Soluble aggregates critically influence the chemical and biological aspects of amyloid protein aggregation, but their population is difficult to measure, especially in vivo. We take an optical fiber-based fluorescence correlation spectroscopy (FCS) approach to characterize a solution of aggregating amyloid-β molecules. We find that this technique can easily resolve aggregate particles of size 100 nm or greater in vitro, and the size distribution of these particles agrees well with that obtained by conventional FCS techniques. We propose fiber FCS as a tool for studying aggregation in vivo.
Recent studies suggest that the soluble aggregates of amyloid-β peptide (Aβ), rather than the amyloid deposits, are the main pathogenic species in Alzheimer's disease (AD) (1–4). Similar species are also thought to be responsible for many other aggregation-related diseases, such as Huntington's and Parkinson's (2,5). Hence, many of the current clinical strategies target these aggregates to prevent neuronal loss in AD (6,7). Unfortunately, presymptomatic diagnosis of the disease has achieved limited success (8). An effective strategy for diagnosis would be to detect the soluble aggregates, which appear early and are potently toxic, in vivo. Monitoring the effectiveness of a candidate drug or a treatment routine, say in a model animal, also requires monitoring of these aggregates inside the brain over time.
In vitro, such aggregates can be detected using fluorescence correlation spectroscopy (FCS) (9–11). FCS measurements have helped uncover chemical agents that can lower the population of these aggregates (11). Unfortunately, FCS uses bulky optics, and at present it is not possible to use it inside the brain. Here we explore the possibility of measuring protein aggregation in a minimally invasive manner, extending a recently demonstrated scheme that uses a single mode fiber for obtaining FCS data from fluorescent beads (12). Comparatively lower sensitivity, higher background fluorescence, and higher photobleaching make this technique inappropriate for detecting single fluorescent molecules. However, an aggregated protein particle, where a fraction of the monomers is labeled with a fluorophore, can present a target much brighter than a single molecule, and may possibly be amenable to the fiber technique. Here we monitor an aggregating Aβ solution in vitro with fiber-based FCS, and compare the results with conventional FCS.
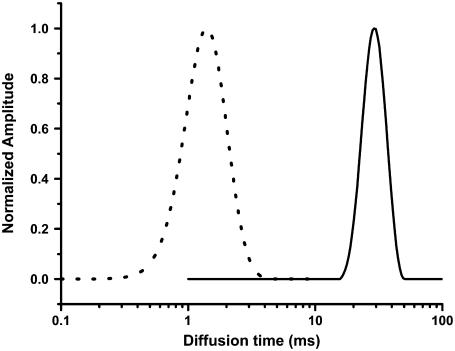
We first calibrate the fiber FCS instrument with a solution of fluorescent beads of 13 nm radius. The fiber optic arrangement is similar to that reported earlier (12). In this setup, a single mode optical fiber (mode field radius = 1.7 μm) is used both for delivering the excitation light (543 nm) and also for collecting the fluorescence from the sample. This setup is automatically confocal and can be used for FCS measurements (12,13). We fit the FCS data using the MEMFCS routine (14), which analyzes the data in terms of a quasicontinuous distribution of diffusion constants. Such analysis is required for characterizing highly heterogeneous aggregating protein solutions (10,11). The size distribution obtained from the bead solution using the fiber FCS setup is shown in Fig. 1 (solid line). The single-peaked distribution is centered around 30 ms. The size distribution obtained from the same specimen using a conventional FCS instrument (15) of the same specimen is shown as a dotted line in Fig. 1. We see that the two size distributions are similar, except that the fiber FCS curve is peaked at a time point that is 21 times higher than that of the conventional FCS. This is due to the larger probe volume of the fiber FCS instrument, and this provides a size calibration for any unknown particle measured with this technique.
FIGURE 1.
Calibration of the fiber FCS instrument. The size distributions obtained using fiber FCS (solid line) and conventional FCS (dotted line) from fluorescent beads of radius 13 nm.
We note that the probe volume can be theoretically calculated from the geometry of the fiber and that of the optical system, and agrees well with the experimentally observed probe volume (12).
We then examine our ability to characterize the aggregation state of an Aβ solution by examining it in vitro, first with fiber FCS and then with conventional FCS. We prepare a 10-μM Aβ solution mixed with 100 nM rhodamine-labeled Aβ (RAβ)(both purchased from rPeptide, Athens, GA) at pH 7.4 in HEPES buffer and incubate it for 6 h at room temperature.
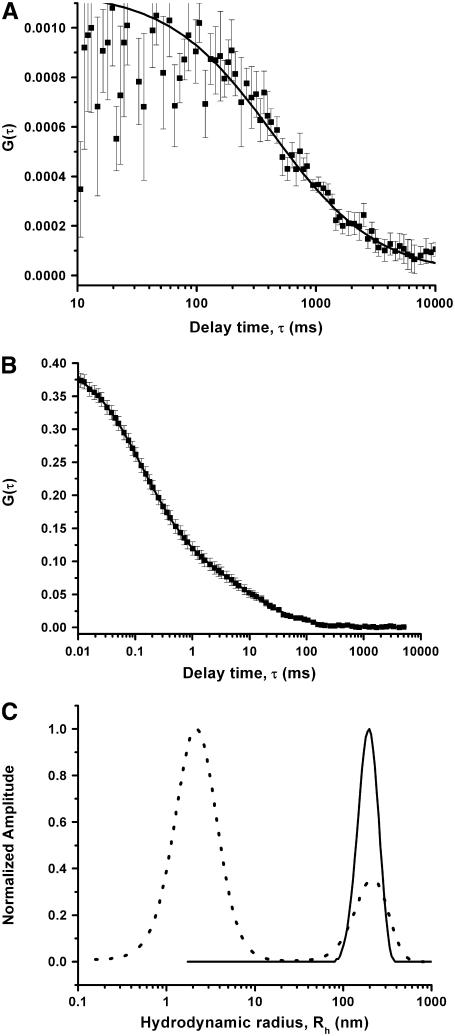
Fig. 2 A shows the autocorrelation data (solid squares) obtained from a fiber FCS measurement of this sample. The data are fit (solid line) with MEMFCS. The size distribution obtained from this data is shown in Fig. 2 C (solid line). The same solution then is examined by conventional FCS. The autocorrelation data and the fit are shown in Fig. 2 B. The error bars in the autocorrelation traces in all the figures are calculated from 10 identical measurements for 3 min each. The size distribution is plotted (as a dotted line) in Fig. 2 C. The abscissa denotes the hydrodynamic size in nanometers. This axis has been calibrated using the ratio of the size and the diffusion time of the beads obtained from Fig. 1. The fiber FCS data show the existence of a clear peak centered around 200 nm, and extending from ∼130 to ∼270 nm. The conventional FCS data on the other hand show a similar peak at 210 nm, but in addition, they also show a peak at 2.1 nm. The heights of the largest peaks are normalized to unity. The similarity of the second peak observed in conventional and that observed with fiber FCS establishes that the larger aggregates can be effectively seen with fiber FCS. On the other hand, it is clear that the peak at the smaller size range, which contains the monomer and the small oligomers (the calculated value of the hydrodynamic radius for the monomer is 1.7 nm), is resolved only by conventional FCS.
FIGURE 2.
Measurement from aggregating Aβ solution. Autocorrelation data (solid squares) with fit (solid line) obtained from 10 μM Aβ + 100 nM RAβ after 6 h of preparation of the solution using (A) fiber FCS and (B) conventional FCS instrument. (C) Size distributions obtained using fiber FCS (solid line) and conventional FCS (dotted line). The size axis has been calibrated using the data from Fig. 1.
We note here that due to the relatively long residence time of the particles in the fiber FCS confocal volume, photobleaching may be a concern. We estimate the probability of bleaching from the molar extinction coefficient for rhodamine-B in water at 543 nm (∼50,000 l/mol cm), and the average intensity of the excitation light in the FCS observation volume (∼3 × 1025 photons/m2). The number of photons absorbed by a rhodamine label during the residence time of an aggregate (∼0.5 s) is <1.2 × 10⁵. The average number of photons absorbed by a bioconjugated rhodamine-6G molecule before photobleaching is ∼3 × 10⁵ (16). We thus expect a large fraction of the oligomers to remain unbleached. Because the oligomers are multiply labeled, photobleaching is unlikely to have a major effect on the FCS data.
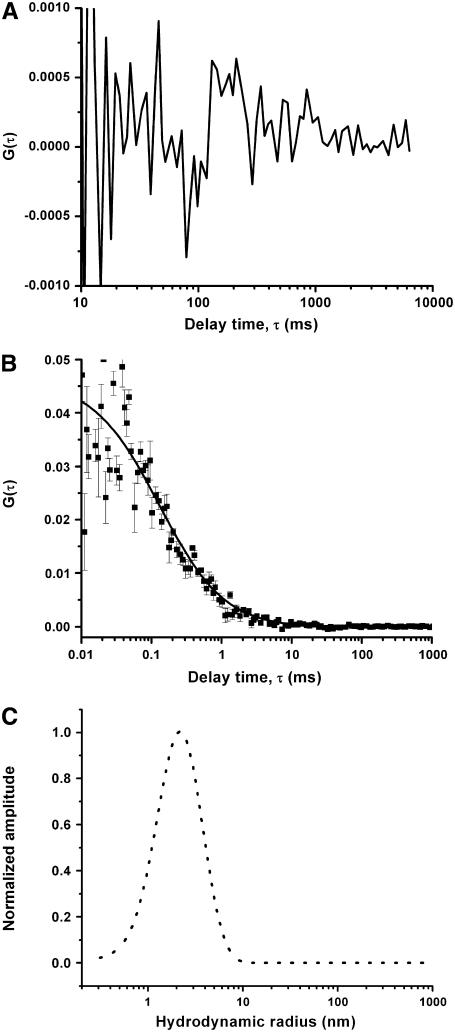
We also examine a control Aβ solution that has been aged for 2 weeks, and that does not have appreciable amounts of the soluble aggregates left in it. The fiber FCS instrument does not show any appreciable correlation from this specimen (Fig. 3 A), whereas the conventional FCS experiment shows a short time correlation extending to ∼2 ms (Fig. 3 B). The analysis of the conventional FCS data (Fig. 3 C, dotted line) shows that the specimen only contains monomers and small oligomers, and no appreciable amount of higher order aggregates. This establishes the reliability of the fiber FCS technique to faithfully report the presence or absence of the large soluble aggregates in an aggregating amyloid-β solution.
FIGURE 3.
Measurement from an equilibrium Aβ solution. Autocorrelation data (solid squares) with fit (solid line) obtained from 10 μM Aβ + 100 nM RAβ after 2 weeks of preparation of the solution using (A) fiber FCS and (B) conventional FCS instrument. (C) Size distribution from conventional FCS (dotted line). The size axis has been calibrated using the data from Fig. 1.
The ability to resolve particles directly depends on the signal/noise of the instruments. The results show that particles in the size range of 1.7–5.0 nm, which are most likely labeled with a single fluorescent label, do not have adequate brightness to be observed by the fiber FCS technique. However, many reports have shown that the larger soluble aggregates, or protofibrils, are potently toxic to the neuronal cells (1). These species are detected well by the fiber FCS technique. Optical fibers of diameters larger than what has been used here have been introduced into living rodents and their brains have been optically monitored over long periods (17). If such fibers are used for FCS, with some amount of fluorescently labeled amyloid-β introduced into the cerebrospinal fluid, it should be possible to monitor the population of large soluble aggregates in vivo, e.g., in the brain of an Alzheimer model mouse (18). This study thus highlights a possible route toward quantitative monitoring of the aggregation of physiological molecules in vivo.
References
- 1.Hartley, D. M., D. M. Walsh, C. P. Ye, T. Diehl, S. Vasquez, P. M. Vassilev, D. B. Teplow, and D. J. Selkoe. 1999. Protofibrillar intermediates of amyloid beta-protein induce acute electrophysiological changes and progressive neurotoxicity in cortical neurons. J. Neurosci. 19:8876–8884. [DOI] [PMC free article] [PubMed] [Google Scholar]
- 2.Lashuel, H. A., D. Hartley, B. M. Petre, T. Walz, and P. T. Lansbury Jr. 2002. Neurodegenerative disease: amyloid pores from pathogenic mutations. Nature. 418:291. [DOI] [PubMed] [Google Scholar]
- 3.Hoshi, M., M. Sato, S. Matsumoto, A. Noguchi, K. Yasutake, N. Yoshida, and K. Sato. 2003. Spherical aggregates of beta-amyloid (amylospheroid) show high neurotoxicity and activate tau protein kinase I/glycogen synthase kinase-3beta. Proc. Natl. Acad. Sci. USA. 100:6370–6375. [DOI] [PMC free article] [PubMed] [Google Scholar]
- 4.Klein, W. L., G. A. Krafft, and C. E. Finch. 2001. Targeting small Abeta oligomers: the solution to an Alzheimer's disease conundrum? Trends Neurosci. 24:219–224. [DOI] [PubMed] [Google Scholar]
- 5.Bucciantini, M., E. Giannoni, F. Chiti, F. Baroni, L. Formigli, J. Zurdo, N. Taddei, G. Ramponi, C. M. Dobson, and M. Stefani. 2002. Inherent toxicity of aggregates implies a common mechanism for protein misfolding diseases. Nature. 416:507–511. [DOI] [PubMed] [Google Scholar]
- 6.Klyubin, I., D. M. Walsh, C. A. Lemere, W. K. Cullen, G. M. Shankar, V. Betts, E. T. Spooner, L. Jiang, R. Anwyl, D. J. Selkoe, and M. J. Rowan. 2005. Amyloid beta protein immunotherapy neutralizes Abeta oligomers that disrupt synaptic plasticity in vivo. Nat. Med. 11:556–561. [DOI] [PubMed] [Google Scholar]
- 7.Yang, F., G. P. Lim, A. N. Begum, O. J. Ubeda, M. R. Simmons, S. S. Ambegaokar, P. P. Chen, R. Kayed, C. G. Glabe, S. A. Frautschy, and G. M. Cole. 2005. Curcumin inhibits formation of amyloid beta oligomers and fibrils, binds plaques, and reduces amyloid in vivo. J. Biol. Chem. 280:5892–5901. [DOI] [PubMed] [Google Scholar]
- 8.Jellinger, K. A. 2006. Alzheimer 100: highlights in the history of Alzheimer research. J. Neural Transm. 113:1603–1623. [DOI] [PubMed] [Google Scholar]
- 9.Tjernberg, L. O., A. Pramanik, S. Bjorling, P. Thyberg, J. Thyberg, C. Nordstedt, K. D. Berndt, L. Terenius, and R. Rigler. 1999. Amyloid beta-peptide polymerization studied using fluorescence correlation spectroscopy. Chem. Biol. 6:53–62. [DOI] [PubMed] [Google Scholar]
- 10.Sengupta, P., K. Garai, B. Sahoo, Y. Shi, D. J. Callaway, and S. Maiti. 2003. The amyloid beta peptide (Abeta(1–40)) is thermodynamically soluble at physiological concentrations. Biochemistry. 42:10506–10513. [DOI] [PubMed] [Google Scholar]
- 11.Garai, K., P. Sengupta, B. Sahoo, and S. Maiti. 2006. Selective destabilization of soluble amyloid beta oligomers by divalent metal ions. Biochem. Biophys. Res. Commun. 345:210–215. [DOI] [PubMed] [Google Scholar]
- 12.Garai, K., M. Muralidhar, and S. Maiti. 2006. Fiber-optic fluorescence correlation spectrometer. Appl. Opt. 45:7538–7542. [DOI] [PubMed] [Google Scholar]
- 13.Balaji, J., K. Garai, S. Chakrabarti, and S. Maiti. 2003. Axial resolution limit of a fiber-optic fluorescence probe. Appl. Opt. 42:3780–3784. [DOI] [PubMed] [Google Scholar]
- 14.Sengupta, P., K. Garai, J. Balaji, N. Periasamy, and S. Maiti. 2003. Measuring size distribution in highly heterogeneous systems with fluorescence correlation spectroscopy. Biophys. J. 84:1977–1984. [DOI] [PMC free article] [PubMed] [Google Scholar]
- 15.Sengupta, P., J. Balaji, and S. Maiti. 2002. Measuring diffusion in cell membranes by fluorescence correlation spectroscopy. Methods. 27:374–387. [DOI] [PubMed] [Google Scholar]
- 16.Wennmalm, S., and R. Rigler. On death numbers and survival times of single dye molecules. 1999. J. Phys. Chem. B. 103:2516–2519. [Google Scholar]
- 17.Adelsberger, H., O. Garaschuk, and A. Konnerth. 2005. Cortical calcium waves in resting newborn mice. Nat. Neurosci. 8:988–990. [DOI] [PubMed] [Google Scholar]
- 18.Games, D., D. Adams, R. Alessandrini, R. Barbour, P. Berthelette, C. Blackwell, T. Carr, J. Clemens, T. Donaldson, F. Gillespie, T. Guido, S. Hangopian, et al. 1995. Alzheimer-type neuropathology in transgenic mice overexpressing V717F beta-amyloid precursor protein. Nature. 373:523–527. [DOI] [PubMed] [Google Scholar]


