

Abstract
Mitochondrial abnormalities are found in Alzheimer’s disease (AD), but previous reports haven’t examined at-risk groups. In subjects with AD, mild cognitive impairment (MCI), and nondemented aged controls, platelet and lymphocyte mitochondria were isolated and analyzed for Complexes I, III, and IV of the electron transport chain. Western blots were used to control for differential enrichment of samples. Results demonstrated significant declines in Complexes III and IV in AD, and a significant decline in Complex IV in MCI. This report confirms mitochondrial deficiencies in AD, extends them to MCI, and suggests they are present at the earliest symptomatic stages of disease.
Keywords: cytochrome oxidase, cytochrome reductase, electron transport chain, Alzheimer’s disease, mild cognitive impairment, at-risk population
1. Introduction
Complex IV is deficient in AD platelet mitochondria (Parker et al., 1990) suggesting that AD may involve mitochondrial sequelae and that components of AD are systemic and unlikely to result from central neurodegeneration and activity-dependent downregulation. Parker’s original finding of reduced platelet Complex IV activity in AD has been replicated (Parker et al., 1994a; Bosetti et al., 2002; Cardoso et al., 2004a), yet the role of mitochondrial abnormalities remains largely undefined. Amyloid-β (Aβ), the protein that makes up the amyloid plaques in the brain of AD patients, has been shown to interact directly with mitochondria and inhibit Complex IV activity (Crouch et al., 2005) and induce oxidative stress (Lustbader et al., 2004).
Fluorodeoxyglucose (FDG) positron emission tomography (PET) studies of persons with Alzheimer’s disease (AD) (Minoshima et al., 1994, 1995, 1997; Mielke et al., 1994; Reiman et al., 1996) and mild cognitive impairment (MCI) characteristically show preferential and progressive neocortical reductions in the cerebral metabolic rate for glucose. MCI subjects who ultimately convert to dementia show specific reductions in prefrontal cortex and progressive decrements in posterior cingulate (Drzezga et al., 2003, 2005). Postmortem examination of hypometabolic posterior cingulate cortex in AD brains revealed decrements in oxidative metabolism (Valla et al., 2001), specifically in cytochrome oxidase activity, a component of Complex IV of the mitochondrial electron transport chain (ETC). We have also found that cognitively normal young-adult and middle-aged carriers of the apolipoprotein E ε 4 allele (APOE4), a common AD susceptibility gene, have functional brain abnormalities in the same neocortical regions as patients with probable AD, prior to the development of cognitive symptoms (Reiman et al., 2001, 2004, 2005). These ‘neurometabolic’ alterations may be the earliest brain abnormalities yet found in living persons at-risk for late-onset AD.
Considering these findings of early metabolic declines in the brains of AD patients and groups at-risk for dementia, we sought to extend previous findings of reduced complex IV activity in AD and hypothesized that such deficiency might also be observed in MCI patients, many of whom have an early stage of AD. Finding a deficiency in MCI subjects would support the hypothesis that mitochondrial dysfunction is an early event in AD pathophysiology, occurring near the onset of cognitive symptoms, and support further research in even younger at-risk populations.
2. Materials and Methods
Subjects with possible (N=1) or probable (N=7) AD (NINCDS-ADRDA criteria; McKhann et al., 1984), amnestic MCI (Petersen et al., 1999), and nondemented aged controls 65 years of age and older, were recruited from the clinical core of the Arizona AD Center (AZ ADC). Patients were eligible for clinical core inclusion following clinical evaluation that included medical and family histories, a neurological exam, structural brain imaging and laboratory tests. Each then received a consensus diagnosis by AZ ADC neurologists and completed AZ ADC procedures including the CDR (Morris et al., 1993), a neuropsychological test battery (encompassing memory, language, spatial, executive, and behavioral domains), APOE genotyping, and annual reassessment. For this study, we correlated test scores from the Folstein Mini-Mental Status Exam (MMSE), the Memory subscore of the Mattis Dementia Rating Scale (DRS), and the Total Learning and Percent Recall subscores of the Auditory-Verbal Learning Test (AVLT) with the results of mitochondrial assays. In addition to the general consent for the longitudinal studies from which subjects were recruited, all subjects (or legally authorized proxy) provided separate consent for the mitochondrial assays following IRB approval.
All chemicals are from Sigma unless noted. Each subject provided 40 ml of blood collected via standard venipuncture into 8 ml Cell Preparation Tubes (Vacutainer) containing 0.1 M sodium citrate as an anticoagulant and a polyester gel and Ficoll Hypaque for blood separation. Processing yielded a platelet- and mononuclear cell-enriched plasma separated from erythrocytes and other cell types by the polyester gel. The plasma was diluted with phosphate-buffered saline (PBS, pH 7.2–7.35) and cycled through several centrifugation and wash steps at room temperature to pellet lymphocytes and platelets in turn. Residual erythrocytes in the lymphocyte prep were osmotically lysed using ammonium chloride (155 mM NH4Cl [Fisher], 10 mM NaHCO3, 0.1 mM Na-EDTA in H2O, pH 7.2.–7.4). Final individual cell pellets were resuspended in isolation buffer (100 mM KCl, 50 mM Tris base, 5 mM MgCl2, 1 mM EGTA in H2O, pH 8.0) in 5 ml polystyrene round-bottom tubes. Protease inhibitors (1 μl/ml of 0.4 M PMSF in DMSO and 1 μl/ml of 5 mg/ml leupeptin in H2O) were added to prevent proteolytic damage. A portion of the intact platelet preparation was taken and stored at −80°C for additional analyses (e.g., mtDNA sequencing [Coon et al., 2006]). The tubes were then suspended in propylene glycol in the cup horn of a sonic dismembrator (Fisher Model 60) maintained at 4°C, and the cells were disrupted by brief sonication 0.5 cm above the cup horn. Considering that mitochondria appear to break down in AD (Hirai et al., 2001; Sergeant et al., 2003), special attention was paid to balancing mitochondrial yield against retention of a potentially fragile subpopulation of mitochondria in the patients, and thus, a number of initial patient samples were utilized to establish the appropriate cell disruption parameters (time and intensity), and only those within 2 steps (levels 3–6 of 20, for either 1 or 2 min) of the final platelet setting (level 4 of 20 for 1 min) were included in the final analysis. The overall mean time and intensity for platelet disruption was 1.5 min at level 4.6, with no significant differences between groups. Mean level for lymphocytes was 1.5 min at level 4.7, again with no significant differences. Debris and unlysed cells were subsequently pelleted with two centrifugations at 2000 RCF, followed by mitochondrial pelleting, repeated twice, at 10,000 RCF, all at 4°C. The resulting crude mitochondrial pellets, one for each cell type, were resuspended in 100 μl chilled buffer (0.25 M sucrose, 10 mM Tris base, 1 mM EGTA, 1 mM ATP in H2O, pH 7.4), and stored at −80°C for the assays.
All subsequent procedures were identical for the platelet and lymphocyte preparations. Protein from the mitochondrial isolate was quantified using the BioRad DC kit (Pierce) according to manufacturer’s instructions. Samples had to contain at least 40 μg of total protein to be included in the analysis; 2 AD and 2 control subjects did not have sufficient platelet protein yield and were excluded from further analyses. All assays were measured in a monochromator-equipped microplate reader (Molecular Devices Spectramax 190). The detailed methodology of the standardization and optimization of our microplate-based assays is presented in a manuscript in preparation. Final assay volume was 250μl in a 96-well plate. Extinction coefficients for activity calculation were empirically determined for the instrument, and pathlength was measured at 0.85 cm. All activity results are in nmol substrate/min/mg total protein.
Complex I activity was determined by oxidation of NADH at 340 nm. 10 μg mitochondrial isolate protein were added to 0.1% deoxycholate and 5 mg/ml fatty acid (FA)-free BSA in H2O to 200 μl and incubated for 1 min at 30°C. 50 μl of 5x assay buffer (50 mM Tris, pH 8.0, 240 μM KCN, 4 μM antimycin A, 800 μM NADH, 300 μM coenzyme Q1) were added and the change in absorbance of NADH was measured for 2 min. Subsequently, 2.5 μM rotenone (in EtOH) was added and the rate followed for 2 min. Activity was determined by subtracting the rotenone-inhibited rate from the initial rate.
Complex III activity was determined by reduction of cytochrome c at 550 nm. The electron donor was decylubiquinone (DB), reduced prior to the assay: a few grains of lithium borohydride (Aldrich) were added to 20 μM stock DB, until clear, approx 4 μl 12N HCl were added, reducing the pH to 1–2, and the clear product was stored at −80°C. For the assay, 10 μg mitochondrial isolate protein were added to 0.1% deoxycholate and 10 mg/ml FA-free BSA in H2O to 225 μl and incubated at room temp for 1 min. 25 μl of chilled 10x assay buffer (100 mM K+-phosphate, pH 7.55, 20 mM EDTA, 2.4 mM KCN, 40 μM rotenone, 40 μM cytochrome c, 800 μM reduced DB) were added and change in absorbance of cytochrome c was measured for 2 min at 30°C. A no-protein control was run in parallel to provide background.
Complex IV activity was determined by reduction of cytochrome c at 550 nm. Cytochrome c was first reduced: 10 mM cyt c in 2.5 ml H2O reduced with 1M ascorbic acid for 5 min and subsequently added to a PD-10 desalting column (Amersham) equilibrated with 20 mM K+-phosphate buffer, pH 7.0. Reduced cyt c was eluted from the column with 3.5 ml buffer, collected in equivalent fractions, and stored at −80°C. Reduction was verified >95% before each assay by comparing absorbance at 550 nm before and after adding dithionite. For the assay, 4 μg mitochondrial isolate protein were added to pure H2O to 225 μl and incubated at 30°C for 1 min. 25 μl of 10x assay buffer (200 mM K+-phosphate, pH 7.0, 0.7% reduced cyt c) were added and the change in absorbance of cytochrome c was measured for 2 min. Subsequently, 4 μl of 1 mM KCN were added and the rate followed for 2 min to provide background.
The internal normalization of the activity results was to be accomplished by the ratio of complex I and IV to complex III, as recommended by Barrientos (2002), given that no significant difference had been found previously in platelet Complex III (Parker et al., 1994a). The unanticipated finding of a significant difference across groups in Complex III activity precluded normalizing subjects by that internal ratio. We did not feel that the commonly-used correction by matrix enzymes (e.g., citrate synthase) would be appropriate since we did not know the structural integrity of our mitochondrial preparation following sonication; we had used citrate synthase previously to assess the disruption parameters and had found a proportionally large signal in the supernatant of our mitochondrial pellets (which we lessened but did not eliminate by reducing disruption power; data not shown), indicating mitochondrial leakage. Subsequently, we opted to assess the relative purity of our mitochondrial preparations via SDS-PAGE where possible. 10 μg mito isolate protein per lane were loaded into 10–20% 1.5 mm Tris-glycine 15-well minigels (Invitrogen) with Novex Tris-glycine SDS 2x sample buffer. Two lymphocyte preparations had sufficient samples for only 5 μg per lane (1 AD, 1 control) and several other samples were exhausted prior to this unanticipated analysis. Gels were run in Novex mini-cell (Invitrogen) for 2 hours at constant 150V with Novex Tris-glycine SDS running buffer. Proteins were transferred to Immobilon P (Millipore) PVDF membrane, fully submerged in CAPS transfer buffer (10 mM 3-[cyclohexylamino]-1-propane sulfonic acid, pH 11 with NaOH, 10% methanol) using constant 150 mA for 2 hours. Membranes were blocked overnight in 5% Carnation dry milk in PBS at 4°C, and then probed with the Total OXPHOS Detection Kit (MS601; 1:1000 in 1% dry milk) available from Mitosciences (Eugene, OR), 2 hours at room temperature with gentle rocking. This five-antibody cocktail marks the 20 kDa subunit of Complex I (ND6), the 30 kDa iron-sulfur subunit of Complex II, the core 2 subunit of Complex III, COX II of Complex IV, and the F1α subunit of ATP synthase. Goat anti-mouse alkaline phosphatase (AP)-conjugated secondary antibody (Santa Cruz Biotechnology; 1:10,000 in 1% dry milk) was used (2 hours room temperature with rocking), followed by application of an AP substrate detection kit (Biorad),according to manufacturer’s instructions. Membranes were dried overnight then scanned on a Mustek A3 EP flatbed scanner along with an optical density (OD) step tablet for calibration. Membrane images were imported into Optimas (Media Cybernetics) image analysis software and average OD measures of each band were taken using a sampling window of constant size.
Final assay results were calculated from a minimum of two reliable assays per ETC complex. Individual complex assay results either 3x greater or lesser than another measure of that complex from the same subject were deemed unreliable and not included in the calculation or count. Complex I assay was performed last and was omitted if insufficient sample existed to run at least two assays. Reported values are mean ± standard deviation. All comparative statistical tests are Student’s 2-tailed t-tests, uncorrected for multiple comparisons.
3. Results
Demographic characteristics, clinical ratings, and neuropsychological test scores are shown in Table 1. Mean age (76.2 ± 7.5) and education (15.4 ± 3.7) did not differ between groups, although the ages of the MCI and AD groups were greater than that of controls. Differences between the groups on cognitive measures were commensurate with clinical diagnoses.
Table 1.
Demographic characteristics, clinical ratings, and neuropsychological test scores (mean ± standard deviation where appropriate). Statistical tests are Students 2-tailed t-tests, uncorrected for multiple comparisons, with calculated P values shown. Years since onset indicates years since estimated initial onset of symptoms, based on subject/informant’s reported age at symptom onset. Some test scores were not available for all subjects; sample N for each test is shown in parenthesis.
| Controls
N = 7 |
MCI
N = 5 |
AD
N = 8 (1 poss, 7 prob) |
P: Ctl v. MCI | P: Ctl v. AD | |
|---|---|---|---|---|---|
| Gender | 6 F, 1 M | 4 F, 1 M | 4 F, 4 M | ||
| Age (years) | 72.6 ± 5.7 | 78.1 ± 9.4 | 78.2 ± 7.2 | 0.229 | 0.124 |
| Range | 65.2 – 80.6 | 67.2 – 89.3 | 69.0 – 90.7 | ||
| Education (years) | 15.8 ± 5.2 | 15.0 ± 2.4 | 15.3 ± 3.3 | 0.762 | 0.813 |
| APOE4 carriers | 3 | 1 (1 unknown) | 5 | ||
| Years since onset | 4.3 ± 0.8 | 5.3 ± 2.4 | |||
| Range | 3.0 – 5.2 | 2.0 – 9.4 | |||
| Folstein MMSE | 29.7 ± 0.5 (6) | 26.4 ± 1.5 (5) | 17.3 ± 6.9 (7) | 0.0008 | 0.0009 |
| Mattis DRS-Memory | 24.0 ± 1.1 (6) | 15.8 ± 2.4 (5) | 9.5 ± 3.9 (8) | 0.00003 | 0.000001 |
| AVLT-Total learning | 47.6 ± 8.2 (7) | 28.6 ± 2.7 (5) | 19.0 ± 5.0 (5) | 0.0006 | 0.00004 |
| AVLT-Percent recall | 82.7 ± 22.4 (7) | 13.2 ± 8.2 (5) | 12.8 ± 21.7 (5) | 0.00006 | 0.0003 |
Platelet enzyme assays and the optical densities of the Western blot bands are shown in Table 2. In comparison with the aged normal controls, AD patients had significantly lower platelet Complex IV activity (with a mean reduction of 37%) and Complex III activity (with a mean reduction of 39%). Similarly, in comparison with the aged normal controls, MCI patients had significantly lower Complex IV activity (with a mean reduction of 45%) and a non-significant trend for lower Complex III activity (with a mean reduction of 23%; Table 2 and Figure 1). No significant differences were found between total protein levels isolated or in Complex I activity, although power in the Complex I analysis was reduced due to 3 unassessable samples in the control group. No significant differences were found for any of the same assays in lymphocytes (P > 0.3, data not shown).
Table 2.
Platelet enzyme assays (nmol/min/mg) and SDS-PAGE analysis (OD). Statistical tests are Students 2-tailed t-tests, uncorrected for multiple comparisons, but with calculated P values shown. All subjects yielded Complex IV and III assay data; 1 MCI subject and 3 controls did not yield Complex I assay data. SDS-PAGE data for some bands were not available for some subjects; sample N for each is shown in parenthesis. A high outlier in the AD group skewed the SDS-PAGE OD means upward but was ameliorated by calculating the internal expression ratios of III and IV to I.
| Controls | MCI | AD | P: Ctl v. MCI | P: Ctl v. AD | |
|---|---|---|---|---|---|
| Assays: | |||||
| Complex IV | 114.4 ± 30.0 | 63.1 ± 38.6 | 72.0 ± 29.1 | 0.026 | 0.016 |
| Complex III | 131.1 ± 28.4 | 101.0 ± 31.2 | 80.2 ± 24.4 | 0.112 | 0.002 |
| Complex I | 50.2 ± 24.2 | 58.0 ± 29.2 | 49.8 ± 17.4 | 0.682 | 0.975 |
| Protein (μg/μl) | 1.4 ± 0.3 | 1.3 ± 0.5 | 1.4 ± 0.2 | 0.684 | 0.908 |
| SDS-PAGE: | |||||
| Complex IV | 0.156 ± 0.035 (5) | 0.077 ± 0.046 (3) | 0.171 ± 0.124 (6) | 0.031 | 0.798 |
| Complex III | 0.050 ± 0.033 (5) | 0.022 ± 0.016 (3) | 0.056 ± 0.053 (5) | 0.312 | 0.848 |
| Complex II | 0.029 ± 0.022 (5) | 0.022 (1) | 0.075 ± 0.144 (6) | 0.779 | 0.507 |
| Complex I | 0.094 ± 0.070 (5) | 0.051 ± 0.050 (3) | 0.105 ± 0.109 (6) | 0.397 | 0.849 |
| ATPase (V) | 0.280 ± 0.061 (5) | 0.202 ± 0.087 (3) | 0.264 ± 0.106 (6) | 0.183 | 0.777 |
| Ratio IV:I | 2.41 ± 1.54 (5) | 1.96 ± 1.16 (3) | 2.26 ± 1.29 (6) | 0.683 | 0.867 |
| Ratio III:I | 0.75 ± 0.87 (5) | 0.38 ± 0.11 (2) | 0.67 ± 0.61 (5) | 0.601 | 0.878 |
Figure 1.
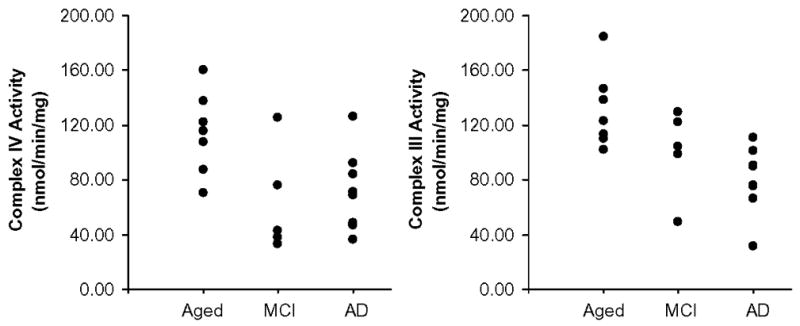
Platelet mitochondrial Complex IV and Complex III activities in nmol cyt c / min / mg total mitochondrial isolate protein. Significant (p < 0.05) decrements in Complex IV activity were found in AD and MCI patients; significant decrements in Complex III were found in AD patients only.
Semi-quantitative assessment of the Western blots yielded one statistically significant result, although again, power was reduced by the exhaustion of a number of samples (see Table 2). In comparison with the aged normal controls, Complex IV subunit II (COXII) OD was significantly lower in the MCI group; however, this difference was no longer apparent when the ratio of each subunit to the Complex I ND6 subunit was calculated to normalize across these samples to correct for varying purity. No significant differences were found in the lymphocyte preparation (data not shown); although it suffered similar power issues, all means were similar across groups.
Pearson correlations were calculated between Complex III and Complex IV activities and the MMSE, the memory subscore of the DRS, and the total learning and percent recall subscores of the AVLT. Across all subjects, there were no significant correlations between activity and performance, nor were there any significant correlations when considering AD and MCI together (P > 0.05). However, in the AD group alone, Complex IV activity positively correlated with the DRS memory scale (r = 0.72, P = 0.05, uncorrected for multiple comparisons), and with MMSE score in the MCI group (r = 0.88, P = 0.05, uncorrected for multiple comparisons). None of the cognitive measures correlated significantly with Complex III activity.
4. Discussion
This study confirms previous reports finding abnormally low platelet ETC Complex IV (cytochrome oxidase) activity in patients with AD and it raises the possibility of abnormally low platelet ETC Complex III (cytochrome reductase) activity in patients with AD and in patients with MCI.
To our knowledge, this is the first report of Complex III deficiency in AD, although deficiencies in both Complexes III and IV has been reported in a transgenic mouse model of AD (Caspersen et al., 2005). The finding in patients with MCI raises the possibility of detecting similar findings even earlier (e.g., in younger, cognitively normal APOE ε4 carriers, before the onset of any symptoms or AD pathology). The absence of lymphocyte deficiencies in the same mitochondrial measurements has been reported before (Molina et al., 1997), but not with simultaneous measurement of other cell types. It remains possible that negative findings could be due to the loss of a diminished mitochondrial population during the isolation procedure or other methodological reasons specific to the cell type. Alternatively, longer-lived cells, such as platelet-forming megakaryocytes or neurons, may be more vulnerable or have more opportunity to reach a threshold required to show such defects (Mazat et al., 2001).
The platelet activities of Complexes II–IV and citrate synthase were examined by Parker et al. (1994a), and they reported a significant reduction only in Complex IV in AD patients. Complex III was decreased slightly in their study, and other groups finding ETC Complex IV deficiency did not also examine Complex III (Bosetti et al., 2002; Cardoso et al., 2004a). The disparity between our results and Parker et al. could be ascribed to methodological differences in our assays, particularly in the selection of ubiquinol analogs: they cite usage of ubiquinol-2 (Q2) while we employed decylubiquinol. Choice of analog can have significant effects on the background reactions in the assay (Krahenbuhl et al., 1994). Most other features of our analyses were similar as we drew from Parker and colleagues’ published procedures during the establishment of our mitochondrial isolation.
One limitation of this study is the failure to thoroughly control for protein levels of the affected enzyme complexes. Our original intent to use Complex III activity as an internal control would have been effective (Barrientos, 2002); Complex I could be used, but it tends to be the most difficult complex to assay and results were not available for every subject. Our Western data, as well as previous literature reports (Parker et al., 1990, 1994a; Parker and Parks, 1995), support the contention that Complex IV is catalytically abnormal in AD while protein levels remain normal; it remains unproven what effect that would have on Complex III, if Complex III itself were not also abnormal but subsequently downregulated, or vice versa. While Parker and Parks (1995) characterized a specific catalytic abnormality in Complex IV, the same type of analysis has not been performed on Complex III.
There were only 2 modest correlations between Complex IV function and our selected measures of cognitive impairment, and the lack of significant correlations across the combined AD and MCI groups indicates those may have been spurious. Considering that we measured mitochondrial activity in platelets rather than brain, such deficiencies may not correlate with neurological failure. However, similar deficits in ETC Complex IV function have been reported in postmortem AD cortex (Kish et al., 1992; Mutisya et al., 1994; Parker et al., 1994b; Chagnon et al., 1995; Gonzalez-Lima et al., 1997; Valla et al., 2001; Bosetti et al., 2002). The mitochondrial threshold effect may also preclude strong correlations between enzyme activity and cognitive impairment (Mazat et al., 2001).
The precise role of mitochondrial deficiencies in AD and their etiologies remain largely undefined. It is possible that mitochondrial changes are an early event in AD pathophysiology, playing a role in the etiology of the disease, alone, or as a co-factor synergistically interacting with early amyloid (Lustbader et al., 2004; Crouch et al., 2005; Caspersen et al., 2005) and/or tau alterations (Mandelkow et al., 2003). Platelets produce considerable amyloid precursor protein (APP; Di Luca et al., 2000) and possess β-secretase activity, so platelet preparations would not be immune from potential Aβ interactions (Padovani et al., 2002). The pathologies may simply induce catalytic changes in the enzymes, an idea supported by energy metabolism changes in transgenic mouse models of AD (Dodart et al., 1999; Reiman et al., 2000; Strazielle et al., 2003; Reddy et al., 2004; Caspersen et al., 2005; Valla et al., 2006). Conversely, energy inhibition can alter APP processing in cultured cells (Gabuzda et al., 1994), in mouse models of amyloid overexpression, increasing β-secretase activity and amyloidogenicity (Velliquette et al, 2005), and in rats, exacerbating Aβ peptide toxicity, particularly in synapses (Arias et al., 2002). Also, mitochondrial involvement in AD etiology is supported by studies using a cybrid cell model, which utilizes mtDNA-depleted cultured cells re-populated with AD patient or control mitochondria. This model has been shown to recapitulate many AD features, including depressed ETC activity, increased reactive oxygen species production, reduced mitochondrial membrane potential, abnormal mitochondrial morphology, increased basal Ca2+ level, increased cytosolic cytochrome c, increased caspase-3 activity, and increased β-amyloid secretion, increased intracellular Aβ, and the development of Congo red-positive deposits in vitro (Sheehan et al., 1997; Swerdlow et al., 1997; Cassarino et al., 1998; Khan et al., 2000; Trimmer et al., 2000, 2004; Cardoso et al., 2004b).
In conclusion, this study has verified the hypothesis that mitochondrial deficits in Complex IV of the ETC can be found in subjects with MCI, a common precursor to AD. Furthermore, we describe a previously unreported deficit in Complex III in AD patients, and a trend toward the same in MCI. These findings leave open the possibility that mitochondrial dysfunction is occurring prior to symptom onset, perhaps in conjunction with other pathological changes occurring many years before the disease manifests and suggest the need to extend these studies even earlier to cognitively normal persons at differential genetic risk for AD. Further research is underway to determine the precise interplay and temporal relationship between mitochondrial changes and neuropathology and to find mitochondrial targets for intervention that may slow or stop the progression of this debilitating disease.
Acknowledgments
We thank the volunteer subjects, neurologists, neuropsychologists, and clinical coordinators who participated and assisted in this study. Gale Kittle, Sandra Yee Benedetto, Linda Vetters, Marjorie Baldwin, and Michael Malek-Ahmadi provided considerable assistance. We thank our colleagues at the Mayo Clinic, Jacksonville, FL, for portions of the APOE genotyping. Support provided by the Arizona ADCC (P30 AG019610), Arizona ADCC and Alzheimer’s Disease Consortium pilot grants to J.V. and K.C., the Barrow Neurological Foundation, and the Harrington Research Center.
Footnotes
Publisher's Disclaimer: This is a PDF file of an unedited manuscript that has been accepted for publication. As a service to our customers we are providing this early version of the manuscript. The manuscript will undergo copyediting, typesetting, and review of the resulting proof before it is published in its final citable form. Please note that during the production process errors may be discovered which could affect the content, and all legal disclaimers that apply to the journal pertain.
References
- Arias C, Montiel T, Quiroz-Baez R, Massieu L. beta-Amyloid neurotoxicity is exacerbated during glycolysis inhibition and mitochondrial impairment in the rat hippocampus in vivo and in isolated nerve terminals: implications for Alzheimer’s disease. Exp Neurol. 2002;176:163–174. doi: 10.1006/exnr.2002.7912. [DOI] [PubMed] [Google Scholar]
- Barrientos A. In vivo and in organello assessment of OXPHOS activities. Methods. 2002;26:307–316. doi: 10.1016/S1046-2023(02)00036-1. [DOI] [PubMed] [Google Scholar]
- Bosetti F, Brizzi F, Barogi S, Mancuso M, Siciliano G, Tendi EA, Murri L, Rapoport SI, Solaini G. Cytochrome c oxidase and mitochondrial F(1)F(0)-ATPase (ATP synthase) activities in platelets and brain from patients with Alzheimer’s disease. Neurobiol Aging. 2002;23:371–376. doi: 10.1016/s0197-4580(01)00314-1. [DOI] [PubMed] [Google Scholar]
- Cardoso SM, Proenca MT, Santos S, Santana I, Oliveira CR. Cytochrome c oxidase is decreased in Alzheimer’s disease platelets. Neurobiol Aging. 2004a;25:105–110. doi: 10.1016/s0197-4580(03)00033-2. [DOI] [PubMed] [Google Scholar]
- Cardoso SM, Santana I, Swerdlow RH, Oliveira CR. Mitochondria dysfunction of Alzheimer’s disease cybrids enhances Abeta toxicity. J Neurochem. 2004b;89:1417–1426. doi: 10.1111/j.1471-4159.2004.02438.x. [DOI] [PubMed] [Google Scholar]
- Caspersen C, Wang N, Yao J, Sosunov A, Chen X, Lustbader JW, Xu HW, Stern D, McKhann G, Yan SD. Mitochondrial Abeta: a potential focal point for neuronal metabolic dysfunction in Alzheimer’s disease. FASEB J. 2005;19:2040–2041. doi: 10.1096/fj.05-3735fje. [DOI] [PubMed] [Google Scholar]
- Cassarino DS, Swerdlow RH, Parks JK, Parker WD, Jr, Bennett JP., Jr Cyclosporin A increases resting mitochondrial membrane potential in SY5Y cells and reverses the depressed mitochondrial membrane potential of Alzheimer’s disease cybrids. Biochem Biophys Res Comm. 1998;248:168–173. doi: 10.1006/bbrc.1998.8866. [DOI] [PubMed] [Google Scholar]
- Chagnon P, Betard C, Robitaille Y, Cholette A, Gauvreau D. Distribution of brain cytochrome oxidase activity in various neurodegenerative diseases. Neuroreport. 1995;6:711–715. doi: 10.1097/00001756-199503270-00002. [DOI] [PubMed] [Google Scholar]
- Coon KD, Valla J, Szelinger S, Schneider LE, Niedzielko TL, Brown KM, Pearson JV, Halperin R, Dunckley T, Stafford P, Papassotiropoulos A, Caselli RJ, Reiman EM, Stephan DA. Quantitation of heteroplasmy of mtDNA sequence variants identified in a population of AD patients and controls by array-based resequencing. Mitochondrion. 2006 doi: 10.1016/j.mito.2006.07.002. in press. [DOI] [PubMed] [Google Scholar]
- Crouch PJ, Blake R, Duce JA, Ciccotosto GD, Li QX, Barnham KJ, Curtain CC, Cherny RA, Cappai R, Dyrks T, Masters CL, Trounce IA. Copper-dependent inhibition of human cytochrome c oxidase by a dimeric conformer of amyloid-{beta}1–42. J Neurosci. 2005;25:672–679. doi: 10.1523/JNEUROSCI.4276-04.2005. [DOI] [PMC free article] [PubMed] [Google Scholar]
- Di Luca M, Colciaghi F, Pastorino L, Borroni B, Padovani A, Cattabeni F. Platelets as a peripheral district where to study pathogenetic mechanisms of Alzheimer disease: the case of amyloid precursor protein. Eur J Pharmacol. 2000;405:277–283. doi: 10.1016/s0014-2999(00)00559-8. [DOI] [PubMed] [Google Scholar]
- Dodart JC, Mathis C, Bales KR, Paul SM, Ungerer A. Early regional cerebral glucose hypometabolism in transgenic mice overexpressing the V717F beta-amyloid precursor protein. Neurosci Lett. 1999;277:49–52. doi: 10.1016/s0304-3940(99)00847-2. [DOI] [PubMed] [Google Scholar]
- Drzezga A, Lautenschlager N, Siebner H, Riemenschneider M, Willoch F, Minoshima S, Schwaiger M, Kurz A. Cerebral metabolic changes accompanying conversion of mild cognitive impairment into Alzheimer’s disease: a PET follow-up study. Eur J Nucl Med Mol Imaging. 2003;30:1104–1113. doi: 10.1007/s00259-003-1194-1. [DOI] [PubMed] [Google Scholar]
- Drzezga A, Grimmer T, Riemenschneider M, Lautenschlager N, Siebner H, Alexopoulus P, Minoshima S, Schwaiger M, Kurz A. Prediction of individual clinical outcome in MCI by means of genetic assessment and (18)F-FDG PET. J Nucl Med. 2005;46:1625–1632. [PubMed] [Google Scholar]
- Gabuzda D, Busciglio J, Chen LB, Matsudaira P, Yankner BA. Inhibition of energy metabolism alters the processing of amyloid precursor protein and induces a potentially amyloidogenic derivative. J Biol Chem. 1994;269:13623–13628. [PubMed] [Google Scholar]
- Gonzalez-Lima F, Valla J, Matos-Collazo S. Quantitative cytochemistry of cytochrome oxidase and cellular morphometry of the human inferior colliculus in control and Alzheimer’s patients. Brain Res. 1997;752:117–126. doi: 10.1016/s0006-8993(96)01464-3. [DOI] [PubMed] [Google Scholar]
- Hirai K, Aliev G, Nunomura A, Fujioka H, Russell RL, Atwood CS, Johnson AB, Kress Y, Vinters HV, Tabaton M, Shimohama S, Cash AD, Siedlak SL, Harris PL, Jones PK, Petersen RB, Perry G, Smith MA. Mitochondrial abnormalities in Alzheimer’s disease. J Neurosci. 2001;21:3017–3023. doi: 10.1523/JNEUROSCI.21-09-03017.2001. [DOI] [PMC free article] [PubMed] [Google Scholar]
- Khan SM, Cassarino DS, Abramova NN, Keeney PM, Borland MK, Trimmer PA, Krebs CT, Bennett JC, Parks JK, Swerdlow RH, Parker WD, Jr, Bennett JP., Jr Alzheimer’s disease cybrids replicate beta-amyloid abnormalities through cell death pathways. Ann Neurol. 2000;48:148–155. [PubMed] [Google Scholar]
- Kish SJ, Bergeron C, Rajput A, Dozic S, Mastrogiacomo F, Chang L, Wilson JM, DiStefano LM, Nobrega JN. Brain cytochrome oxidase in Alzheimer’s disease. J Neurochem. 1992;59:776–779. doi: 10.1111/j.1471-4159.1992.tb09439.x. [DOI] [PubMed] [Google Scholar]
- Krahenbuhl S, Talos C, Wiesmann U, Hoppel CL. Development and evaluation of a spectrophotometric assay for complex III in isolated mitochondria, tissues and fibroblasts from rats and humans. Clin Chim Acta. 1994;230:177–187. doi: 10.1016/0009-8981(94)90270-4. [DOI] [PubMed] [Google Scholar]
- Lustbader JW, Cirilli M, Lin C, Xu HW, Takuma K, Wang N, Caspersen C, Chen X, Pollak S, Chaney M, Trinchese F, Liu S, Gunn-Moore F, Lue LF, Walker DG, Kuppusamy P, Zewier ZL, Arancio O, Stern D, Yan SS, Wu H. ABAD directly links Abeta to mitochondrial toxicity in Alzheimer’s disease. Science. 2004;304:448–452. doi: 10.1126/science.1091230. [DOI] [PubMed] [Google Scholar]
- Mandelkow EM, Stamer K, Vogel R, Thies E, Mandelkow E. Clogging of axons by tau, inhibition of axonal traffic and starvation of synapses. Neurobiol Aging. 2003;24:1079–1085. doi: 10.1016/j.neurobiolaging.2003.04.007. [DOI] [PubMed] [Google Scholar]
- Mazat JP, Rossignol R, Malgat M, Rocher C, Faustin B, Letellier T. What do mitochondrial diseases teach us about normal mitochondrial functions that we already knew: threshold expression of mitochondrial defects. Biochim Biophys Acta. 2001;1504:20–30. doi: 10.1016/s0005-2728(00)00236-x. [DOI] [PubMed] [Google Scholar]
- McKhann G, Drachman D, Folstein M, Katzman R, Price D, Stadlan EM. Clinical diagnosis of Alzheimer’s disease: report of the NINCDS-ADRDA Work Group under the auspices of Department of Health and Human Services Task Force on Alzheimer’s Disease. Neurology. 1984;34:939–944. doi: 10.1212/wnl.34.7.939. [DOI] [PubMed] [Google Scholar]
- Mielke R, Herholz K, Grond M, Kessler J, Heiss WD. Clinical deterioration in probable Alzheimer’s disease correlates with progressive metabolic impairment of association areas. Dementia. 1994;5:36–41. doi: 10.1159/000106692. [DOI] [PubMed] [Google Scholar]
- Minoshima S, Foster NL, Kuhl DE. Posterior cingulate cortex in Alzheimer’s disease. Lancet. 1994;344:895. doi: 10.1016/s0140-6736(94)92871-1. [DOI] [PubMed] [Google Scholar]
- Minoshima S, Frey KA, Koeppe RA, Foster NL, Kuhl DE. A diagnostic approach in Alzheimer’s disease using three-dimensional stereotactic surface projections of fluorine-18-FDG PET. J Nucl Med. 1995;36:1238–1248. [PubMed] [Google Scholar]
- Minoshima S, Giordani B, Berent S, Frey KA, Foster NL, Kuhl DE. Metabolic reduction in the posterior cingulate cortex in very early Alzheimer’s disease. Ann Neurol. 1997;42:85–94. doi: 10.1002/ana.410420114. [DOI] [PubMed] [Google Scholar]
- Molina JA, de Bustos F, Jimenez-Jimenez FJ, Benito-Leon J, Gasalla T, Orti-Pareja M, Vela L, Bermejo F, Martin MA, Campos Y, Arenas J. Respiratory chain enzyme activities in isolated mitochondria of lymphocytes from patients with Alzheimer’s disease. Neurology. 1997;48:636–638. doi: 10.1212/wnl.48.3.636. [DOI] [PubMed] [Google Scholar]
- Morris JC. The Clinical Dementia Rating (CDR): current version and scoring rules. Neurology. 1993;43:2412–2414. doi: 10.1212/wnl.43.11.2412-a. [DOI] [PubMed] [Google Scholar]
- Mutisya EM, Bowling AC, Beal MF. Cortical cytochrome oxidase activity is reduced in Alzheimer’s disease. J Neurochem. 1994;63:2179–2184. doi: 10.1046/j.1471-4159.1994.63062179.x. [DOI] [PubMed] [Google Scholar]
- Padovani A, Borroni B, Colciaghi F, Pettenati C, Cottini E, Agosti C, Lenzi GL, Caltagirone C, Trabucchi M, Cattabeni F, Di Luca M. Abnormalities in the pattern of platelet amyloid precursor protein forms in patients with mild cognitive impairment and Alzheimer disease. Arch Neurol. 2002;59:71–75. doi: 10.1001/archneur.59.1.71. [DOI] [PubMed] [Google Scholar]
- Parker WD, Jr, Filley CM, Parks JK. Cytochrome oxidase deficiency in Alzheimer’s disease. Neurology. 1990;40:1302–1303. doi: 10.1212/wnl.40.8.1302. [DOI] [PubMed] [Google Scholar]
- Parker WD, Jr, Mahr NJ, Filley CM, Parks JK, Hughes MA, Young DA, Cullum CM. Reduced platelet cytochrome c oxidase activity in Alzheimer’s disease. Neurology. 1994a;44:1086–1090. doi: 10.1212/wnl.44.6.1086. [DOI] [PubMed] [Google Scholar]
- Parker WD, Jr, Parks J, Filley CM, Kleinschmidt-DeMasters BK. Electron transport chain defects in Alzheimer’s disease brain. Neurology. 1994b;44:1090–1096. doi: 10.1212/wnl.44.6.1090. [DOI] [PubMed] [Google Scholar]
- Parker WD, Jr, Parks JK. Cytochrome c oxidase in Alzheimer’s disease brain: purification and characterization. Neurology. 1995;45:482–486. doi: 10.1212/wnl.45.3.482. [DOI] [PubMed] [Google Scholar]
- Petersen RC, Smith GE, Waring SC, Ivnik RJ, Tangalos EG, Kokmen E. Mild cognitive impairment: clinical characterization and outcome. Arch Neurol. 1999;56:303–308. doi: 10.1001/archneur.56.3.303. [DOI] [PubMed] [Google Scholar]
- Reddy PH, McWeeney S, Park BS, Manczak M, Gutala RV, Partovi D, Jung Y, Yau V, Searles R, Mori M, Quinn J. Gene expression profiles of transcripts in amyloid precursor protein transgenic mice: up-regulation of mitochondrial metabolism and apoptotic genes is an early cellular change in Alzheimer’s disease. Hum Mol Genet. 2004;13:1225–1240. doi: 10.1093/hmg/ddh140. [DOI] [PubMed] [Google Scholar]
- Reiman EM, Caselli RJ, Yun LS, Chen K, Bandy D, Minoshima S, Thibodeau SN, Osborne D. Preclinical evidence of Alzheimer’s disease in persons homozygous for the epsilon 4 allele for apolipoprotein E. New England J Med. 1996;334:752–758. doi: 10.1056/NEJM199603213341202. [DOI] [PubMed] [Google Scholar]
- Reiman EM, Uecker A, Gonzalez-Lima F, Minear D, Chen K, Callaway NL, Berndt JD, Games D. Tracking Alzheimer’s disease in transgenic mice using fluorodeoxyglucose autoradiography. Neuroreport. 2000;11:987–991. doi: 10.1097/00001756-200004070-00018. [DOI] [PubMed] [Google Scholar]
- Reiman EM, Caselli RJ, Chen K, Alexander GE, Bandy D, Frost J. Declining brain activity in cognitively normal apolipoprotein E varepsilon 4 heterozygotes: A foundation for using positron emission tomography to efficiently test treatments to prevent Alzheimer’s disease. Proc Natl Acad Sci U S A. 2001;98:3334–3339. doi: 10.1073/pnas.061509598. [DOI] [PMC free article] [PubMed] [Google Scholar]
- Reiman EM, Chen K, Alexander GE, Caselli RJ, Bandy D, Osborne D, Saunders AM, Hardy J. Functional brain abnormalities in young adults at genetic risk for late-onset Alzheimer’s dementia. Proc Natl Acad Sci U S A. 2004;101:284–289. doi: 10.1073/pnas.2635903100. [DOI] [PMC free article] [PubMed] [Google Scholar]
- Reiman EM, Chen K, Alexander GE, Caselli RJ, Bandy D, Osborne D, Saunders AM, Hardy J. Correlations between apolipoprotein E epsilon4 gene dose and brain-imaging measurements of regional hypometabolism. Proc Natl Acad Sci U S A. 2005;102:8299–8302. doi: 10.1073/pnas.0500579102. [DOI] [PMC free article] [PubMed] [Google Scholar]
- Sergeant N, Wattez A, Galvan-Valencia M, Ghestem A, David JP, Lemoine J, Sautire PE, Dachary J, Mazat JP, Michalski JC. Association of ATP synthase [alpha]-chain with neurofibrillary degeneration in Alzheimer’s disease. Neuroscience. 2003;117:293–303. doi: 10.1016/s0306-4522(02)00747-9. [DOI] [PubMed] [Google Scholar]
- Sheehan JP, Swerdlow RH, Miller SW, Davis RE, Parks JK, Parker WD, Tuttle JB. Calcium homeostasis and reactive oxygen species production in cells transformed by mitochondria from individuals with sporadic Alzheimer’s disease. J Neurosci. 1997;17:4612–4622. doi: 10.1523/JNEUROSCI.17-12-04612.1997. [DOI] [PMC free article] [PubMed] [Google Scholar]
- Strazielle C, Sturchler-Pierrat C, Staufenbiel M, Lalonde R. Regional brain cytochrome oxidase activity in [beta]-amyloid precursor protein transgenic mice with the swedish mutation. Neuroscience. 2003;118:1151–1163. doi: 10.1016/s0306-4522(03)00037-x. [DOI] [PubMed] [Google Scholar]
- Swerdlow RH, Parks JK, Cassarino DS, Maguire DJ, Maguire RS, Bennett JP, Jr, Davis RE, Parker WD., Jr Cybrids in Alzheimer’s disease: a cellular model of the disease? Neurology. 1997;49:918–925. doi: 10.1212/wnl.49.4.918. [DOI] [PubMed] [Google Scholar]
- Trimmer PA, Swerdlow RH, Parks JK, Keeney P, Bennett JP, Jr, Miller SW, Davis RE, Parker WD., Jr Abnormal mitochondrial morphology in sporadic Parkinson’s and Alzheimer’s disease cybrid cell lines. Exp Neurol. 2000;162:37–50. doi: 10.1006/exnr.2000.7333. [DOI] [PubMed] [Google Scholar]
- Trimmer PA, Keeney PM, Borland MK, Simon FA, Almeida J, Swerdlow RH, Parks JP, Parker J, Bennett J. Mitochondrial abnormalities in cybrid cell models of sporadic Alzheimer’s disease worsen with passage in culture. Neurobiol Dis. 2004;15:29–39. doi: 10.1016/j.nbd.2003.09.011. [DOI] [PubMed] [Google Scholar]
- Valla J, Berndt JD, Gonzalez-Lima F. Energy hypometabolism in posterior cingulate cortex of Alzheimer’s patients: superficial laminar cytochrome oxidase associated with disease duration. J Neurosci. 2001;21:4923–4930. doi: 10.1523/JNEUROSCI.21-13-04923.2001. [DOI] [PMC free article] [PubMed] [Google Scholar]
- Valla J, Schneider LE, Reiman EM. Age and transgene-related changes in regional cerebral metabolism in PSAPP mice. Brain Res. 2006 doi: 10.1016/j.brainres.2006.07.097. in press. [DOI] [PMC free article] [PubMed] [Google Scholar]
- Velliquette RA, O’Connor T, Vassar R. Energy inhibition elevates beta-secretase levels and activity and is potentially amyloidogenic in APP transgenic mice: possible early events in Alzheimer’s disease pathogenesis. J Neurosci. 2005;25:10874–10883. doi: 10.1523/JNEUROSCI.2350-05.2005. [DOI] [PMC free article] [PubMed] [Google Scholar]