


Abstract
The covalent addition of methylgroups to cytosine has become the most intensively researched epigenetic DNA marker. The vast majority of technologies used for DNA methylation analysis rely on a chemical reaction, the so-called ‘bisulfite treatment’, which introduces methylation-dependent sequence changes through selective chemical conversion of non-methylated cytosine to uracil. After treatment, all non-methylated cytosine bases are converted to uracil but all methylated cytosine bases remain cytosine. These methylation dependent C-to-T changes can subsequently be studied using conventional DNA analysis technologies.
The bisulfite conversion protocol is susceptible to processing errors, and small deviation from the protocol can result in failure of the treatment. Several attempts have been made to simplify the procedure and increase its robustness. Although significant achievements in this area have been made, bisulfite treatment remains the main source of process variability in the analysis of DNA methylation. This variability in particular impairs assays, which strive for the quantitative assessment of DNA methylation. Here we present basic mathematical considerations, which should be taken into account when analyzing DNA methylation. We also introduce a PCR-based assay, which allows ab initio assessment of the DNA quality after bisulfite treatment and can help to prevent inaccurate quantitative measurement resulting from poor bisulfite treatment.
INTRODUCTION
Several bisulfite treatment protocols are available, and most of them include mixing genomic DNA in a solution containing 6 M urea and 2 M sodium meta-bisulfite. The reaction is then incubated at pH 5.0 and 50°C for 5–16 h. This chemical treatment introduces various DNA strand breaks and results in highly fragmented single-stranded DNA. Depurination has been identified as the main cause of DNA fragmentation during bisulfite treatment (1). It has been shown that degradation of DNA affects between 84–96% of the DNA (2). Various attempts have been made to optimize bisulfite treatment by balancing competing goals of maintaining complete cytosine conversion and minimal DNA fragmentation (1–4). Aggressive bisulfite treatment protocols (long incubation, high temperatures, high molarity of bisulfite) assure complete conversion of cytosine to uracil, but the genomic DNA can be degraded to a degree that renders PCR amplification impossible. Less aggressive treatments on the other hand carry the risk of overestimating methylation levels due to detection of non-converted cytosine.
High levels of DNA degradation decrease the number of DNA molecules, which are effectively available for PCR amplification. Hence, common PCR amplification strategies rely on using large amounts of bisulfite-treated DNA. Different amplification protocols recommend the use of 50–500 ng of bisulfite-treated DNA (2). These strategies are not feasible for most research based on human samples, because DNA quantity usually is limited. In order to maximize the number of tests that can be run from one sample, it is desirable to minimize the amount of DNA used per test. Recently, new assay formats and miniaturization has enabled routine amplification from as little as 10 ng bisulfite-treated DNA (5,6). Ten nanograms of DNA equal approximately 6600 copies of genomic DNA. With more than 90% DNA degradation during bisulfite treatment, only relatively few molecules are left for PCR amplification. The number of available molecules is also influenced by the length of the target amplicon. Longer amplicons are less likely to amplify, simply because the likelihood to find a single intact starting template decreases. This fact requires special attention if the analysis of DNA methylation is not restricted to a binary yes/no answer, but is required to provide quantitative results. When only few molecules are used as starting template statistical effects during the sampling procedure can have a dramatic effect on the quantitative result. Given this consideration it is apparent that a procedure for assessment of DNA quality in advance will dramatically help planning and interpreting quantitative methylation experiments.
Methods that allow a quality evaluation of bisulfite-treated DNA are HPLC or gel-based assays. These assays need vast amounts of DNA and consume most of the product yielded by a single bisulfite conversion reaction. To overcome current limitations, we developed a new assay for quality control that can be performed with as little as 30 ng of bisulfite-treated DNA.
The assay concept is based on the idea that random DNA fragmentation reduces the number of available molecules for PCR amplification, especially with increasing amplicon length. This random fragmentation has two main effects. When no intact DNA fragments are available for the targeted amplification region, the PCR reaction will obviously fail. Second, when the number of available molecules is drastically reduced, to only a few available molecules due to DNA fragmentation, the results become similar to digital PCR (7). They are no longer quantitative and show large variability when measured repeatedly. The approach presented here takes both of these effects into account. We designed amplicons of increasing length for a genomic region with known methylation levels. Then we measured the amplification success and variance in the quantitative results. To enable measurement of quantitation variance, a method with high quantitation precision and low process variability is needed. We recently introduced a new method for the quantitative analysis of DNA methylation, which fulfills these requirements (6). The method uses base-specific cleavage of single-stranded nucleic acids coupled with MALDI-TOF MS detection. The assay allows quantitative analysis of all CpG sites within a given target region and is only limited in length by PCR success.
METHODS
Bisulfite treatment
Bisulfite treatment of genomic DNA was performed with a commercial kit from Zymo Research Corporation (Orange, CA) that combines bisulfite conversion and DNA clean up. The kit follows a protocol from Paulin et al. (1998) (4). Briefly, in this protocol 2 μg of genomic DNA is denatured by the addition of 3 M sodium hydroxide and incubated for 15 min at 37°C. A 6.24 M urea/2 M sodium meta-bisulfite (4 M bisulfite) solution is prepared and added with 10 mM hydroquinone to the denatured DNA. The corresponding final concentrations are 5.36 M, 3.44 M and 0.5 mM respectively. This reaction mix is repeatedly heated between 55°C for 15 min and 95°C for 30 s in a PCR machine (MJ Tetrad) for 20 cycles. Finally a DNA purification and cleaning step is performed.
Gel-based fragmentation analysis
Two micrograms of DNA was bisulfite-treated using the EZ DNA Methylation kit (Zymo Research, Orange, CA) and eluted in 10 µl water. Ten microliters of the bisulfite-treated DNA was loaded along with 5 µl of loading dye on a 4–8% TBE PAGE pre-cast gel (Jule Inc., Milford, CT). Ten microliters of 100 bp ladder (Roche Applied Science, Indianapolis, IN) was loaded alongside the DNA samples. Electrophoresis was performed using Novex Mini-Cell (Invitrogen, Carlsbad, CA) at 170 V for 50 min. Prior to fluorescence detection, the gel was stained using SYBR Gold gel stain (Invitrogen, Carlsbad, CA) for 30 min on an agitator. Fluorescence detection was performed using the TYPHOON 8600 (GE Healthcare, Piscataway, NJ) and densitometry measurements were calculated using the supplied Image Quant Software.
PCR and in vitro transcription
The target regions were amplified using the primer pairs described in Supplement Table 1. The PCR reactions were carried out in a total volume of 5 μl using 1 pmol of each primer, 40 μM dNTP, 0.1 U Hot Star Taq DNA polymerase (Qiagen), 1.5 mM MgCl2 and buffer supplied with the enzyme (final concentration 1x). The reaction mix was pre-activated for 15 min at 95°C. The reactions were amplified in 45 cycles at 95°C for 20 s, 62°C for 30 s and 72°C for 30 s followed by 72°C for 3 min. Unincorporated dNTPs were dephosphorylated by adding 1.7 μl H2O and 0.3 U Shrimp Alkaline Phosphatase (SEQUENOM, San Diego). The reaction was incubated at 37°C for 20 min and SAP was then heat-inactivated for 10 min at 85°C.
Typically, two microliters of the PCR reaction were directly used as template in a 6.5 μl transcription reaction. Twenty units of T7 R&DNA polymerase (Epicentre, Madison, WI) were used to incorporate either dCTP or dTTP in the transcripts. Ribonucleotides were used at 1 mM and the dNTP substrate at 2.5 mM; other components in the reaction were as recommended by the supplier. In the same step of the in vitro transcription RNase A (SEQUENOM, San Diego) was added to cleave the in vitro transcript. The mixture was then further diluted with H2O to a final volume of 27 μl. Conditioning of the phosphate backbone prior to MALDI-TOF MS was achieved by the addition of 6 mg CLEAN Resin (SEQUENOM Inc., San Diego, CA). Further experimental details have been described elsewhere (8).
Mass spectrometry measurements
Fifteen nanoliters of the cleavage reactions were robotically dispensed onto silicon chips preloaded with matrix (SpectroCHIP®; SEQUENOM Inc., San Diego, CA). Mass spectra were collected using a MassARRAY mass spectrometer (Bruker–SEQUENOM). Spectra were analyzed using proprietary peak picking and spectra interpretation tools.
Statistical analysis
All statistical simulations and calculations were carried out using the ‘R’ software package for statistical computing (9). For the calculation of 95% confidence intervals of the binomial distribution we used the ‘binconf ’ function, which is part of the Hmisc package.
RESULTS
The main idea of this study is to evaluate the hypothesis that the number of template DNA molecules, which are available for PCR amplification, are a determining factor not only for the success of the reaction but, more importantly, for determining the precision of quantitative applications.
To evaluate the effect of DNA degradation on the quantitative and qualitative analysis of DNA methylation, we first characterized the fragmentation pattern of bisulfite-treated DNA. Next, we looked into the relationship between available template molecules and variation of methylation ratios caused by sampling error. Based on these considerations we evaluated the feasibility of a quality control assay that can be used to predict DNA quality and verify its applicability for the intended experiments. Finally we compared the experimental data with the statistical models used for the evaluation of sampling error.
In this study, all calculations are based on the DNA amounts used in our current amplification protocol. We used 1 μg of genomic DNA for bisulfite treatment and eluted the treated DNA in 100 μl H2O. Then 1 μl of this elution is used in each PCR. This amount roughly equals 6000 DNA copies (10 ng DNA ≈ 6600) and denotes the maximum number of molecules available for amplification assuming that no DNA degradation occurs. Unfortunately, DNA degradation is likely to occur and hence the number of available molecules can range between zero (complete degradation) and ∼6000 (no degradation).
Stability of the method
A prerequisite for the reliable measurement of the variance of quantitative methylation analysis is a stable method of detection that does not introduce any variability itself. To evaluate the variability of our method, we dissected the entire process into four steps and analyzed process-specific variability for each step. One DNA was used in 16 replicated bisulfite treatments. Then an aliquot of each bisulfite treatment was pooled together and used for 16 individual PCR reactions. Again an aliquot from those PCR reactions was pooled and used for 16 individual base-specific cleavage reactions. Finally aliquots of the cleavage reactions were pooled and dispensed on 16 elements of a miniaturized array of matrix spots. Figure 1 illustrates the process specific variability in a box plot. The results for each of the four tested conditions are summarized in an individual box plot. The analysis of all steps reveals that process variability of the base-specific cleavage reaction and the instrument measurements are minimal compared to PCR and especially bisulfite treatment (Figure 1).
Figure 1.

Box plot graphic depicting the variability of repeated measurements for each step in the process (Step 1: bisulphite treatment; Step 2: PCR; Step 3: MassCLEAVE; Step 4: MALDI-TOF MS analysis). Boxes are centered on the median and range from the lower to the upper quartile. Whiskers indicate the interquartile range. Red whiskers indicate the standard deviation from the mean. Bisulfite treatment and PCR can be identified as the greatest source of process variability. The post-PCR processing (MassCLEAVE) and, in particular, the MALDI analysis show high precision in repeated measurements.
Simulation
To evaluate theoretical limitations of quantitative methylation analysis we applied the following assumptions to the model system.
Let N be the number of DNA molecules available for PCR amplification in the reaction. Suppose they have been drawn randomly and independently from the whole population of DNA molecules. Let p be the proportion of molecules in the whole population which are methylated. The number of methylated molecules in the reaction is a random variable X which follows a binomial distribution with parameters N and p. If Np and N(1 − p) are both large enough, then X is approximately normally distributed with expected value Np and variance Np(1 − p) with the appropriate continuity correction.
Consequently the probability of observing a methylation ratio in an interval is the cumulative probability from the lower limit to the upper limit.
Figure 2A shows the cumulative probability for two scenarios at 1% interval. The red bars are based on the assumption that 3000 molecules (50% degradation) are available for amplification. The blue bars are calculations for 300 available molecules (95% degradation). We calculated five scenarios of different methylation ratios in the starting template between 10 and 90% (10, 25, 50, 75 and 90%). As expected the probability distribution maximizes around the population mean. We were also interested in which range most (95%) of the values for each methylation ratio would be located. The graph reveals that for 50% methylation most values are located between 48 and 52% when starting with 6000 molecules. The range is dramatically larger with only 300 molecules and ranges from 43 to 57% methylation. To evaluate the relationship between methylation range and number of available DNA molecules, we calculated the 95% confidence interval for the binomial distribution as a function of available fragments for three different scenarios (10, 25 and 50% methylation) (Figure 2B). The figure illustrates the strong correlation with the number of available fragments and indicates the dramatically increasing range of methylation ratios when the number of available fragments falls below 100–200.
Figure 2.

Panel (A) shows the probability distributions for observed methylation ratios based on the binomial distribution and different amounts of starting molecules. Shown are examples for 10, 25, 50 75 and 90% methylated molecules in the starting template. With a sample size of 3000 molecules, 95% of all randomly sampled probes will contain between 48 and 52% methylated DNA when the DNA sample contains 50% methylated DNA (red colored distribution). However, when the DNA sample contains only 300 molecules, this range is expanded from 43 to 57% (blue colored distribution). Panel (B) shows the 95% confidence intervals for sampling-means as a function of the number of the sampled molecules. Shown are results for 10 (blue), 25 (red) and 50% (black) methylated molecules in the starting template.
Gel-based assessment of DNA fragmentation
To estimate the level of DNA fragmentation we performed a densitometry-based analysis of original genomic DNA and DNA treated with three different bisulfite conversion protocols (A—incubation at 50°C; B—incubation at 65°C; C—incubation at 80°C for 16 h). To achieve the necessary sensitivity we used 2 μg bisulfite-treated DNA on a 4–8% gradient PAGE gel, and stained with SYBR GOLD (Figure 3) (10). We also performed a densitometry calculation for the DNA size intervals of 100 bp. The interval for fragments below 100 bp could not be calculated accurately, because fragments below 75 bp are lost during the DNA cleanup.
Figure 3.

Gradient PAGE gel with CYBR Gold staining showing the DNA fragmentation of untreated genomic DNA (left) and after bisulfite treatment at varying temperatures (from left to right: 50, 70 and 80°C). The figure indicates that an increase of the incubation temperature during bisulfite treatment results in increased DNA fragmentation.
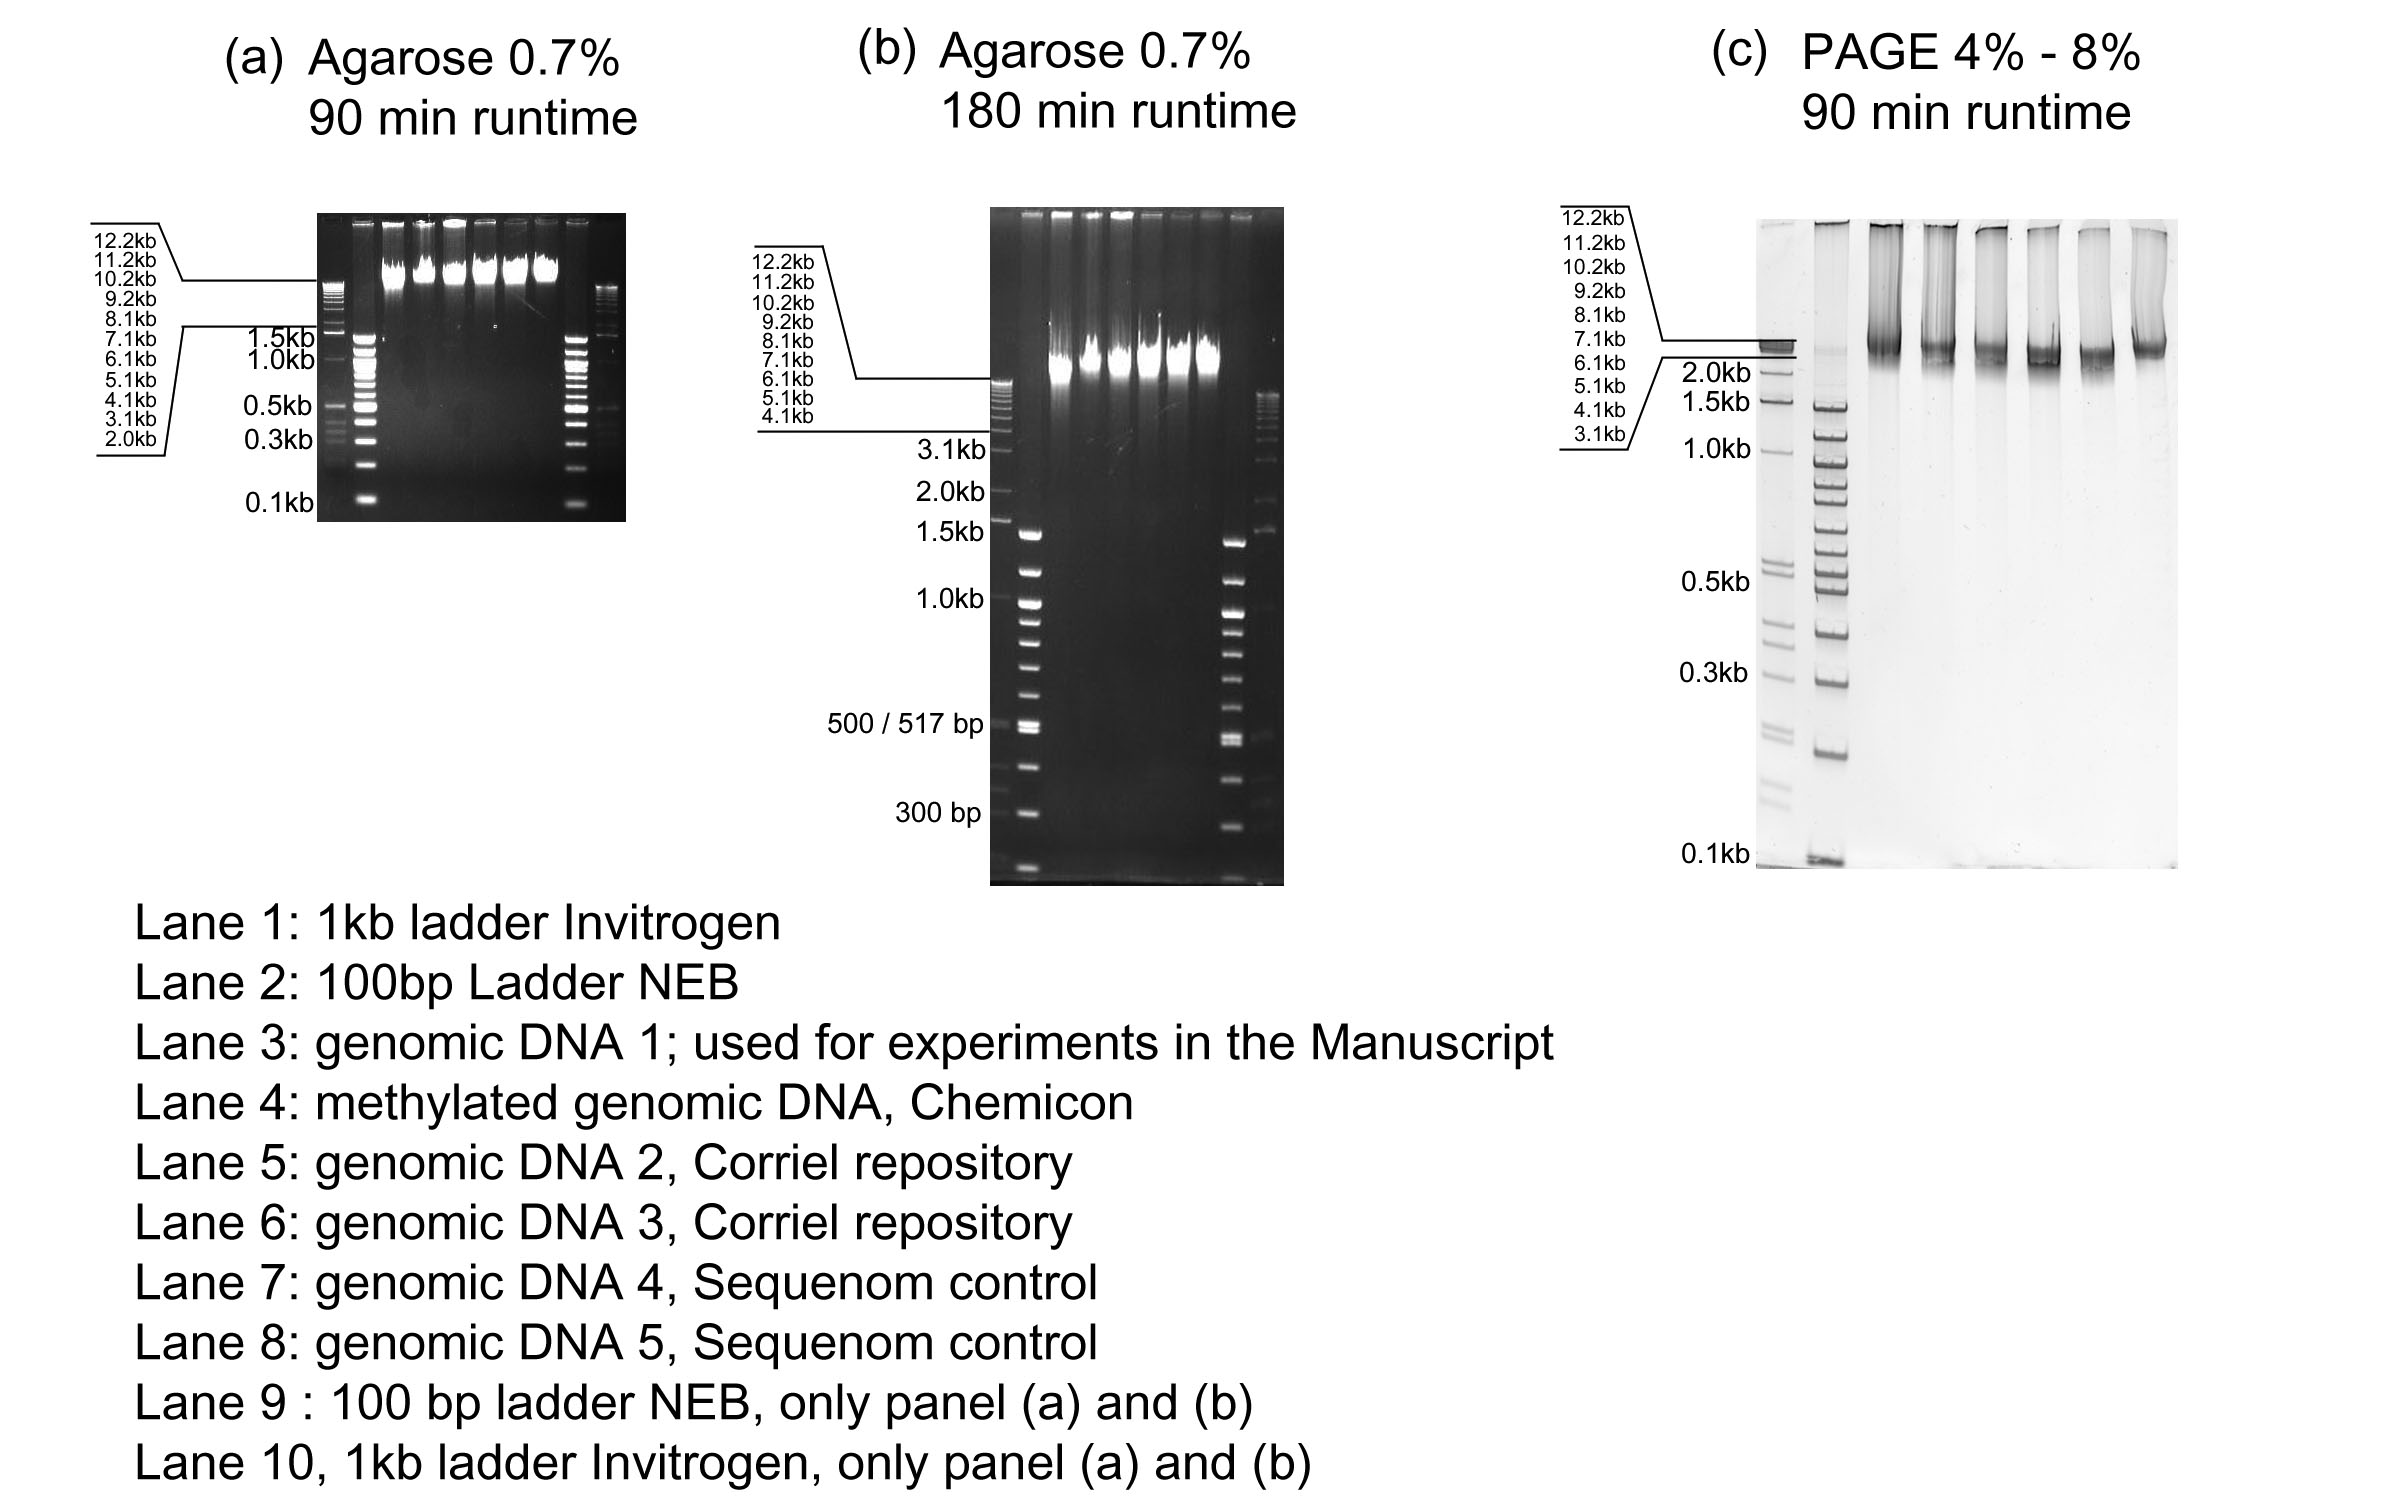
For each of the four conditions 2 μg of DNA were transferred onto the gel. The fragmented portions of the genomic DNA appear as a high intensity band around 2600 bp, while the high molecular weight genomic DNA is unable to enter the gel (supplementary Figure 1).
During bisulfite treatment, the genomic DNA is degraded, which results in a loss of the high intensity band at 2600 bp and additional fragmentation of the previously unfragmented DNA. Consequently the signal intensities are distributed over a larger area and no single high intensity band is observed. The three different bisulfite protocols show varying fragment sizes. The resulting distribution of signal intensities is variable depending on the degradation levels. The largest fraction of DNA fragments is found to be >1500 bp in length for condition A and around 200 bp in length for condition C. These results confirm that higher incubation temperatures introduce higher levels of DNA fragmentation.
With depurination being the most likely cause for DNA fragmentation the position of strand breaks can be assumed to be random. Thus higher DNA fragmentation is more likely to disrupt the desired amplification region and hence eliminate its availability for PCR amplification. This also has implications for the targeted amplicon length. When long amplicons are desired it is more likely that a strand break will occur in-between the primer binding sites and consequently less molecules are available for amplification. Shorter target regions are less likely to have strand breaks and therefore are more likely to be successfully amplified. Hence, short amplicons and low fragmentation increase the probability of amplification success.
Consequently we can use an assay that utilizes amplicons of different length to estimate DNA fragmentation levels. In particular a more accurate result can be given when employing a quantitative assay, because it can utilize information about measurement variance, rather than being limited to a binary yes/no answer.
QC assay
To evaluate the feasibility of variable length amplicons to predict quality of bisulfite-treated DNA, we selected the IGF2/H19 region as the amplification target. Amplicon design should ideally cover the region with multiple amplicons increasing in length by small increments. Unfortunately, flexibility in primer design is constrained by genomic DNA features. The primer binding sites have to be free of any CpG sites and each amplicon should be almost entirely covered by the next longer amplicon. We also required identical hybridization behavior of the different primer sets to enable simultaneous amplification in a single microtiter plate. For the IGF2 region we were able to design 6 amplicons, which were 176, 362, 477, 617, 795 and 960 bp in length (Figure 4A). In the following we will refer to this assay set as control assays.
Figure 4.

Panel (A) shows a schematic representation of the different PCR amplicons and their genomic context on chromosome 11. All PCR amplicons share a subset of CpG sites (indicated as red stripes), which were used for comparison of methylation ratios. Panel (B) shows an agarose gel for the six amplification products of the IGF2 region. Shown are PCR results for the six amplicons shown in panel (A) for four different bisulfite treatment incubation temperatures. The gel picture confirms that increasing incubation temperatures during bisulfite treatment lead to a decrease in the obtainable amplification length.
All amplicons were tested in 16 repeats on DNA treated with a single standard bisulfite conversion protocol. We were able to obtain consistent amplification for 176, 362, 477, 617, and sporadic amplification for 765. The longest amplicon failed to give any amplification results. This can either be attributed to bad primer design or to the fact that the bisulfite-treated DNA does not provide enough intact copies for PCR amplification. Consequently, we focused on the first four amplicons (176, 362, 477 and 617 bp) for the quality control assay.
As a next step we induced increased fragmentation of DNA by increasing incubation temperatures (50, 65, 80, 95°C) during bisulfite treatment (Figure 4B).
We then applied the quality control assay to evaluate its ability to asses DNA quality. For each condition bisulfite treatment was done in triplicate and from each bisulfite-treated DNA we performed duplicate PCR reactions. To compare the quantitative results we selected 3 CpG sites which were enclosed in all amplicons. We analyzed the generated mass spectra with regards to spectrum quality and relative methylation for the selected three CpG sites. In this setup 18 quantitative measurements were obtained for each condition. We summed the number of good quality measurements (defined in the Method section) as a first marker for amplification success and obtained mean methylation levels and standard deviation as a marker for sample bias.
The results show that incubation at 50 and 65°C for 16 h yielded comparable results. Both show complete good quality measurements up to an amplicon length of 477 bp and a decrease in good quality measurements for the 617 bp amplicon. Standard deviation of repeated measurements in both cases is around 5% and therefore within instrument limitation. Incubation at 80°C shows reduced quality beginning at 362 bp and incubation at 95°C, results in less than 50% good quality at 176 bp. For 80 and 95°C, the obtained standard deviation of methylation ratios are well above the expected 5% (from 40 to 45%). When the individual values are closely examined we see that methylation in these cases varies between 0 and 100% (Figure 5). This behavior is predicted by the simulations for very low numbers of available molecules. In the extreme case we can assume that only one molecule is available for amplification. This one molecule is then either methylated or non-methylated and therefore results in large differences in observed methylation ratios. The incubation at 80°C exemplifies why measuring variance provides valuable information above the sole success rates. In this case 15 out of 18 measurements were of good quality suggesting that DNA quality is sufficient for the analysis of DNA methylation. However, the quantitative analysis reveals an amplification behavior similar to digital PCR (7). The observed methylation ratios cannot be measured reproducibly and therefore show high variance.
Figure 5.

Bar graphs showing the number of high quality mass spectra for each amplicon length (two panels on the left). The panels on the right side show the corresponding standard deviations of the quantitative measurements. The bar graphs show results for different bisulfite incubation protocols. The results from 16 h incubation at constant temperature are shown in the upper two panels and results from a cycled incubation protocol are shown in the lower two panels. A total of 18 reactions were performed for each amplicon. Cycled incubation and lower incubation temperatures result in higher amplification success for longer amplicons and lower standard deviations on the determination of methylation ratios.
In the next step we evaluated a second incubation protocol. Instead of incubation for 16 h at a constant temperature, the temperature is cycled between the incubation temperature and a brief 95°C denaturation step. The protocol comprises 20 cycles of 15 min at incubation temperature and 30 s at 95°C resulting in a total incubation time of 5½ h (Figure 5C and D).
The data was analyzed according to the scheme described above. Incubation at 50 and 65°C results in stable measurements up to 477 bp amplicon length, which is comparable to constant 16 h incubation. For 80°C cycled incubation amplicons of length 176 and 362 bp are of acceptable quality in contrast to the first 80°C protocol where large variance was observed even in the short amplicons.
Incomplete bisulfite conversion was not observed under any of the used bisulfite treatment incubation protocols.
The results suggest that cycled incubation can improve the quality of bisulfite-treated DNA. The results further indicate the assay to be a good marker for DNA quality.
Extrapolation to multiple amplicons
In the next step we wanted to evaluate if results from this limited region can be generalized to the remaining genomic regions. We used a total of 39 amplicons from different regions in the genome with varying amplification lengths from 200 to 650 bp. Having demonstrated the general feasibility of using increasing temperatures to create differentially fragmented DNA we used three instead of four temperatures for the fragmentation of DNA (A—50°C 16 h; B—70°C 16 h; C—90°C 16 h). Each bisulfite treatment was done in triplicate. Each sample was evaluated with our quality control assay and across all samples. Finally, the results were correlated to evaluate their concordance. In order to compare different length amplicons with different number of measurable CpG site we analyzed the amplification success of each amplicon by calculating the ratio of successful quantitative CpG measurements to all possible CpG measurements.
The quality control assay predicts good quality amplification up to 600 bp for condition A. Condition B shows successful amplification at 477 bp, but with an increased methylation variance suggesting that this amplification length is borderline. For condition C amplification success is dramatically reduced at 176 bp suggesting impaired amplification of the shortest targets in the test set (Figure 6A and B).
Figure 6.

Correlation between the results obtained from the quality control assays and PCR success from additional genomic targets of varying length. The bar graphs in panel (A) and (B) show the results from the quality control assays similar to Figure 5. The QC assay indicates that incubation at 90°C limits amplification to only short amplicons (<300 bp), whereas incubation at 70°C results in decreased amplification success for amplicons around 500 bp in length. Panel (C) and (D) show results for further 39 PCR amplicons of different genomic regions ranging in length from 200 to 700 bp. Panel (c) shows the percentage of successful quantitative measurements in relationship to the amplicon length. Panel (D) shows a gel picture of the PCR results. Both confirm the results predicted from the use of the QC assay (panel a and b).
The results from the amplification of 39 selected target regions confirm the prediction of the quality control assay. Condition A shows good amplification results throughout the entire range of amplicon lengths. For condition B quality results start declining around 450–500 bp and condition C exhibits reduced quality from the shortest amplicons around 250 bp (Figure 6C and D).
These results verify the ability of the presented quality control assay to predict the quality of bisulfite-treated DNA and to estimate the chances for amplification success.
DISCUSSION
Most methods for the analysis of DNA methylation are based on bisulfite treatment of genomic DNA. The success of all methods have to rely on the quality of the DNA after bisulfite treatment. Despite large interest in DNA methylation no method for assessing the quality of bisulfite-treated DNA has been shown to be generally applicable. Gel-based methods require around 2 μg of DNA. UV or fluorescence-based methods allow for quantification, but do not yield information about DNA fragmentation. Here we present a new approach for quality control of bisulfite-treated DNA. The assay comprises four amplicons of increasing length which are located in the IGF2/H19 region. It combines measuring the amplification success with calculating the variance of methylation ratios to give a realistic estimate of DNA quality.
We suggest practical implementation of the assay in a stepwise fashion. First, the control amplicon closest to the maximum length of the desired study amplicons is evaluated in triplicate. If the quality is good the study can be performed, otherwise the remaining shorter amplicons should be tested to evaluate the length limitations for this bisulfite-treated DNA. Conclusively, either a subset of the study amplicons can be run, or the bisulfite treatment needs to be repeated. This approach requires 30–120 ng of DNA, depending on the desired information level. Using a bisulfite protocol, which uses 1 μg DNA, enough bisulfite-treated DNA is left for 88 to 97 PCR reactions.
In this study we used different incubation temperatures during bisulfite treatment to generate differently fragmented DNAs in a controlled environment. These increasing fragmentation levels are used to demonstrate the feasibility of our model to determine DNA quality and predict amplification success. However, most bisulfite assays today are run at 50°C and the relevance of the model can be questioned. In fact, temperature is only one of the many aspects that influence DNA quality. In general the bisulfite treatment procedure has always been a source of great variability. Each of the reaction parameters like quality of the template DNA, pH, incubation time and temperature, the concentration of urea or hydroquinone can critically influence DNA quality during the reaction. Most laboratories have either home-brew protocols, which have evolved over years or rely on commercially available kits. Our laboratory greatly benefited from the availability of commercial kits, but we still see occasional assay failures.
We showed that the number of molecules available for PCR amplification is critical for accurate characterization of methylation ratios. This number of available template molecules is determined by the amount of genomic DNA, fragmentation level of bisulfite-treated DNA and amplicon length. When few molecules are present, the reaction can still be performed successfully, but the sampling error has a devastating effect on the confidence level of the quantitative results. Hence, it is important to know in advance which amplicon lengths can be accurately analyzed, highlighting the importance of quality control. Our assays use only 30–120 ng of the bisulfite-treated DNA and allow using the remaining DNA in quantitative studies.
We think the assay will be of special interest for three applications: (1) The QC assay is used to estimate the quality of sample DNA after bisulfite treatment. In a study where the desired amplicon lengths are known, the assay can indicate whether or not these amplicon can be analyzed. (2) Improve bisulfite treatment procedures. In the presented work we found shorter cycled incubation superior to long continuous incubation. Many other parameters of the bisulfite treatment can be optimized further, for example, using a design of experiment (DOE) approach, to assure best possible DNA quality. (3) When standardized bisulfite procedures are already implemented and their performance characteristics are known, this assay can be used to help researchers achieve uniform quality standards. It is noteworthy that the described assay can also be implemented on platforms other than MALDI TOF MS (e.g. Pyrosequencing), as long as the precision in quantitative measurement is sufficient.
We feel the implementation of the presented quality control assay will greatly assist in developing new and more robust bisulfite conversion protocols and help to better understand quantitative DNA methylation results.
SUPPLEMENTARY DATA
Supplementary Data are available at NAR online.
ACKNOWLEDGEMENTS
Funding to pay the Open Access publication charge was provided by SEQUENOM, Inc..
Conflict of interest statement. M.E., S.Z., S.S. and D.v.d.B. are stockholders of SEQUENOM. M.E., S.S. and D.v.d.B. are employees of Sequenom.
REFERENCES
- 1.Raizis AM, Schmitt F, Jost JP. A bisulfite method of 5-methylcytosine mapping that minimizes template degradation. Anal. Biochem. 1995;226:161–166. doi: 10.1006/abio.1995.1204. [DOI] [PubMed] [Google Scholar]
- 2.Grunau C, Clark SJ, Rosenthal A. Bisulfite genomic sequencing: systematic investigation of critical experimental parameters. Nucleic Acids Res. 2001;29:E65–65. doi: 10.1093/nar/29.13.e65. [DOI] [PMC free article] [PubMed] [Google Scholar]
- 3.Olek A, Oswald J, Walter J. A modified and improved method for bisulphite based cytosine methylation analysis. Nucleic Acids Res. 1996;24:5064–5066. doi: 10.1093/nar/24.24.5064. [DOI] [PMC free article] [PubMed] [Google Scholar]
- 4.Paulin R, Grigg GW, Davey MW, Piper AA. Urea improves efficiency of bisulphite-mediated sequencing of 5′-methylcytosine in genomic DNA. Nucleic Acids Res. 1998;26:5009–5010. doi: 10.1093/nar/26.21.5009. [DOI] [PMC free article] [PubMed] [Google Scholar]
- 5.Colella S, Shen L, Baggerly KA, Issa JP, Krahe R. Sensitive and quantitative universal Pyrosequencing methylation analysis of CpG sites. Biotechniques. 2003;35:146–150. doi: 10.2144/03351md01. [DOI] [PubMed] [Google Scholar]
- 6.Ehrich M, Nelson MR, Stanssens P, Zabeau M, Liloglou T, Xinarianos G, Cantor CR, Field JK, van den Boom D. Quantitative high-throughput analysis of DNA methylation patterns by base-specific cleavage and mass spectrometry. Proc. Natl. Acad. Sci. U.S.A. 2005;102:15785–15790. doi: 10.1073/pnas.0507816102. [DOI] [PMC free article] [PubMed] [Google Scholar]
- 7.Vogelstein B, Kinzler KW. Digital PCR. Proc. Natl. Acad. Sci. U.S.A. 1999;96:9236–9241. doi: 10.1073/pnas.96.16.9236. [DOI] [PMC free article] [PubMed] [Google Scholar]
- 8.Hartmer R, Storm N, Boecker S, Rodi CP, Hillenkamp F, Jurinke C, van den Boom D. RNase T1 mediated base-specific cleavage and MALDI-TOF MS for high-throughput comparative sequence analysis. Nucleic Acids Res. 2003;31:e47. doi: 10.1093/nar/gng047. [DOI] [PMC free article] [PubMed] [Google Scholar]
- 9.R Development Core Team. Vienna, Austria: R Foundation for Statistical Computing; 2003. R: A language and environment for statistical computing. http://www.R-project.org. [Google Scholar]
- 10.Tuma RS, Beaudet MP, Jin X, Jones LJ, Cheung CY, Yue S, Singer VL. Characterization of SYBR Gold nucleic acid gel stain: a dye optimized for use with 300-nm ultraviolet transilluminators. Anal. Biochem. 1999;268:278–288. doi: 10.1006/abio.1998.3067. [DOI] [PubMed] [Google Scholar]
Associated Data
This section collects any data citations, data availability statements, or supplementary materials included in this article.