Abstract
DNA hypermethylation is a common finding in malignant cells and has been explored as a therapeutic target for hypomethylating agents (e.g., decitabine). Detection of changes in DNA methylation might serve as a pharmacodynamic endpoint to establish the biological activity of these agents and predict clinical response. We developed and validated a rapid, sensitive and specific LC-MS/MS method for determination of global DNA methylation (GDM) in vitro and in vivo. Ratios of 5-methyl-2′-deoxycytidine (5mdC) to the internal standard 2-deoxyguanosine (2dG) in mass signal were used to quantify GDM levels. The assay was validated in a linear range from 40 fmol to 200 pmol 5mdC. The intra-day precision values ranged from 2.8 to 9.9% and the inter-day values from 1.1 to 15.0%. The accuracy of the assay varied between 96.7 and 109.5%. This method was initially applied for characterization of decitabine-induced GDM changes in in-vitro-treated leukemia cells. Following exposure to 2.5 μM decitabine, GDM decreased to ∼50% of the baseline value. The clinical applicability of this method was then demonstrated in bone marrow samples from patients with acute myeloid leukemia treated with decitabine. Our data support the use of our LC-MS/MS method for clinical pharmacodynamic determination of changes in GDM in vivo.
INTRODUCTION
DNA methylation of the cytosine residues within the 5′-cytosine-guanosine (CpG) dinucleotides is an epigenetic change that controls gene transcription, genetic imprinting and perhaps genome stability (1). This process is regulated by DNA methyltransferases (i.e., DNMT1, DNMT3a and DNMT3b) in the presence of s-adenosyl-methionine (SAM), which serves as a methyl donor for C-5 methylation of the cytosine residues (2,3). While DNMT3a and 3b are considered initiators of de novo DNA methylation, DNMT1 is involved in the ‘maintenance’ of an acquired methylation status. In normal cells, methylated CpG dinucleotides are usually found in the untranscribed pericentromeric heterochromatin regions, which associate with deacetylated histones in a condensed conformation. In contrast, in the promoter sequences of transcribed genes, CpG dinucleotides are usually hypomethylated and associated with acetylated histones and open chromatin (euchromatin) in a status relatively accessible to the transcriptional machinery.
Aberrant DNA methylation patterns are commonly found in malignant cells (4). Hypermethylation of gene promoter sequences in cancer cells results in transcriptional silencing of tumor suppressor genes and contribute to malignant transformation. Therefore, hypermethylation has long been explored in cancer patients, including those with acute myeloid leukemia (AML) and myelodysplastic syndrome (MDS) as a therapeutic target for hypomethylating compounds such as decitabine and azacitidine (5,6). Despite encouraging clinical results, a direct correlation among drug plasma levels, DNA hypomethylation and disease response remains to be fully demonstrated. This could be attributed at least in part to lack of standardized analytical methods that accurately assess the pharmacokinetic and pharmacodynamic endpoints in patients treated with decitabine or azacitidine.
Recently, different groups have proposed assessing global genomic DNA methylation (GDM), in addition to methylation of individual gene promoters, as a surrogate endpoint to demonstrate the pharmacological activity of decitabine. Issa et al. (7) employed a bisulfite-and pyrosequencing-based method to characterize decitabine-induced GDM in chronic myelogenous leukemia; Mund et al. (8) used a capillary electrophoresis assay to measure the hypomethylating effect of decitabine in MDS, in which derivatization with 4,4-difluoro-5,7-dimethyl-4-bora-3a,4a-diaza-s-indacene-3-propionyl ethylenediamine hydrochloride (Bodipy FL EDA; Molecular Probes) to generate fluorescence and 45 min running time are required; Samlowski et al. (9) adopted an HPLC-UV assay (10) to explore the hypomethylating effect of decitabine in refractory solid tumor patients. Each of these previously reported methods, albeit useful, present some disadvantages, including long running times and low sensitivity, which might limit their applicability to large-scale clinical trials. Compared to these assays, LC-MS/MS methods offer a more sensitive and specific tool for global DNA methylation determination due to the advantage provided by mass differentiation of mass spectrometric detectors.
Herein, we report on a validated, rapid, specific and sensitive LC-MS/MS method that measures ratios of 5-methyl-2-deoxycytidine (5mdC) to 2-deoxyguanosine (2dG), used as an internal standard (I.S.) to quantify GDM levels. We showed the clinical applicability of this method by measuring GDM changes in bone marrow (BM) samples from AML patients treated with low-dose decitabine on a Phase I clinical trial conducted at our institution.
MATERIAL AND METHODS
Material
Methanol, acetonitrile (HPLC grade), ammonium formate, ammonium acetate, ammonium bicarbonate, 5mdC, 2dG and other nucleotides, nucleophosphatase (NP1), snake venom phosphatase, alkaline phosphatase, deoxrnucleotide triphosphate (2.5 mM), AmpliTaqGold polymerase and 10 × PCR buffer were all purchased from Sigma (St. Louis, MO). The primers for amplification of the promoter of C-myc oncogene myc-lucP1-2F 5′tgcgagggtctggacggctga3′ and myc-lucP0-3R 5′actacagcgagttagataaagc3′ were purchased from Integrated DNA Technology (Coralville, IA). M. SssI methylase, s-adenosyl-methionine (SAM, 3.2 mM) and 10× incubation buffer were purchased from New England Biolab. Inc. (Beverly, MA). Decitabine and FK-228 were obtained from The National Cancer Institute (NCI).
PCR amplification and purification of C-myc promoter
PCR was performed in a 100 μl reaction containing 100 ng genomic DNA, 10 × PCR buffer (166 mM ammonium sulfate/670 mM Tris at pH 8.8/67 mM MgCl2/100 mM 2-mercaptoethanol), primers for the C-myc promoter, deoxynucleotide triphosphates (2.5 mM). Reactions were hot started at 95°C for 10 min before adding 1.5 μl AmpliTaqGold (7.5 units). PCR conditions were as follows: 35 cycles of 94°C for 30 sec, 58°C for 30 sec, 72°C for 45 sec, followed by one elongation cycle of 72°C for 7 min. PCR products were purified using the QIAquick PCR Purification kit (Qiagen, Minneapolis, MN), according to the manufacturer's instructions.
In-vitro methylation
A 500 ng aliquot of the C-myc promoter amplicon was incubated with 25 U M. SssI and 320 μM of SAM solution (pH 7.9) containing 50 mM NaCl, 10 mM Tris-HCl, 10 mM MgCl2, 1 mM dithiothreitol and 5 μl NE buffer and H2O in 50 μl final volume for 90 min. The fully methylated C-myc promoter amplicon was purified using the QIAquick PCR Purification kit (Qiagen, Minneapolis, MN), according to the manufacturer's instructions.
Cell culture and DNA isolation
K562, Kasumi-1, THP1 and Jurkat cell lines were cultured at 37°C in a 5% CO2 incubator using an RPMI medium (VWR International, Inc., West Chester, PA) supplemented with 10% fetal bovine serum (Invitrogen, Carlsbad, CA). Cell lines were treated with decitabine ranging from 0.01 to 2.0 μM or with 5 nM of the histone deacetylase inhibitor depsipeptide, used as a control. Genomic DNA was isolated from the above cells using DNeasy tissue kit (Qiagen, Minneapolis, MN), according to the manufacturer's instructions.
DNA hydrolysis
DNA hydrolysis was performed as previously described (11). Briefly, 1 μg of genomic DNA was first denatured by heating at 100°C for 3 min and then chilling on ice. After adding a 1/10 volume of 0.1 M ammonium acetate (pH 5.3) and two units of nuclease P1, the mixture was incubated at 45°C for 2 h. One-tenth volume of 1 M ammonium bicarbonate and 0.002 unit of venom phosphodiesterase I were added, and the mixture was incubated at 37°C for 1 h. Next, 0.5 unit of alkaline phosphatase was added, and the mixture was incubated at 37°C for 1 h.
Instrumentation
For quantification, the LC-MS system used consisted of a Perkin-Elmer Sciex API 300 triple-quadrupole mass spectrometer (Thornhill, Ontario, Canada) coupled to a Shimadzu HPLC system (Shimadzu, Columbia, MD). The HPLC system was equipped with an SCL-10A system controller, a LC-10AD pump and a SIL-10A auto-sampler (Shimadzu, Columbia, MD).
HPLC chromatographic and mass spectrometric conditions
5mdC and the I.S. 2dG were separated on a 250 × 2.1 mm Hypersil Aquasil C18 5 μm stainless steel column (Thermo Hypersil-Keystone, Bellefonte, PA), which was coupled to a 2 μm Aquasil pre-column (Thermo Hypersil-Keystone, Bellefonte, PA), using the mobile phase consisting of 30% methanol in 10 mM ammonium formate at the flow rate of 0.2 ml/min. Pure methanol was then added to the flow at 0.2 ml/min via a separated HPLC pump and mixed post-column prior to the entrance to the ion source. The LC elute was introduced into the API source at 20 μl/min after a 95:5 (LC/MS) split. The mass spectrometer (Sciex API 300) was operated under electrospray ionization (ESI) with an ion-spray voltage of +4700 V. The positive ion multiple reaction monitoring (MRM) mode analysis was performed using nitrogen as the collision gas. The curtain gas (nitrogen) and the nebulizer gas (nitrogen) flow rates were set at 0.6 l/min and 1.1 l/min, respectively. The pressure in the collision cell was set at 0.29 Pa. The orifice voltage and ring voltages were set to +30 and +300 V, respectively. A dwell time of 600 ms and a pause time of 5 ms between scans were used to monitor the following precursor/product ion pair of m/z 268.1/152.2 for 2dG and m/z 242.1/126.1 for 5mdC. The mass spectrometer was tuned to its optimum sensitivity and mass accuracy by infusion of a fresh standard solution of 5mdC at 5 ng/ml. Data acquisition was performed using the PE Sciex software Sample Control 1.2, and the data were analyzed by PE Sciex software MacQuan 1.4.
Sample preparation and method validation
Stock solutions of 5mdC and 2dG were prepared by dissolving the accurately weighed drug in 10 ml of methanol and methanol containing 0.2% NH4OH, respectively, to a final concentration of 1 mg/ml and stored in a glass vial at −80°C. Working solutions were freshly prepared daily by diluting the stock solution with methanol. Volumes of 5mdC working solution were added into working solution of 2dG to prepare calibration standards at the following concentrations: 2 (8), 5 (20), 10 (40), 20 (80), 50 (200), 100 (400), 200 (800) and 500 (2000) ng/ml (nM). The enzymatic digestion solutions of the unmethylated and methylated PRC products of the C-myc and genomic DNA of Kasumi-1 and K562 were reconstituted in 200 μl water at 4°C and analyzed immediately by LC-MS. The between-day precision was determined for three quality control (QC) samples at six different days, and the mean concentrations and % coefficients of variation (CV) were calculated. The accuracy of the assay was determined by comparing the nominal concentrations with the corresponding calculated concentrations via linear regression.
Patient samples and DNA extraction
Aspirated BM mononuclear cell samples were obtained from AML patients treated with decitabine under the NCI-sponsored OSU Protocol 0336, approved by the Institution Review Board of The Ohio State University. Samples were obtained with the patients’ informed consent. Patients received 15 or 20 mg/m2 decitabine intravenously over 1 h for 10 consecutive days. Treatment was repeated every 28 days for responding patients. BM samples were collected before treatment and on days 4 and 11 of the first cycle of treatment. DNA was extracted using a trizol protocol, according to the manufacturer's instructions (Invitrogen, Carlsbad, CA). DNA was enzymatically hydrolyzed to nucleosides as described above, and 5mdC was determined using the LC-MS/MS method.
Immunoblotting
Fresh cells (106–108 cells) in culture medium, or frozen cell pellets thawed on ice and resuspended in 1 ml ice-cold PBS, were centrifuged at 1000 g for 5 min at 4°C, and the supernatant was removed and discarded. The pellet was resuspended in 100–200 μl ice-cold lysis buffer (20 mM pH 7.0 HEPES, 150 mM NaCl, 0.1% NP40 supplemented with 1 mM β-glycerophosphate, 1 mM Na3VO4, 1 mM NaF, 1 mM Benzimedin and 1 mM phenylmethylsulfonyl fluoride and protease inhibitors; protease inhibitor cocktail set III) (Calbiochem-Novabiochem Corporation, La Jolla, CA) and incubated on ice for 40 min. The lysate was centrifuge at 16,000 g for 15 min at 4°C. The supernatants were frozen in liquid nitrogen and stored at −80°C. Equal amounts of protein for each sample were then separated on 4–15% SDS-polyacrylamide gels and then transferred onto PVDF membrances (Amersham, Piscataway, NJ). The blots were blocked in TBST (10 mM Tris-HCl, pH 8.0, 150 mM NaCl, 0.1% Tween 20) containing 5% non-fat milk and subsequently incubated with anti-DNMT1 (New England Biolabs; 1:250). Protein recognized by the antibody was detected using Chemiluminescent detection kit (Pierce, Rockford, IL). Equal loading was confirmed by probing for β-actin.
RESULTS
Mass spectrometric characterization of 5mdC and 2dG
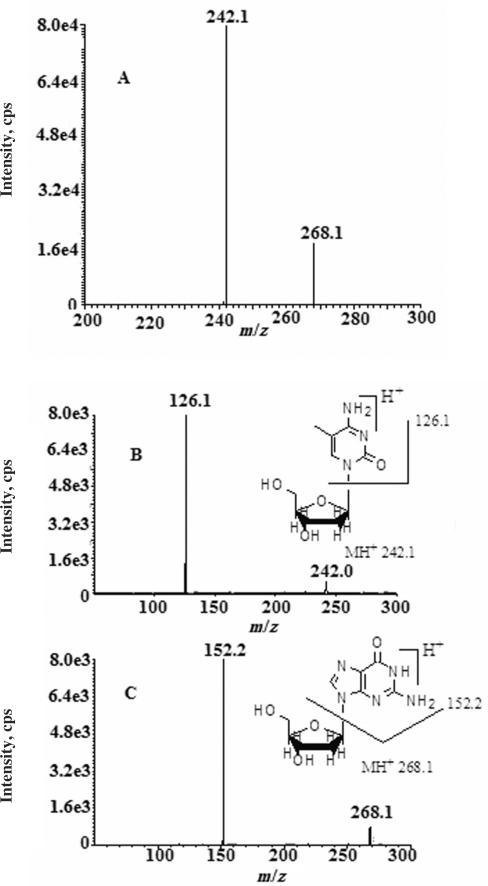
A mixture of 5mdC (1 μg/ml) and the I.S. 2dG (1 μg/ml) in 50% acetonitrile and 5 mM ammonium formate solution was infused into the quadrupole mass spectrometer at a flow rate of 10 μl/min for 1 min. The average mass spectrum as acquired under positive ion ESI exhibited two major ions at m/z 242.1 and 268.1 (Figure 1A). These ions correspond to the protonated molecular ions (MH+) of 5mdC and 2dG, respectively. No 5mdC and 2dG sodium adducts were observed, possibly due to the use of an ammonium formate in the eluant, which enhanced the mass signal of the protonated molecular ion of sugar-containing compounds and suppress sodium adduct formation (data not shown). The collision-assisted dissociation (CAD) spectrum (Figure 1B) of the MH+ of 5mdC at m/z 242.2 exhibited a base fragment ion at m/z 126.1, corresponding to the protonated 5-methylcytosine generated by glycosidic cleavage of the protonated 5mdC. CAD spectrum of the MH+ of 2dG at m/z 268.1 (Figure 1C) exhibited a base fragment ion at m/z 152.2, corresponding to the protonated guanosine formed by glycosidic cleavage of protonated 2dG. Therefore, the ion transition of m/z 242.1 > 126.1 and the ion transition of m/z 268.1 > 152.2 were selected for monitoring 5mdC and 2dG, respectively.
Figure 1.
The average mass spectrums of (A) 2-deoxyguanosine (1 μg/ml) and 5-methyl-2′-deoxycytidine (1 μg/ml) and collision-assisted dissociation (CAD) spectrum of the protonated molecular ion of (B) 5-methyl-2′-deoxycytidine and (C) the protonated molecular ion of 2′-deoxyguanosine.
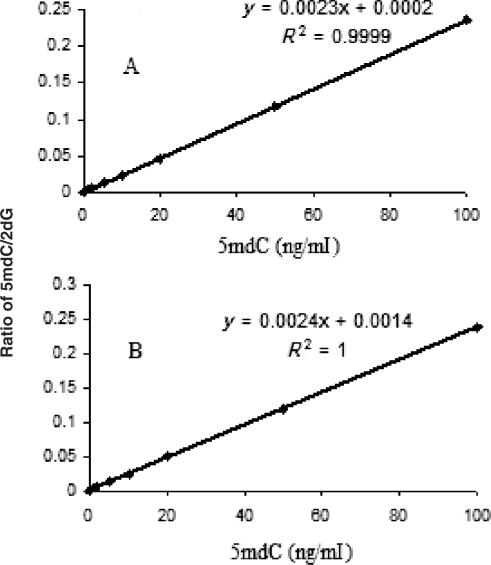
For assay validation, we utilized serial dilutions of 5mdC into 2dG standards. The assay was found to be linear from 40 fmol to 200 pmol of 5mdC (equivalent to approximately 1 to 5 ng DNA, respectively) on column using aqueous buffer solution (Figure 2A). The precision and accuracy of the assay were assessed within the physiologic range of GDM from 80 fmol to 40 pmol. Levels of methylation were calculated using a calibration curve where the area ratios of the mass signal of 5 mdC to 2 dG were plotted against known weight/weight ratio of 5 mdC and 2 dG, which allows conversion to % DNA methylation (40 fmol 5 mdC is equivalent to approximately 5% DNA methylation of 1 ng DNA) (12). Importantly, linearity and slope of calibration curve did not change when assessed in solution containing a variety of nucleotides (i.e., 2-deoxycytidine (2dC), 2-deoxyadenosine (2dA) and thymidine (T) cytidine (C), 5methyl-cytidine (5mC) adenosine (A), uridine (U) and guanosine (G)) that are commonly found in in vivo samples in addition to 5 mdC and 2 dG (Figure 2B). The slopes and the intercepts of the standard curves were 0.0023 and 0.0002 in the presence of 1000 ng/ml 2 dG only and 0.0024 and 0.0014 in the presence of 1000 ng/ml of 2dG, dC, dA, T, C, A, U, G and 5mC, respectively, thereby indicating no interference by these moieties.
Figure 2.
Global DNA methylation calibration curves using (A) 5 mdC (2–100 ng/ml) spiked into a 1000 ng/ml solution of 2 dG and (B) 5 mdC (2–100 ng/ml) spiked into a 1000 ng/ml solution of 2 dA, 2 dC, T, A, G, U, C and 5mC.
Validation of the LC-MS/MS method
The inter-day and intra-day precision and accuracy of our method to assess GDM levels are summarized in Table 1. The intra-day precision expressed as CV ranged from 2.78 to 9.86%, and the inter-day precision values ranged from 1.1 to 15.0%. The accuracy values of the assay varied from 96.7 to 109.5%. All these values were within the commonly accepted guidelines. (Guidance for Industry Bioanalytical Method Validation, p.5, available from the website: http://www.fda.gov/cder/guidance/4252fnl.pdf)
Table 1.
Accuracy and precision of the LC-MS/MS method for the determination of percentage of 5 mdC and 2 dG spiked in 25% methanol, 5 mM ammonium formate
| % 5md/2dG | Intra-day | Inter-day | |||
|---|---|---|---|---|---|
| Ave. ± S.D. | C.V.% | Accuracy% | Ave. ± S.D. | C.V.% | |
| 0.2 | 0.219 ± 0.022 | 9.86 | 109.5 | 0.20 ± 0.03 | 15.0 |
| 2 | 2.05 ± 0.07 | 3.30 | 102.5 | 2.01 ± 0.12 | 6.0 |
| 10 | 9.67 ± 0.27 | 2.78 | 96.7 | 9.94 ± 0.11 | 1.1 |
To further confirm the precision and accuracy of the method for the entire enzymatic procedure, a PCR amplicon of the promoter of the C-myc oncogene containing no 5 mdC was methylated in vitro using M. SssI in the presence of SAM. An unmanipulated, unmethylated aliquot of this amplicon was used as a negative control. Both methylated and unmethylated amplicons were digested with NP1, snake venom phosphatase and alkaline phosphatase, respectively, and the hydrolysis products were analyzed by the LC-MS/MS. The absence of chromatographic peak at the retention time of 5mdC (i.e., 5.1 min) in the enzymatic hydrolysis of the unmethylated PCR product of the C-myc promoter confirmed the specificity of the method (Table 2). To confirm the usefulness of 2dG as an I.S., we used 2dC ion transition m/z 228.1/112.1 as a cross-reference. As the sequence of the C-myc promoter amplified herein was a 197 bp oligonucleotide with 36 CpG dinucleotides, 129 2dC and 129 2dG nucleotides, full methylation of all 2dCs in the CpG dinucleotides of this moiety should return a value of 24.9% in weight ratio of 5mdC/2dG and 29.1% in weight ratio of 5mdC/[5mdC + 2dC]. The actual measured value were 26.2 ± 2.4% in weight ratio of 5mdC/2dG (accuracy 105.2%) and 28.8 ± 0.49% in weight ratio of 5mdC/[2dC + 5mdC] (accuracy 98.9) following enzymatic hydrolysis of in vitro methylated C-myc promoter sequence, thereby confirming the accuracy of our method (Table 2).
Table 2.
Accuracy and precision of the LC-MS/MS method for the determination of genomic DNA methylation in in vitro methylated PCR product and genomic DNA extracted from cell lines
| Sample type | Intra-day (Ave. ± S.D.) | Inter-day (Ave. ± S.D.) | |||
|---|---|---|---|---|---|
| 5mdC/2dG 5mdC/[2dC + 5mdC] (Te) | C.V.% | Accuracy% | 5mdC/2dG 5mdC/[2dC + 5mdC] (T) | C.V.% | |
| PCa | NDc | NAd | NA | NA | NA |
| MPCb | 26.2 ± 2.4 | 9.16 | 105.2 | NA | NA |
| 28.8 ± 0.49 (29.1) | 1.69 | 98.8 | |||
| Kasumi-1 | 4.87 ± 0.24 | 5.02 | NA | 5.36 ± 0.70 | 1.30 |
| 5.82 ± 0.21 (5.72) | 3.69 | 5.94 ± 0.14 (6.30) | 2.37 | ||
| K562 | 2.49 ± 0.10 | 4.08 | NA | 3.03 ± 0.34 | 11.3 |
| 2.91 ± 0.11 (2.93) | 3.63 | 3.19 ± 0.28 (3.56) | 8.74 | ||
aPC, PCR product of C-myc promoter; bMPC, Fully methylated PCR product of C-myc promoter; cND, Not detected; dNA, not available; eT, Theoretical
The applicability of this method was also assessed by hydrolysis of genomic DNA extracted from two AML cell lines (i.e., K562 and Kasumi-1) (Table 2). Using 5mdC/2dG weight ratio as an indicator of GDM, mean value of three replicates of these samples showed 4.87% baseline GDM level in Kasumi-1 cells with an inter-day CV of 5.02% and 2.49% baseline GDM level in K562 cells with an intra-day CV of 4.08%. When 5mdC/[2dC + 5mdC] weight ratio was used as a cross-reference, the mean value of three replicates of this experiment in Kasumi-1 cells showed 5.8% baseline GDM level with an intra-day CV of 3.69%, and in K562 cells was 2.91% baseline GDM level with an intra-day CV of 3.63%. Similar results were also detected from inter-day validation. Kasumi-1 cells were therefore used as a GDM high quality control (HQC) and K562 as the GDM low quality control (LOQ) for further assay validation.
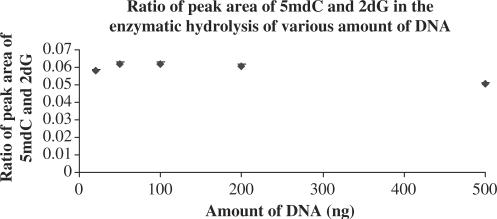
We estimated the limit of detection (LOD) of the assay by varying the input amounts of K562 DNA (20, 50, 100, 200, 500 ng) in the hydrolysis step. A 10 μl aliquot of each digest was injected for analysis, and the peak areas of 5mdC and 2dG were found to be in a linear relationship with DNA amounts (not shown). The 5mdC and 2dG ratios remained essentially constant throughout the assessed DNA concentration range (Figure 3) with less than 10% variation. This data suggests that the recovery of nucleosides from DNA digestion remains constant even when the DNA amount is as small as 20 ng with 2.5% GDM.
Figure 3.
5 mdC and 2 dG ratios in samples with various amounts of genomic DNA extracted from K-562 cell line.
Alterations of GDM in acute leukemia cells treated with decitabine
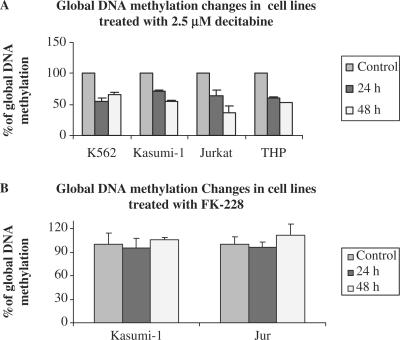
We then asked the question of whether our assay could reliably measure pharmacologically induced GDM changes. Decitabine is a nucleoside analog that was demonstrated to induce global DNA hypomethylation both in vitro and in vivo (13,14). Four human acute leukemia cell lines (i.e., Kasumi-1, K562, and THP -1 and Jurkat) were treated with 2.5 µM decitabine for 48 h. Cells treated with FK-228, a histone deacetylase inhibitor, were used as a negative control. The mean baseline DNA methylation values of Kasumi-1, K562, Jurkat, THP-1 were found to be 4.98, 2.43, 4.25 and 4.79%, respectively (Figure 4A). Following treatment with 2.5 µM decitabine, their GDM levels decreased to 71.0, 55.6, 64.8 and 60.3% of the corresponding pretreatment values at 24 h and 55.6, 66.6, 36.5 and 53.9% at 48 h, respectively (Figure 4A). In contrast, 5 nM FK228 showed no significant alteration in GDM following 24 and 48 h incubation (Figure 4B).
Figure 4.
Global DNA methylation levels in leukemia cell lines treated with 2.5 μM decitabine (A, P < 0.005, n = 3, paired t test) or with FK-228 (B).
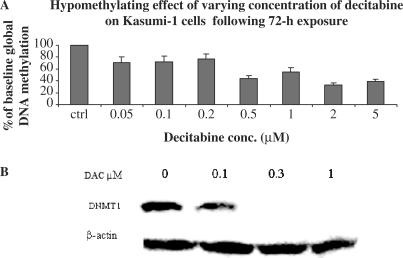
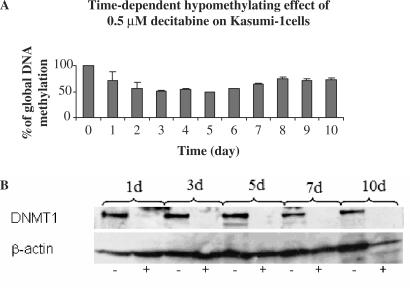
A dose-dependent hypomethylating effect of decitabine was also observed with a maximum decrease in GDM to approximately 40% of the pretreatment levels following exposure to 2 and 5 μM decitabine for 48 (not shown) and 72 h (Figure 5A). Consistent with these results, a decrease in DNMT1 was observed in cells treated with ≥ 100 nM decitabine (Figure 5B). The kinetics of GDM changes following exposure to 0.5 μM decitabine was also studied. Following 48 h, GDM in decitabine-treated cells decreased to approximately 40% of the baseline levels (Figure 6A). Starting from day 6, GDM increased again and returned to 70% of pretreatment baseline level by day 8. Then it remained unchanged for up to day 10. Interestingly, we also observed a concurrent and persistent decrease in DNMT1 during the 10 days of monitoring following the initial decitabine treatment (Figure 6B).
Figure 5.
Dose-dependent activity of decitabine in Kasumi-1 cells. Changes in (A) global DNA methylation and (B) DNMT1.
Figure 6.
Time-dependent activity of 0.5 μM decitabine in Kasumi-1 cells. Changes in (A) global DNA methylation and (B) DNMT1.
GDM and DNMT1 alterations in AML patients treated with decitabine
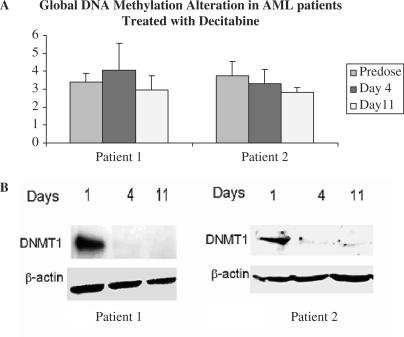
To test the applicability of our assay to clinical samples, we measured changes in GDM of BM samples from AML patients who received decitabine 15 mg/m2/day i.v. for 10 days. As shown in Figure 7A, GDM in patient 1 decreased from a baseline level of 3.40% to 2.95% on day 11 of decitabine treatment, while no change or a slight increment was observed on day 4. In patient 2, the GDM levels decreased from a baseline level of 3.70% to 3.3% and 2.8% on days 4 and 11 of decitabine treatment, respectively. Concurrent with these changes, DNMT1 protein levels became either undetectable or nearly detectable (Figure 7B).
Figure 7.
The time-dependent changes in (A) global DNA methylation and (B) DNMT1 in BM mononuclear cells from AML patients treated with decitabine.
DISCUSSION
Low-dose decitabine has been recently approved for treatment of patients with MDS (15). Alternative schedules of low-dose decitabine are also being investigated in clinical trials for hematopoietic malignancies including AML with encouraging clinical results. We have recently reported preliminary pharmacokinetic data supporting that levels that induce in vitro DNMT1 depletion and DNA hypomethylation can be achieved in vivo in AML patients treated with low-dose decitabine (i.e., 15–20 mg/m2/day over 1 h for 10 consecutive days) (16). Despite these encouraging clinical and pharmacokinetic results, it remains difficult to demonstrate a consistent and direct correlation between the hypomethylating effect of this agent and disease response. This is possibly due to lack of standardized and reproducible methods for pharmacodynamic analyses.
Recently, two LC-MS/MS-based methods for assessing GDM have been reported (11,17). Friso et al. (17) used (methyl-d3,ring-6-d1)-5-methyl–2′-deoxycytidine and [15N3]2′-deoxycytidine stable isotopomer as I.S. for the measurement of 5 mdC and 2 dC in DNA hydrolyate and estimated the amount of 5 mdC relative to the total amount of cytosine residues with 13 min run time. However, this method required complete elimination of RNA contamination during the DNA purification and could not differentiate 5 mdC from 5 mC and 2 dC from C. Song et al. (11) employed 2-dG as I.S. in their LC-MS method, which was based on the fact of the molarity of 2dC plus 5 mdC equal to that of 2 dG in the double-strand DNA. This method simplified the quantification process and improved the accuracy of this approach (11) with a low detection limit (i.e., 0.2 fmol) but also a relatively long run time of 15 min. Neither group validated their method to assess GDM changes in patients treated with hypomethylating agents.
Herein, we reported a modified sensitive and rapid LC-MS/MS method for GDM determination in decitabine-treated patients. The run time of our assay is 6 min instead of 15 min, and the LOD is 1 fmol 5 mdC. By taking advantage of the differentiating ability of mass spectrometry, our assay can be easily adapted to a high-throughput platform critical for large-scale studies. Importantly, we showed that the presence of other deoxynucleosides (2 dC, 2 dA and T) and ribonucleosides [C, A, U, G and 5-methylcytidine (5 mC)] do not interfere with measurement of levels of 5 mdC and the I.S. 2dG. In fact, to rule out this possibility, we examine carefully the mass spectra and tandem mass spectra of all these nucleosides. The average mass spectra and their corresponding CAD spectra for these nucleotides were at 228.1/112.1, 252.2/136.0, 243.3/127.2, 244.1/112.1, 268.2/136.1, 245.1/113.0, 284.1/152.2 and 258.2/126.1 m/z, respectively, and did not overlap with those of 5 mdC and 2 dG. The presence of 2 dC, 2 dA, T, C, A, U, G and 5mC did not affect the signal intensity of 5mdC [2 ng/ml (8 nM) to 100 ng/ml (400 nM)] and 2 dG or their ratio as demonstrated by the similar slope and intercept of the calibration curves for measuring 5 mdC obtained in absence (Figure 2A) or presence of these nucleotides (Figure 2B).
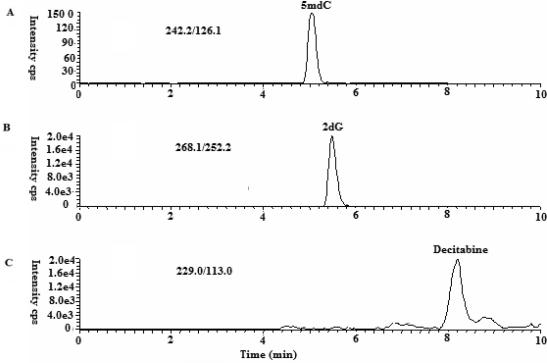
Furthermore, because GDM analysis is relevant to patients treated with decitabine, a 2-deoxycytidine analog readily incorporated in genomic DNA, it was also important to exclude a potential interference of this compound in the measurement of 5 mdC changes. We recently developed, validated and reported an LC-MS/MS method for the quantification of decitabine (16). Herein, we tested whether this compound could interfere with GDM quantification. Under similar chromatographic conditions for analysis, 5-mdC and 2 dG were eluted at 5.1 min and 5.6 min, respectively, while decitabine was eluted at 8.2 min. Therefore, decitabine did not pose interference on the quantification of 5 mdC and 2 dG due to different retention time and a distinct mass spectrometry (229 > 113)(Figure 8). Consistent with this, we were able to measure GDM changes in decitabine-treated patients and support the applicability of this method in vivo, in patients undergoing treatment with hypomethylating agents.
Figure 8.
The extracted ion chromatogram (XIC) for (A) 5 mdC at m/z 242/126, (B) 2dG at m/z 268/152 and (C) decitabine at 229/113 in Mobile Phase A spiked with 1 ng/ml 5 mdC, 1000 ng/ml of the 2dG and 200 ng/ml decitabine, respectively.
CONCLUSION
A rapid, sensitive and specific LC-MS/MS method for determination of GDM was modified, validated and applied to measure the alteration of DNA methylation levels induced by the hypomethylating agent decitabine in AML treated in vitro and in vivo. The hypomethylating effect of decitabine appears to be dose and time dependent and was observed in both in vitro treated cell lines and in AML patients following decitabine administration. This method provides an efficient method for characterization of GDM and permits conversion to a high-throughput platform that is critical for future clinical research in this area.
ACKNOWLEDGEMENTS
This work was supported in part by the National Cancer Research Institute, Bethesda, MD, grants CA102031. Funding to pay the Open Access publication charge was provided by The Comprehensive Cancer Center, The Ohio State University, Columbus OH.
Conflict of interest statement. None declared.
REFERENCES
- 1.Jones PA, Baylin SB. The fundamental role of epigenetic events in cancer., Nat. Rev. Genet. 2002;3:415–428. doi: 10.1038/nrg816. [DOI] [PubMed] [Google Scholar]
- 2.Herman JG, Baylin SB. Gene silencing in cancer in association with promoter hypermethylation. N. Engl. J. Med. 2003;349:2042–2054. doi: 10.1056/NEJMra023075. [DOI] [PubMed] [Google Scholar]
- 3.Issa JP. CpG island methylator phenotype in cancer. Nat. Rev. Cancer. 2004;4:988–993. doi: 10.1038/nrc1507. [DOI] [PubMed] [Google Scholar]
- 4.Esteller M, Fraga MF, Guo M, Garcia-Foncillas J, Hedenfalk I, Godwin AK, Trojan J, Vaurs-Barriere C, Bignon YJ, et al. DNA methylation patterns in hereditary human cancers mimic sporadic tumorigenesis. Hum. Mol. Genet. 2001;10:3001–3007. doi: 10.1093/hmg/10.26.3001. [DOI] [PubMed] [Google Scholar]
- 5.Lubbert M. DNA methylation inhibitors in the treatment of leukemias, myelodysplastic syndromes and hemoglobinopathies: Clinical results and possible mechanisms of action. Curr. Top Microbiol Immunol. 2000;249:135–164. doi: 10.1007/978-3-642-59696-4_9. [DOI] [PubMed] [Google Scholar]
- 6.Daskalakis M, Nguyen TT, Nguyen C, Guldberg P, Kohler G, Wijermans P, Jones PA, Lubbert M. Demethylation of a hypermethylated P15/INK4B gene in patients with myelodysplastic syndrome by 5-aza-2-deoxycytidine (decitabine) treatment. Blood. 2002;100:2957–2964. doi: 10.1182/blood.V100.8.2957. [DOI] [PubMed] [Google Scholar]
- 7.Issa JP, Gharibyan V, Cortes J, Jelinek J, Morris G, Verstovsek S, Talpaz M, Garcia-Manero G, Kantarjian HM. Phase II study of low-dose decitabine in patients with chronic myelogenous leukemia resistant to imatinib mesylate. J. Clin. Oncol. 2005;23:3948–3956. doi: 10.1200/JCO.2005.11.981. [DOI] [PubMed] [Google Scholar]
- 8.Mund C, Hackanson B, Stresemann C, Lubbert M, Lyko F. Characterization of DNA demethylation effects induced by 5-Aza-2'-deoxycytidine in patients with myelodysplastic syndrome. Cancer Res. 2005;65:7086–7090. doi: 10.1158/0008-5472.CAN-05-0695. [DOI] [PubMed] [Google Scholar]
- 9.Samlowski WE, Leachman SA, Wade M, Cassidy P, Porter-Gill P, Busby L, Wheeler R, Boucher K, Fitzpatrick F, et al. Evaluation of a 7-day continuous intravenous infusion of decitabine: inhibition of promoter-specific and global genomic DNA methylation. J. Clin. Oncol. 2005;23:3897–3905. doi: 10.1200/JCO.2005.06.118. [DOI] [PubMed] [Google Scholar]
- 10.Gehrke CW, McCune RA, Gama-Sosa MA, Ehrlich M, Kuo KC. Quantitative reversed-phase high-performance liquid chromatography of major and modified nucleosides in DNA. J. Chromatogr. 1984;301:199–219. doi: 10.1016/s0021-9673(01)89189-5. [DOI] [PubMed] [Google Scholar]
- 11.Song L, James SR, Kazim L, Karpf AR. Specific method for the determination of genomic DNA methylation by liquid chromatography-electrospray ionization tandem mass spectrometry. Anal. Chem. 2005;77:504–510. doi: 10.1021/ac0489420. [DOI] [PubMed] [Google Scholar]
- 12.Cohen N, Dagan T, Stone L, Graur T. GC composition of the human genome: in search of isochors. Mol. Biol. Evol. 2005;22:1260–1272. doi: 10.1093/molbev/msi115. [DOI] [PubMed] [Google Scholar]
- 13.Bender CM, Pao MM, Jones PA. Inhibition of DNA methylation by 5-aza-2'-deoxycytidine suppresses the growth of human tumor cell lines. Cancer Res. 1998;58:95–101. [PubMed] [Google Scholar]
- 14.Wirtz M, Stach D, Kliem HC, Wiessler M, Schmitz OJ. Quantitative analysis of DNA methylation in chronic lymphocytic leukemia patients. Electrophoresis. 2004;25:839–845. doi: 10.1002/elps.200305830. [DOI] [PubMed] [Google Scholar]
- 15.Kantarjian H, Issa JP, Rosenfeld CS, Bennett JM, Albitar M, DiPersio J, Klimek V, Slack J, de Castro C, et al. Decitabine improves patient outcomes in myelodysplastic syndromes: results of a phase III randomized study. Cancer. 2006;106:1794–1803. doi: 10.1002/cncr.21792. [DOI] [PubMed] [Google Scholar]
- 16.Liu Z, Marcucci G, Byrd JC, Grever M, Xiao J, Chan KK. Characterization of decomposition products and preclinical and low dose clinical pharmacokinetics of decitabine (5-aza-2′-deoxycytidine) by a new liquid chromatography/tandem mass spectrometry quantification method. Rapid Commun. Mass Spectrom. 2006;20:1117–1126. doi: 10.1002/rcm.2423. [DOI] [PubMed] [Google Scholar]
- 17.Friso S, Choi SW, Dolnikowski GG, Selhub J. A method to assess genomic DNA methylation using high-performance liquid chromatography/electrospray ionization mass spectrometry. Anal. Chem. 2002;74:4526–4531. doi: 10.1021/ac020050h. [DOI] [PubMed] [Google Scholar]


