

Abstract
The absence of mouse mitochondrial glycerol-3-phosphate acyltransferase-1 (Gpat1-/-) increases the amount of arachidonate in liver phospholipids and increases β-hydroxybutyrate and acyl-carnitines, suggesting an elevated rate of liver fatty acid oxidation. We asked whether these alterations might increase reactive oxygen species (ROS), apoptosis, or hepatocyte proliferation. Compared to wildtype controls, liver mitochondria from Gpat1-/- mice showed a 20% increase in the rate of ROS production and a markedly increased sensitivity to the induction of the mitochondrial permeability transition. Mitochondrial phosphatidylethanolamine and phosphatidylcholine from Gpat1-/- liver contained 21% and 67% more arachidonate, respectively, than wildtype controls, and higher amounts of 4-hydroxynonenal, a product of arachidonate peroxidation. Oxidative stress was associated with an increase in apoptosis, and with 3-fold and 15-fold higher TUNEL positive cells in liver from young and old Gpat1-/- mice, respectively, compared to age-matched controls. Compared to controls, bromodeoxyuridine labeling was 50% and 7-fold higher in livers from young and old Gpat1-/- mice, respectively, but fewer glutathione-S-transferase positive cells were present. Thus, Gpat1-/- liver exhibits increased oxidative stress and sensitivity of the mitochondrial permeability transition pore, and a balanced increase in apoptosis and proliferation.
Introduction
Oxidative metabolism is a primary source of reactive oxygen species (ROS) that may progressively damage cellular proteins, membrane lipids, and DNA. Because increased mitochondrial fatty oxidation increases the production of ROS (Finck et al 2003; Russell et al 2005; Yamagishi et al 2001), we studied mitochondrial glycerol-3-phosphate acyltransferase-1 (GPAT1) knockout (Gpat1-/-) mice in which elevated β-hydroxybutyrate and acyl-carnitines suggest that hepatic β-oxidation is increased because the mice lack the ability to incorporate excess acyl-CoAs into triacylglycerol (Hammond et al 2005). Lack of GPAT1 allows carnitine palmitoyltransferase-1 (CPT-1), the rate-limiting step in fatty acid oxidation, to convert excess fatty acyl-CoAs to acyl-carnitines which then enter the mitochondria for β-oxidation. In livers from Gpat1-/- mice, not only is the oxidation of fatty acids increased, but hepatic phospholipids contain excess arachidonic acid, an important ROS target (Hammond et al 2002; Hammond et al 2005).
Three known GPAT isoforms catalyze the initial and rate-limiting step in the pathway of glycerophospholipid and triacylglycerol synthesis (Bell and Coleman 1983). The GPAT1 isoform is an intrinsic membrane protein located on the outer mitochondrial membrane where it competes for long-chain fatty acyl-CoAs with CPT-1 (Coleman and Lee 2004; Hammond et al 2005). Gpat1 is upregulated by insulin and by SREBP-1 under conditions that increase triacylglycerol synthesis and diminish fatty oxidation. In addition, AMP-activated protein kinase reciprocally regulates CPT-1 and GPAT1 (Coleman and Lee 2004; Muoio et al 1999; Park et al 2002). When GPAT1 is over-expressed, triacylglycerol synthesis increases and fatty acid oxidation decreases (Lewin et al 2005; Lindén et al 2004). Conversely, compared to wildtype controls, fatty acid oxidation appears to be enhanced in Gpat1-/- liver which contains 60% less triacylglycerol and 2-fold more acyl-carnitines (Hammond et al 2005). Plasma β-hydroxybutyrate is also increased 2-fold (Hammond et al 2005), and liver phosphatidylcholine (PC) and phosphatidylethanolamine (PE) contain less 16:0 in the sn-1 position, compensatory increases in 18:0 and 18:1, and 40% more 20:4 in the sn-2 position (Hammond et al 2002).
Because acyl-CoAs in liver from Gpat1-/- mice are partitioned towards oxidative pathways and because livers from these mice contain higher amounts of 20:4 in their phospholipids, we hypothesized that an accelerated rate of hepatic fatty acid oxidation in Gpat1-/- mice would increase ROS produced during mitochondrial metabolism and lead to mitochondrial and cellular dysfunction.
Material and Methods
Animals and diets
Animal protocols were approved by the University of North Carolina at Chapel Hill IACUC. Generation of Gpat1-/- mice was described previously (Hammond et al 2002). F1 mice were crossed six times with C57BL/6J mice to transfer the null Gpat1 mutation onto a C57BL/6J genetic background (∼99%). The resulting backcrossed heterozygotes were then intercrossed to obtain wildtype and homozygous Gpat1-/- mice. Because basal liver GPAT1 specific activity is identical in male and female mice (Hammond LE, and Coleman RA, unpublished) and because GPAT1 in female mice is more hormonally responsive (Ameen et al 2004), functional studies were performed in liver from female mice. A preliminary study in males did not differ from results found in females. Mice were housed in a pathogen-free barrier facility on a 12-h/12-h light/dark cycle and had free access to water and food. Mice were fed Prolab RMH 3000 SP76 chow (26% kcal protein, 14% kcal fat, and 60% kcal carbohydrate).
Electron Microscopy
Anesthetized mice were perfused through the left ventricle with a fixative containing 2% paraformaldehyde and 2.5% glutaraldehyde in 0.15 M sodium phosphate buffer, pH 7.4. Ultrathin liver sections were examined using a LEO EM910 transmission electron microscope at 80kV (LEO Electron Microscopy, Thornwood, NY) and photographed using a Gatan Bioscan Digital Camera (Gatan, Inc., Pleasanton, CA).
Mitochondrial isolation
Mice were fasted overnight and liver mitochondria were isolated using a modification of a previously described protocol (Lemasters et al 1984). Mouse liver was minced and homogenized on ice in 0.25 M sucrose, 2 mM K-HEPES, 0.5 mM EGTA, pH 7.4 using 4 slow up-and-down strokes with a motor-driven Teflon-glass homogenizer. Debris was removed by centrifugation at 600 × g for 15 min at 4°C. The supernatant was centrifuged at 9,750 × g for 15 min at 4°C to isolate the mitochondrial pellet. The mitochondrial pellet was resuspended in 0.25 M sucrose, 2 mM K-HEPES, pH 7.4 and centrifuged at 9,750 × g for 10 min at 4°C. After repeating this step, the final pellet was resuspended at 50 mg protein/ml in 0.25 M sucrose, 2 mM K-HEPES, pH 7.4. Protein concentrations were determined by a Biuret procedure using bovine serum albumin as the standard (Gornall et al 1949).
Mitochondrial permeability transition and reactive oxygen species (ROS)
Mitochondrial permeability transition (MPT) assays were performed at 25°C in 48-well plates with a FLUOstar multiwell fluorescence plate reader (BMG LabTechnologies GmbH) in an MPT incubation buffer containing 200 mM sucrose, 20 μM EGTA, 5 mM succinate, 2 μM rotenone, 1 μg/ml oligomycin, 20 mM Tris, 20 mM HEPES, and 1 mM KH2PO4, pH 7.2 as previously described (Blattner et al 2001). Mouse liver mitochondria were added to yield a final concentration of 0.5 mg protein/ml in 1 ml of buffer per well. Mitochondrial membrane potential and Ca2+ uptake and release were monitored using 100 and 200 μM CaCl2, 1 μM tetramethylrhodamine methyl ester (TMRM) and 1 μM Fluo-5N, respectively (Blattner et al 2001).
ROS production was monitored fluorometrically after incubating mitochondria in MPT incubation buffer containing 1 μM 5-(and-6)-chloromethyl-2’,7’-dichlorodihydrofluorescein diacetate (carboxy-DCFDA) from the rate of increase of the green fluorescence of DCF, the oxidized product of carboxy-DCFDA. Fluorescence was excited from the top of the wells and emission was measured from the bottom. The red fluorescence of TMRM and the green fluorescence of Fluo-5N and carboxy-DCFDA were measured using excitation filters of 485 nm (15 nm band pass) and 544 nm (15 nm band pass) and emission filters of 538 nm (25 nm band pass) and 590 nm (15 nm band pass), respectively. The change in absorbance was calculated as A = log[It/Ii], where Ii is the initial transmitted light intensity and It is the light intensity at the subsequent time (Bernardi 1999). Decreased absorbance indicates mitochondrial swelling. The t½ is the time at which the mitochondria achieved ½ maximal swelling as denoted by the decrease in absorbance.
Mitochondrial lipids
Livers were homogenized in 10 mM Tris, pH 7.4, 250 mM sucrose, 1 mM dithiothreitol, and 1 mM EDTA (Medium A) using 10 up-and-down strokes with a Teflon-glass homogenizer. Large debris and nuclei were removed with a 600 × g centrifugation. Mitochondria were pelleted by centrifugation for 10 min at 10,300 × g and resuspended in Medium A. Protein concentration was determined by the bicinchoninic acid method (Pierce) using bovine serum albumin as the standard. Purity of mitochondria was established by measuring the activity of enzyme markers, NADPH cytochrome c reductase (Dallner et al 1966) and cytochrome c oxidase (cytochrome c oxidase kit, Sigma), for endoplasmic reticulum and mitochondria, respectively. NADPH cytochrome c reductase activity in the mitochondria was less than 1%. Mitochondria aliquots were stored at -80°C until use.
Lipids from liver (25 mg) and isolated mitochondria (2 mg) from Gpat1-/- and wildtype mice were extracted in the presence of authentic internal standards (Folch et al 1957) using chloroform:methanol (2:1 v/v). Individual lipid classes within the extract were separated by preparative thin layer chromatography (Watkins et al 2001). Isolated lipid classes were transesterified in 3 N methanolic HCl in a sealed vial under a nitrogen atmosphere at 100°C for 45 min. The resulting fatty acid methyl esters were extracted with hexane containing 0.05% butylated hydroxytoluene and then separated and quantified by capillary gas chromatography using a gas chromatograph (Hewlett Packard model 6890) equipped with a 30 m DB 225MS capillary column (J&W Scientific) and a flame ionization detector (Watkins et al 2001).
Anti-4-hydroxy-2-nonenal labeling
Lipid peroxidation was assayed in tissue sections (Albright et al 2004) using a monoclonal antibody that recognizes 4-hydroxy-2-nonenal (4-HNE) (Oxis Intl). Sites of 4-HNE were detected using AlexaFluor 594 donkey anti-mouse IgG (Molecular Probes) and liver slices were examined on a Nikon fluorescence microscope and digital images were captured and analyzed using NIH Image program 1.61. The integrated optical density of labeling was determined from n=10 measurements from each of three liver regions in liver slice per group.
Bromodeoxyuridine labeling
Mice were injected intraperitoneally with 50 mg/kg body weight 5-bromo-2’-deoxyuridine (BrdU, Sigma) dissolved in 1 ml of 7 mM sodium hydroxide in 0.9% sterile saline. After 2 h, the liver and spleen were isolated and fixed overnight in 10% buffered formalin (pH 7.4) and BrdU labeling (Zymed) was performed (Albright et al 1999). Liver and spleen were prepared on the same slide with the spleen serving as a positive control for BrdU labeling.
Caspase-3 activation assay
Caspase-3 rabbit polyclonal antibody and staurosporine (Cell Signaling Technology) was used to detect both full length and cleaved caspase-3 products. As positive controls for activated and non-activated caspase-3, confluent 3T3-L1 cells in DMEM-10% FBS on 10 cm dishes were treated for 1 h with 2 μM staurosporine (in DMSO) or DMSO alone. Cells were washed with PBS, scraped, immediately solublized in 1 ml of hot 2 × SDS sample buffer, sonicated briefly, boiled and centrifuged. Residual debris was removed by centrifugation. Livers from five WT and five Gpat1-/- female mice (2 mo old) were snap frozen, and small pieces of liver were excised frozen on a dry-ice cooled dissecting block. Samples were weighed and hot SDS sample buffer was added to normalize protein concentrations before sonication, boiling, and centrifugation as above. Approximately 50 μg of total protein from each control and tissue sample was run on 12.5% SDS PAGE gels, transferred to PVDF membranes, and blotted for β-actin and caspase-3.
TUNEL labeling
Apoptotic cells in liver were detected using terminal deoxynucleotidyl transferase (TdT)-mediated dUTP-digoxigenin anti-digoxigenin fluorescein conjugate antibody nick end-labeling (TUNEL) (Apoptag Plus Fluorescein In Situ Apoptosis Detection Kit, Serologicals), as described previously (Albright et al 1996). The entire liver section was examined and counts of TUNEL positive cells were normalized per 10 mm2 liver.
RNA isolation and RNase protection assays
RNA isolation and RNase protection were performed as previously described (Rusyn et al 2004). Briefly, liver total RNA was isolated from Gpat1-/- and wildtype mice using QuickPrep extraction kit (Amersham Pharmacia Biotech, Inc), followed by extraction with RNeasy total RNA (Qiagen). RNA quality was determined with Agilent Bio-Analyzer (Agilent Technologies). The expression of base excision DNA repair genes was measured by RNase protection assay using a RiboQuant multi-probe RNase protection assay kit (BD PharMingen). The repair genes selected for this study are representative genes along the pathway of base excision repair. The expression of individual gene transcripts was normalized to the housekeeping genes L32 and GAPDH and expressed in arbitrary units.
Glutathione S-transferase-p immunohistochemistry
The placental form of glutathione S-transferase (GST-p) was localized in liver slices using a polyclonal antibody (NCL-GSTpi, Vector Laboratories) using a modification of a published method (Divi et al 2001). Briefly, following deparaffinization and anti-retrieval, liver slices were incubated in rabbit anti-GST-p antibody (1:100) in PBST overnight at 4°C. Sites of GST-p were detected using AlexaFluor 594 (Molecular Probes Inc.) at 1:500 dilution for 2 h at room temperature. A negative control was prepared by replacing the primary antibody with non-immune serum; this resulted in no staining. Liver slices were counterstained with DAPI to identify nuclei. Measurement of the relative levels of GST-p staining was performed on a Nikon FXA microscope using epifluorescence and the NIH Image program version 1.61.
Statistics
Data were analyzed by Student’s t-test or ANOVA and are shown as the means ± standard errors.
Results
Liver mitochondria from Gpat1-/- mice have higher rates of ROS production and peroxidation
Compared to wildtype controls, fatty acid oxidation appears to be accelerated in liver from Gpat1-/- mice (Hammond et al 2005). Plasma from Gpat1-/- mice contains increased β-hydroxybutyrate, and the livers express higher mitochondrial HMG-CoA synthase mRNA and contain 2-fold more acylcarnitine and 60% less triacylglycerol compared to wildtype controls (Hammond et al 2005). Predicting that the increase in fatty acid oxidation would affect hepatic ROS production, we found a 20% increase in the production of the oxidized product of carboxy-DCFDA (slope: +/+, 8.03 ± 0.34; -/-, 10.78 ± 0.37; p<0.05). In addition, labeling of 4-HNE, a toxic protein- and DNA-reactive aldehyde product of arachidonate peroxidation (Toyokuni et al 1995), was 3-fold and ∼35% greater in livers from young and old Gpat1-/- mice, respectively, compared to age-matched controls (Figure 1), showing that the increased ROS resulted in increased peroxidation of unsaturated fatty acids.
Figure 1.
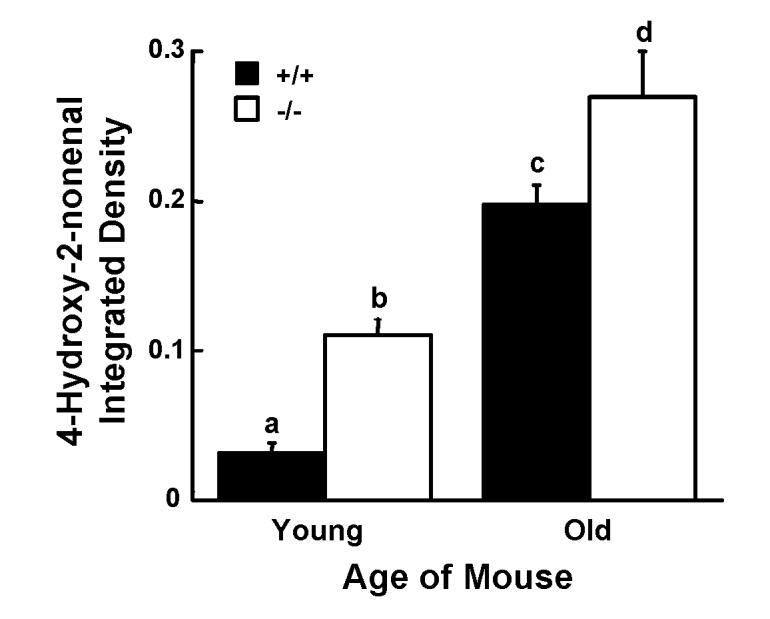
Immunoreactivity for 4-hydroxy-2-nonenal is increased in Gpat1-/- mice. Representative liver sections from 2-4 mo old (young) and 12-18 mo old (old) mice were probed with an antibody that recognizes 4-HNE. Levels of 4-HNE immunoreactivity were measured as described in the Materials and Methods. Increased levels of 4-HNE were found in Gpat1-/- livers in both age groups. Data are shown as means ± standard error for 4 mice per group. Columns identified with different letters differ significantly from each other (P < 0.01, ANOVA with Sheffe’s test).
Fatty acid composition of liver mitochondrial phospholipids is altered in Gpat1-/- mice
We previously reported that, compared to wildtype controls, total liver PC and PE from Gpat1-/- mice contain 20% less palmitate in the sn-1 position and about 40% more arachidonate in the sn-2 position (Hammond et al 2002). Because alterations in the fatty acid composition of the mitochondrial membrane phospholipids can specifically affect mitochondrial function (Hashimoto et al 2001; Pehowich 1999), we analyzed phospholipids from isolated mitochondria to determine whether the absence of GPAT1, a GPAT isoform located on the outer mitochondrial membrane, would result in more prominent changes in mitochondrial lipid species or composition. The mitochondrial content of the phospholipid species PE (+/+, 10230 ± 820; -/-, 8660 ± 760 nmol/g), PC (+/+, 8340 ±770; -/-, 9220 ±860 nmol/g), phosphatidylserine (PS) (+/+, 4060 ±720; -/-, 3420 ±340 nmol/g), and cardiolipin (+/+, 2870 ±270; -/-, 2910 ±240 nmol/g) did not differ significantly between genotypes. However, the fatty acid composition of each of these phospholipid species was markedly altered in the liver mitochondria in Gpat1-/- mice. Compared to wildtype mice, PE and PC in isolated liver mitochondria from Gpat1-/- mice contained 36 and 22% less 16:0, respectively, and had compensatory increases in 18:0 and 18:1n9 (Figures 2A and C). PE and PS contained 32% lower 22:6n3 (Figures 2A and E), but 20:4n6 content was 21% higher in PE, 67% higher in PC, and 45% higher in PS (Figures 2A, C, and E). The changes in 20:4n6 and 22:6n3 maintained a balance in overall PUFA (Figure 2A, B, E, F). In contrast, PC has increased 20:4n6 but no compensatory increase in 22:6n3. These changes were more dramatic than those previously measured in phospholipid species from total liver (Hammond et al 2002) and were reflected in the higher content of n6 fatty acids in all three phospholipids (Figures 2B, D, and F). Cardiolipin, which is normally highly enriched in 18:2, had a 44% increase in 18:1n9, but the compensatory decreases in 18:2n6 and 22:6n3 were not significant (Figure 2G). The total fatty acid classes reflected a compensated degree of saturation of the total phospholipid species (Figures 2B, D, F, and H).
Figure 2.

Liver mitochondrial phospholipid fatty acid composition is altered in Gpat1-/- mice. Liver mitochondrial phospholipid species from 2 mo old Gpat1-/- (n=4) and wildtype (n=5) were quantified as described in Materials and Methods. Only major fatty acids are presented. A) Selected PE fatty acids. B) PE fatty acid classes. C) Selected PC fatty acids. D) PC fatty acid classes. E) Selected PS fatty acids. F) PS fatty acid classes. G) Selected CL fatty acids. H) CL fatty acid classes. Data are shown as means ± standard error. Statistical significance was determined by Student’s t-test, * P< 0.05, ** P< 0.005, *** P< 0.001. Abbreviations: PE, phosphatidylethanolamine; PC, phosphatidylcholine; PS, phosphatidylserine; CL, cardiolipin; SFA, saturated fatty acid; MUFA, monounsaturated fatty acid; MPT, mitochondrial permeability transition pore; PUFA, polyunsaturated fatty acid.
Despite these alterations in mitochondrial phospholipid fatty acid composition, liver mitochondrial morphology was not affected in the Gpat1-/- mice (Figure 3). Light microscopy did not show infiltration by inflammatory cells (data not shown). As estimated by mitochondrial protein yield per gram of liver (wildtype, 18.7 ± 1.3 mg/g liver, n=11; Gpat1-/-, 17.0 ± 1.1 mg/g liver, n=11), mitochondrial quantity did not differ between genotypes. Although glycogen granules appeared more prominent in the wildtype hepatocytes, the glycogen content was similar (data not shown). Lipid droplets were less prominent in liver from 2 mo old Gpat1-/- mice, reflecting the 42% lower hepatic triacylglycerol content (Table I). The trend for lower triacylglycerol content in Gpat1-/- liver persisted in older animals.
Figure 3.
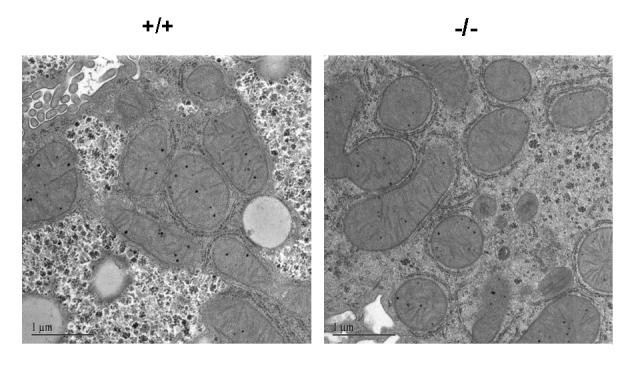
Liver mitochondria from Gpat1-/- mice have normal morphology. Representative electron microscopy images of liver mitochondria from 2 mo old Gpat1-/- and wildtype mice.
Table I.
Liver parameters for young (2-4 mo old) and old (12-18 mo old) Gpat1-/- and wildtype mice1.
| Young | Old | |||
|---|---|---|---|---|
| +/+ | -/- | +/+ | -/- | |
| Body weight (g) | 21.2 ± 0.4a (23) | 21.5 ± 0.4 a (15) | 33.4 ± 1.6 b (12) | 28.0 ± 0.8 c (8) |
| Liver weight (g) | 1.06 ± 0.03a (11) | 1.07 ± 0.03a (11) | 1.24 ± 0.05b (13) | 1.12 ± 0.04ab (8) |
| (mmol)TAG/g liver2 | 8.9 ± .5a (4) | 5.2 ± .9b (4) | 17.9 ± 3.3c (4) | 14.3 ± 3.1ac (4) |
| Total cell number/10 mm2 of liver | 26,690 ± 1,810 (4) | 24,530 ± 960 (4) | 25,680 ± 1,300 (4) | 25,380 ± 1,440 (4) |
Number of samples analyzed for each measurement are in parentheses. Data are presented as means ± standard error analyzed by Student’s t test. Values with different letters are significantly different, P < 0.05
Abbreviation: triacylglycerol (TAG).
Liver mitochondria from Gpat1-/- mice are more sensitive to Ca2+-induced mitochondrial permeability transition
The mitochondrial permeability transition (MPT), a common marker of mitochondrial dysfunction, occurs upon opening of high-conductance, nonspecific pores in the mitochondrial inner membrane (Kee et al 2003). Ca2+ induces the opening of the permeability transition pore, causing mitochondrial swelling, depolarization, and the release of cytochrome c and procaspases (Kim et al 2003). Because higher rates of ROS production can increase the sensitivity of the MPT (Kee et al 2003), we incubated fresh liver mitochondria from Gpat1-/- and wildtype mice in Mg2+-free medium containing inorganic phosphate and the respiratory substrate, succinate. To determine how much CaCl2 was required for MPT swelling, 50 μM boluses were added at 1 min intervals. For wildtype mitochondria, swelling began to occur with 250 μM CaCl2, whereas only 150 μM CaCl2 was required for Gpat1-/- mitochondria (data not shown). In a time course study with 100 μM CaCl2, the t½ for swelling was 20.6 ± 0.9 min for wildtype and 15.7 ± 0.9 min for Gpat1-/- for four independent experiments (P<0.005) (Figure 4A). At 200 μM CaCl2, the t½ average was 14.0 min for wildtype mice and 8.8 min for knockouts (n=2) (data not shown). TMRM, which is also present in the incubation buffer, is a cationic fluorophore that is taken up electrophoretically into the mitochondria in response to their negative membrane potential and quenches the fluorescence signal. Adding exogenous Ca2+ caused depolarization and increased TMRM fluorescence more rapidly in the Gpat1-/- mitochondria compared to wildtype (Figure 4B). At 100 μM CaCl2, the t½ was 22.8 ± 0.9 min for wildtype and 16.5 ± 1.2 for Gpat1-/- for four independent experiments; P<0.005. At 200 μM CaCl2 the average t½ was 14.3 min for wildtype and 9.1 min for Gpat1-/- mitochondria (n=2) (data not shown). After adding exogenous Ca2+, Fluo-5N fluorescence, a low-affinity Ca2+ indicator, increased in parallel with swelling and mitochondrial depolarization (Figure 4C). Taken together, these studies demonstrate that liver mitochondria from Gpat1-/- mice are more sensitive to Ca2+-induced opening of the permeability transition pore.
Figure 4.

Liver mitochondria from Gpat1-/- mice are more sensitive to Ca2+-induced mitochondrial permeability transition. Liver mitochondria (0.5 mg of protein/ml) from 2 mo old Gpat1-/- and wildtype mice were incubated in MPT buffer containing 1 μM TMRM and 1 μM Fluo-5N in 48-well microtiter plates. A) Absorbance change at 620 nm, B) TMRM fluorescence excited at 544 nm, and C) Fluo-5N excited at 485 nm were measured using fluorescence plate reader, as described in Materials and Methods. CaCl2 at 100 μM was added (arrow) after an initial 2 min baseline measurement. A representative experiment is shown (n=4). AU, arbitrary units.
Gpat1-/- mice exhibit increased hepatocellular apoptosis and proliferation
The number of apoptotic hepatocytes has been reported to increase (Koike et al 1998; Kujoth et al 2005; Muskhelishvili et al 1995), stay the same (Higami et al 1997; Youssef et al 2003), or decrease (Barnes et al 1998) in liver as rodents age, perhaps depending on the mouse or rat strain. Increases in ROS and 4-HNE can induce apoptosis (Kreuzer et al 1998), and because hepatic ROS production increases with aging, we predicted that older mice would have even greater rates of ROS production and increased hepatocyte apoptosis. To avoid the problem of differential lysis when fragile mitochondria are isolated from old mice, comparative studies between young (2-4 mo) versus old (14-18mo) Gpat1-/- and wildtype mice were performed on liver histological sections or whole tissue.
The TUNEL assay showed 3- and 15-fold greater numbers of apoptotic cells in livers from young and old Gpat1-/- mice, respectively, compared to age-matched wildtype mice (Figure 5A). In wildtype mice, we found that hepatocyte apoptosis rates were higher in the younger group. Despite the increased rate of apoptosis, both WT and Gpat1-/- liver samples showed similar amounts of only the full-length caspase-3 band, and the shorter, activated caspase-3 band was not detected (data not shown). At the same time, there was no difference between Gpat1-/- and wild type mice in the expression of base excision DNA repair genes (Table II). It has been demonstrated that expression of base excision DNA repair genes is a sensitive in vivo marker for oxidative stress-induced DNA damage (30). Thus, the increased apoptosis in the liver of Gpat1-/- mice appeared to be caspase-independent and was not a result of increased DNA damage due to mitochondrial oxidative stress.
Figure 5.

Apoptosis and BrdU labeling are increased in liver from Gpat1-/- mice. A) Representative liver slices were examined using a TUNEL assay as described in the Materials and Methods. Increased numbers of TUNEL-positive cells were found in Gpat1-/- liver sections from 2-4 mo old (young) and 12-18 mo old (old) mice compared to wildtype mice of the same ages. B) Liver slices were analyzed for the incorporation of BrdU as described in Materials and Methods. Increased numbers of BrdU labeled cells were found in Gpat1-/- liver sections from 2 mo old (young) and 12-18 mo old (old) mice compared to wildtype mice of the same ages. Data are shown as means ± standard error; columns identified with different letters differ significantly from each other (P < 0.01, ANOVA with Scheffe’s test).
Table II.
Expression of DNA repair genes in livers of Gpat1-/- and wildtype mice1.
| DNA repair gene | +/+ | -/- | P-value |
|---|---|---|---|
| Ogg12 | 6.2 ± 0.4 | 6.5 ± 0.5 | NS |
| Tdg | 9.1 ± 0.9 | 11.6 ± 0.8 | NS |
| Apex | 17.6 ± 0.6 | 23.1 ± 1.9 | NS |
| Ung | 6.8 ± 0.5 | 9.6 ± 1.9 | NS |
| Mpg | 6.6 ± 0.3 | 6.7 ± 0.3 | NS |
| Nth1 | 5.0 ± 0.2 | 6.7 ± 0.2 | NS |
| Mgmt | 22.6 ± 1.7 | 23.4 ± 0.7 | NS |
RNase protection assay of total RNA from liver from 12 mo old mice was performed as described in Materials and Methods. Data shown as mean ± standard error (from 5 to 6 animals/group) of relative expression of each gene normalized to the expression of the housekeeping genes L32 and GAPDH. NS, no statistically significant differences.
Gene abbreviations: (Ogg1) 8-oxoguanine DNA glycosylase, (Tdg) thymine DNA glycosylase, (Apex) apurinic/apyrimidinic endonuclease 1, (Ung) uracil DNA glycosylase, (Mpg) N-methylpurine DNA glycosylase, (Nth1) e ndonuclease III homolog 1, (Mgmt) O6-methylguanine-DNA methyltransferase.
Although the number of apoptotic cells in livers of Gpat1-/- mice was high, there were no differences in liver weight between genotypes, and assessment of liver cellularity revealed no age- or genotype-related differences in cell number per unit area of the tissue (Table 1). These features suggested that the increase in apoptosis was balanced by hepatocellular proliferation. This hypothesis was supported by data showing that BrdU labeling was 50% and 7-fold greater in livers from young and old Gpat1-/- mice, respectively, compared to age-matched controls (Figure 5B). BrdU-labeled cells were located predominantly in zones of liver demarcated by the portal tract region and central vein (data not shown). Based on their location the BrdU-labeled cells included both hepatocyte stem-type cells and mature hepatocytes, and they were further discriminated from mesenchymal cells on the basis of differences in size and shape (data not shown).
Gpat1-/- mice have decreased levels of hepatic GST-p
Increased proliferation in the absence of a compensatory increase in DNA repair might make Gpat1-/- livers more susceptible to neoplastic transformation. Because the intensity of expression of GST-p in single liver cells is strongly associated with the subsequent development of preneoplastic liver foci (Pitot and Sirica 1980), we investigated whether absent GPAT1 resulted in increased hepatic GST-p. The immunocytochemical assay showed a nearly 5-fold reduction in the level of GST-p protein in Gpat1-/- mice as compared to age-matched wildtype mice (Figure 6).
Figure 6.
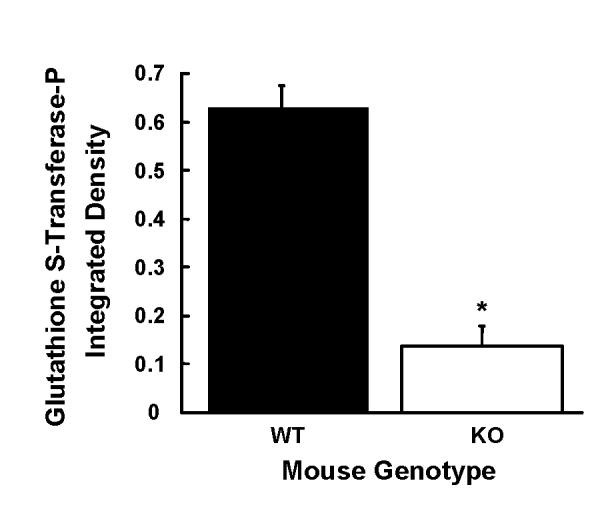
Glutathione S-transferase placental form is decreased in Gpat1-/- mice. Representative liver slices from 12-18 mo old mice were probed with an antibody that recognizes glutathione S-transferase placental form (GST-P) and the levels of GST-P immunoreactivity were measured as described in the Materials and Methods. Data are shown as means ± standard error. Decreased levels of GST-P were found in Gpat1-/- (P < 0.001; Student’s t-test).
Discussion
The location of GPAT1 on the outer mitochondrial membrane enables GPAT1 to compete with CPT-1 for long-chain acyl-CoAs. Both GPAT1 and CPT1 are reciprocally regulated by AMP-activated protein kinase (AMPK) which phosphorylates and inactivates acetyl-CoA carboxylase, thereby inhibiting the production of malonyl-CoA, an allosteric inhibitor of CPT-1 (Hardie and Carling 1997). AMPK also inhibits GPAT1 (Muoio et al 1999), although it is not known whether the inhibition is direct. In the absence of GPAT1, more acyl-CoA is partitioned towards the oxidative pathway. Thus, mice deficient in GPAT1 lack a counterbalance to the use of acyl-CoAs for fatty acid β-oxidation. The increases previously observed in liver medium-chain and long-chain acyl-carnitines and in β-hydroxybutyrate indicated that Gpat1-/- mice have an increased rate of fatty acid oxidation and suggested that they might produce more ROS (Hammond et al 2005). In addition, the presence of increased arachidonate in phospholipids from Gpat1-/- liver provided a target for peroxidation by the increased ROS, as demonstrated by the higher 4-HNE levels.
Aging is associated with a decline in mitochondrial function, possibly due to increasing exposure to endogenous oxidants (Sugrue and Tatton 2001). Elderly people have a 40% reduction in mitochondrial oxidative phosphorylation activity (Petersen et al 2003), and it has been hypothesized that mitochondrial dysfunction plays an important role in the development of diabetes (Schrauwen and Hesselink 2004) and cancer (Green and Kroemer 2004). ROS damage DNA, protein and lipids, and play a significant role in age-associated mitochondrial dysfunction (Sastre et al 2003), and changes in mitochondrial function have also been induced by altering the fat content of the diet (Battino et al 2002; Iossa et al 2003; Nogueira et al 2001; Pehowich 1999). Altered mitochondrial function has been implicated in the development of diabetes, but the differences in insulin sensitivity observed in Gpat1-/- mice fed varying fatty acid species (Hammond et al 2005; Neschen et al 2005) is most likely a reflection of differences in the accumulation of toxic lipid intermediates.
Unlike studies that require aging or dietary manipulation to induce mitochondrial dysfunction, functional differences were already present in the chow-fed Gpat1-/- mice at 2 mo. The liver mitochondria from young Gpat1-/- mice had major alterations in phospholipid fatty acid composition, faster rates of change in membrane potential during mitochondrial swelling, and increased sensitivity to the induction of the MPT. Increased ROS production in liver mitochondria from young Gpat1-/- mice was demonstrated by a 20% faster rate of production of the oxidized product of carboxy-DCFDA and a marked increase in 4-HNE.
In Gpat1-/- mice, increased production of ROS and chronic oxidative stress are likely to result from unregulated fatty acid oxidation. The presence of GPAT1 at the outer mitochondrial membrane would normally temper the amount of fatty acyl-CoA that is converted to acyl-carnitine to enter the mitochondria for oxidation. Even on a diet containing only 14% triacylglycerol, Gpat1-/- mice had elevated plasma β-hydroxybutyrate, and increased liver long-chain acyl-carnitines and dicarboxylic acids, suggesting excess oxidation of fatty acids (Hammond et al 2005).
Excess fatty acid oxidation increases ROS production in several models, including hearts from mice with cardiac-restricted overexpression of PPARα (Finck et al 2003), heart-specific ACSL1 overexpression (Chiu et al 2001), and leptin stimulation of fatty acid oxidation in bovine aortic endothelial cells (Yamagishi et al 2001). In Gpat1-/- mice, the effect of increased ROS production may have caused a greater increase in lipid oxidation because of the altered fatty acid composition of mitochondrial phospholipids. Unlike other GPAT isoforms in liver, the mitochondrial isoform exhibits a strong preference for 16:0-CoA (Coleman and Lee 2004; Lewin et al 2004). When GPAT1 was absent, the major mitochondrial phospholipids PE and PC contained 36 and 22% less 16:0 than wildtype mice, respectively, and had compensatory increases in 18:0 and 18:1. In addition, PE, PC and PS from Gpat1-/- liver mitochondria contained 21-67% more arachidonic acid than present in wildtype mitochondrial phospholipids, probably because alteration at the sn-1 position of phospholipids influences the fatty acids species esterified at the sn-2 position. The higher content of arachidonic acid provides increased substrate for ROS attack and likely contributes to the higher 4-HNE labeling in Gpat1-/- liver from both young and old mice. Interestingly, 22:6n3 was lower in PS and PE, thereby maintaining a balance in total PUFA.
Increased hepatocyte apoptosis in Gpat1-/- mice might occur from mitochondrial dysfunction or from increased oxidative stress. High concentrations of 4-HNE are known to induce the activation of caspase-3 and JNK and the phosphorylation of c-Jun in HeLa cells (Awasthi et al 2003), and to cause both HeLa cells and HL-60 cells to undergo apoptosis (Awasthi et al 2003; Kreuzer et al 1998). On the other hand, low concentrations of 4-HNE in some cell types protect against apoptosis and promote growth (Awasthi et al 2003). Surprisingly, Gpat1-/- hepatocytes showed a concomitant increase in their proliferative rate that appeared to compensate for cell loss due to apoptosis and caspase-3 activation remained similar in WT and Gpat1-/- liver. Although less well understood than caspase-dependent pathways of apoptosis, caspase-independent apoptosis has been described in hepatocytes (Jones et al 2000).
The liver histology in Gpat1-/- mice differ from that of hepatocellular injury in alcoholic liver disease or following exposure to carbon tetrachloride, in which widespread hepatocellular apoptosis, necrosis, fibrosis, and activation and recruitment of monocyte-macrophages play important roles. In our studies there was no apparent monocyte-macrophage infiltration of liver and, thus, no apparent engulfment of TUNEL-positive apoptotic cells by macrophages. Over a wide range of physiological concentrations, 4-HNE decreases IL-6 expression and protein production by rat Kupffer cells (Luckey et al 2002). Hence, it is conceivable that the increased levels of 4-HNE we found in young and old mice, while sufficient to induce apoptosis, may also down-regulate macrophage recruitment.
Our data suggest that the absence of GPAT1 may lower apoptotic potential despite the increase in ROS generation. While ROS-induced oxidative damage can compromise cell survival, this is not obligatory, particularly when considered in the context of aging. Chronic exposure of cells to low amounts of oxidative stress induce resistance to higher subsequent amounts that would ordinarily cause apoptosis (Zeisel et al 1997), similar to our findings in Gpat1-/- vs. wildtype mice. Although the relationship between the functional status of GPAT1 and aging in hepatocytes is not known, data on aging and oxidative stress are pertinent. For example, fibroblasts from patients with Alzheimer’s disease exhibit decreased activation of p53 and bax, proteins that regulate cell cycle progression and apoptosis and accelerate entry into S-phase without changing the extent of oxidative stress (Uberti et al 2002). This report is reminiscent of our findings of increased BrdU labeling despite increased ROS generation in old Gpat1-/- vs. wildtype mice. The regulation of cell proliferation by 4-HNE involves modulating proliferative signals and intracellular mediators that control cell cycle transit. Further, activated EGFR signaling counteracts ROS-mediated hepatocyte apoptosis and restores DNA synthetic activity in the absence of added antioxidants (Albright et al 2005.). In contrast, our findings of decreased BrdU labeling in aged vs. young wildtype liver are consistent with the notion of an age-associated decline in EGFR tyrosine phosphorylation, previously reported in rat liver hepatocytes (Ikeyama et al 2003).
In liver from Gpat1-/- mice cell proliferation and apoptosis were in balance and there was no net difference in liver weight or cell number for up to 18 months of age. Further, longevity to 24 months was similar in Gpat1-/- and wildtype mice. Unlike most studies in which hepatocellular proliferation is accompanied by elevated GST-p expression, GST-p expression was suppressed in livers from Gpat1-/- mice. The diminished number of GST-p positive cells suggests a novel dissociation between cell proliferation and the development of putative preneoplastic lesions in these mice. Although we have not observed liver tumors in older Gpat1-/- mice, the C57Bl/6 strain is resistant to liver tumor formation (Goldsworthy and Fransson-Steen 2002). It would be interesting to learn whether inhibiting GPAT1 or whether a deficiency of GPAT1 in a susceptible mouse strain alters susceptibility to the development of hepatic tumors.
Mitochondrial function is affected by membrane composition, and the decline in mitochondrial function that occurs with aging is associated with decreased membrane fluidity (Ames et al 1995). Because the specific activity of liver GPAT1 is normally 40% lower in old rats compared to young rats (Kannan et al 2003), this decline in GPAT1 activity with age might accelerate fatty acid oxidation and contribute to the increase in ROS production and mitochondrial dysfunction. In the null animals, the absence of GPAT1 resulted in increases in arachidonate content of the major mitochondrial phospholipids and an apparent increase in fatty acid oxidation. These changes were associated with increased ROS production and by an increased sensitivity to induction of MPT pore opening. The increased ROS production and MPT sensitivity did not require dietary manipulation or extended aging. These features suggest that the Gpat1-/- mouse may be a useful model in which to study novel relationships between hepatic mitochondrial dysfunction, oxidative stress, apoptosis, proliferation, and cancer susceptibility.
Glossary
Abbreviations used:
- BrdU
5-bromo-2’-deoxyuridine
- CCCP
carbonyl cyanide p-chlorophenylhydrazone
- carboxy-DCFDA
(5-and-6)-chloromethyl-2’,7’-dichlorodihydrofluorescein diacetate acetyl ester
- GST
glutathione transferase
- 4-HNE
4-hydroxy-2-nonenal
- GPAT1
mitochondrial glycerol-3-phosphate acyltransferase-1
- MPT
mitochondrial permeability transition
- PC
phosphatidylcholine
- PE
phosphatidylethanolamine
- PS
phosphatidylserine
- ROS
reactive oxygen species
- TMRM
tetramethylrhodamine methyl ester
- TUNEL
terminal dUTP nick end labeling
Footnotes
This work was supported by National Institutes of Health grants R01 DK56598 (RAC), F31 GM20920 (LEH), P01 DK59340 (JJL), DK37034 (JJL), ES11391 (IR), and ES11660 (IR), the Association for International Cancer Research (CDA), and National Cancer Institute grant CA16086 to the Lineberger Comprehensive Cancer Core Facility
Publisher's Disclaimer: This is a PDF file of an unedited manuscript that has been accepted for publication. As a service to our customers we are providing this early version of the manuscript. The manuscript will undergo copyediting, typesetting, and review of the resulting proof before it is published in its final citable form. Please note that during the production process errors may be discovered which could affect the content, and all legal disclaimers that apply to the journal pertain.
References
- Albright CD, da Costa KA, Craciunescu CN, Klem E, Mar MH, Zeisel SH. Regulation of choline deficiency apoptosis by epidermal growth factor in CWSV-1 rat hepatocytes. Cell. Physiol. Biochem. 2005;15:59–68. doi: 10.1159/000083653. [DOI] [PMC free article] [PubMed] [Google Scholar]
- Albright CD, Friedrich CB, Brown EC, Mar MH, Zeisel SH. Maternal dietary choline availability alters mitosis, apoptosis and the localization of TOAD-64 protein in the developing fetal rat septum. Brain Res. Dev. Brain Res. 1999;115:123–129. doi: 10.1016/s0165-3806(99)00057-7. [DOI] [PubMed] [Google Scholar]
- Albright CD, Liu R, Bethea TC, Da Costa KA, Salganik RI, Zeisel SH. Choline deficiency induces apoptosis in SV40-immortalized CWSV-1 rat hepatocytes in culture. FASEB J. 1996;10:510–516. doi: 10.1096/fasebj.10.4.8647350. [DOI] [PubMed] [Google Scholar]
- Albright CD, Salganik RI, Van Dyke T. Dietary depletion of vitamin E and vitamin A inhibits mammary tumor growth and metastasis in transgenic mice. J. Nutr. 2004;134:1139–1144. doi: 10.1093/jn/134.5.1139. [DOI] [PubMed] [Google Scholar]
- Ameen C, Linden D, Larsson BM, Mode A, Holmang A, Oscarsson J. Effects of gender and GH secretory pattern on sterol regulatory element-binding protein-1c and its target genes in rat liver. Am. J. Physiol. Endocrinol. Metab. 2004;287:E1039–1048. doi: 10.1152/ajpendo.00059.2004. [DOI] [PubMed] [Google Scholar]
- Ames BN, Shigenaga MK, Hagen TM. Mitochondrial decay in aging. Biochim. Biophys. Acta. 1995;1271:165–170. doi: 10.1016/0925-4439(95)00024-x. [DOI] [PubMed] [Google Scholar]
- Awasthi YC, Sharma R, Cheng JZ, Yang Y, Sharma A, Singhal SS, Awasthi S. Role of 4-hydroxynonenal in stress-mediated apoptosis signaling. Mol. Aspects Med. 2003;24:219–30. doi: 10.1016/s0098-2997(03)00017-7. [DOI] [PubMed] [Google Scholar]
- Barnes CJ, Hardman WE, Maze GL, Lee M, Cameron IL. Age-dependent sensitization to oxidative stress by dietary fatty acids. Aging. 1998;10:455–462. doi: 10.1007/BF03340159. [DOI] [PubMed] [Google Scholar]
- Battino M, Quiles JL, Huertas JR, Ramirez-Tortosa MC, Cassinello M, Manas M, Lopez-Frias M, Mataix J. Feeding fried oil changes antioxidant and fatty acid pattern of rat and affects rat liver mitochondrial respiratory chain components. J. Bioenerg. Biomembr. 2002;34:127–134. doi: 10.1023/a:1015128009826. [DOI] [PubMed] [Google Scholar]
- Bell RM, Coleman RA. Enzymes of triacylglycerol formation in mammals. In: Boyer PD, editor. The Enzymes. XVI. Academic Press; New York: 1983. pp. 87–112. [Google Scholar]
- Bernardi P. Mitochondrial transport of cations: channels, exchangers, and permeability transition. Physiol. Rev. 1999;79:1127–1155. doi: 10.1152/physrev.1999.79.4.1127. [DOI] [PubMed] [Google Scholar]
- Blattner JR, He L, Lemasters JJ. Screening assays for the mitochondrial permeability transition using a fluorescence multiwell plate reader. Anal. Biochem. 2001;295:220–226. doi: 10.1006/abio.2001.5219. [DOI] [PubMed] [Google Scholar]
- Chiu H-C, Kovacs A, Ford DA, Hsu F-F, Garcia R, Herrero P, Saffitz JE, Schaffer JE. A novel mouse model of lipotoxic cardiomyopathy. J. Clin. Invest. 2001;107:813–822. doi: 10.1172/JCI10947. [DOI] [PMC free article] [PubMed] [Google Scholar]
- Coleman RA, Lee DP. Enzymes of triacylglycerol synthesis and their regulation. Prog. Lipid Res. 2004;43:134–176. doi: 10.1016/s0163-7827(03)00051-1. [DOI] [PubMed] [Google Scholar]
- Dallner G, Siekevitz P, Palade GE. Biogenesis of endoplasmic reticulum membranes. II. Synthesis of constitutive microsomal enzymes in developing rat hepatocyte. J. Cell Biol. 1966;30:97–117. doi: 10.1083/jcb.30.1.97. [DOI] [PMC free article] [PubMed] [Google Scholar]
- Divi RL, Dragan YP, Pitot HC, Poirier MC. Immunohistochemical localization and semi-quantitation of hepatic-DNA adducts in rats exposed orally to tamoxifen. Carcinogenesis. 2001;22:1693–1699. doi: 10.1093/carcin/22.10.1693. [DOI] [PubMed] [Google Scholar]
- Finck BN, Han X, Courtois M, Aimond F, Nerbonne JM, Kovacs A, Gross RW, Kelly DP. A critical role for PPARalpha-mediated lipotoxicity in the pathogenesis of diabetic cardiomyopathy: modulation by dietary fat content. Proc. Natl. Acad. Sci. U. S. A. 2003;100:1226–1231. doi: 10.1073/pnas.0336724100. [DOI] [PMC free article] [PubMed] [Google Scholar]
- Folch J, Lees M, Stanley GHS. A simple method for the isolation and purification of total lipides from animal tissues. J. Biol. Chem. 1957;226:497. [PubMed] [Google Scholar]
- Goldsworthy TL, Fransson-Steen R. Quantitation of the cancer process in C57BL/6J, B6C3F1 and C3H/HeJ mice. Toxicol. Pathol. 2002;30:97–105. doi: 10.1080/01926230252824770. [DOI] [PubMed] [Google Scholar]
- Gornall AG, Bardawill CJ, David MM. Determination of serum proteins by means of the biuret reaction. J. Biol. Chem. 1949;177:751–766. [PubMed] [Google Scholar]
- Green DR, Kroemer G. The pathophysiology of mitochondrial cell death. Science. 2004;305:626–629. doi: 10.1126/science.1099320. [DOI] [PubMed] [Google Scholar]
- Hammond LE, Gallagher PA, Wang S, Posey-Marcos E, Hiller S, Kluckman K, Maeda N, Coleman RA. Mitochondrial glycerol-3-phosphate acyltransferase-deficient mice have reduced weight and liver triacylglycerol content and altered glycerolipid fatty acid composition. Mol. Cell. Biol. 2002;22:8204–8214. doi: 10.1128/MCB.22.23.8204-8214.2002. [DOI] [PMC free article] [PubMed] [Google Scholar]
- Hammond LE, Neschen S, Romanelli AJ, Cline GW, Ilkayeva OR, Shulman GI, Muoio DM, Coleman RA. Mitochondrial glycerol-3-phosphate acyltransferase-1 is essential in liver for the metabolism of excess acyl-CoAs. J. Biol. Chem. 2005;280:25629–25636. doi: 10.1074/jbc.M503181200. [DOI] [PubMed] [Google Scholar]
- Hardie DG, Carling D. The AMP-activated protein kinase, Fuel gauge of the mammalian cell. Eur. J. Biochem. 1997;246:259–273. doi: 10.1111/j.1432-1033.1997.00259.x. [DOI] [PubMed] [Google Scholar]
- Hashimoto M, Shahdat MH, Shimada T, Yamasaki H, Fujii Y, Ishibashi Y, Shido O. Relationship between age-related increases in rat liver lipid peroxidation and bile canalicular plasma membrane fluidity. Exp. Gerontol. 2001;37:89–97. doi: 10.1016/s0531-5565(01)00164-4. [DOI] [PubMed] [Google Scholar]
- Higami Y, Shimokawa I, Okimoto T, Tomita M, Yuo T, Ikeda T. Effect of aging and dietary restriction on hepatocyte proliferation and death in male F344 rats. Cell Tissue Res. 1997;288:69–77. doi: 10.1007/s004410050793. [DOI] [PubMed] [Google Scholar]
- Ikeyama S, Kokkonen G, Martindale JL, Wang XT, Gorospe M, Holbrook NJ. Effects of aging and calorie restriction of Fischer 344 rats on hepatocellular response to proliferative signals. Exp. Gerontol. 2003;38:431–439. doi: 10.1016/s0531-5565(02)00239-5. [DOI] [PubMed] [Google Scholar]
- Iossa S, Lionetti L, Mollica MP, Crescenzo R, Botta M, Barletta A, Liverini G. Effect of high-fat feeding on metabolic efficiency and mitochondrial oxidative capacity in adult rats. Br. J. Nutr. 2003;90:953–960. doi: 10.1079/bjn2003000968. [DOI] [PubMed] [Google Scholar]
- Jones BE, Lo CR, Liu H, Srinivasan A, Streetz K, Valentino KL, Czaja MJ. Hepatocytes sensitized to tumor necrosis factor-alpha cytotoxicity undergo apoptosis through caspase-dependent and caspase-independent pathways. J. Biol. Chem. 2000;275:705–712. doi: 10.1074/jbc.275.1.705. [DOI] [PubMed] [Google Scholar]
- Kannan L, Knudsen J, Jolly CA. Aging and acyl-CoA binding protein alter mitochondrial glycerol-3-phosphate acyltransferase activity. Biochim. Biophys. Acta. 2003;1631:12–16. doi: 10.1016/s1388-1981(02)00367-0. [DOI] [PubMed] [Google Scholar]
- Kee HJ, Koh JT, Yang SY, Lee ZH, Baik YH, Kim KK. A novel murine long-chain acyl-CoA synthetase expressed in brain participates in neuronal cell proliferation. Biochem. Biophys. Res. Commun. 2003;305:925–933. doi: 10.1016/s0006-291x(03)00859-3. [DOI] [PubMed] [Google Scholar]
- Kim JS, He L, Lemasters JJ. Mitochondrial permeability transition: a common pathway to necrosis and apoptosis. Biochem. Biophys. Res. Commun. 2003;304:463–470. doi: 10.1016/s0006-291x(03)00618-1. [DOI] [PubMed] [Google Scholar]
- Koike K, Moriya K, Yotsuyanagi H, Shintani Y, Fujie H, Tsutsumi T, Kimura S. Compensatory apoptosis in preneoplastic liver of a transgenic mouse model for viral hepatocarcinogenesis. Cancer Lett. 1998;134:181–186. doi: 10.1016/s0304-3835(98)00252-3. [DOI] [PubMed] [Google Scholar]
- Kreuzer T, Grube R, Wutte A, Zarkovic N, Schaur RJ. 4-Hydroxynonenal modifies the effects of serum growth factors on the expression of the c-fos proto-oncogene and the proliferation of HeLa carcinoma cells. Free Radic. Biol. Med. 1998;25:42–49. doi: 10.1016/s0891-5849(98)00029-x. [DOI] [PubMed] [Google Scholar]
- Kujoth GC, Hiona A, Pugh TD, Someya S, Panzer K, Wohlgemuth SE, Hofer T, Seo AY, Sullivan R, Jobling WA, Morrow JD, Van Remmen H, Sedivy JM, Yamasoba T, Tanokura M, Weindruch R, Leeuwenburgh C, Prolla TA. Mitochondrial DNA mutations, oxidative stress, and apoptosis in mammalian aging. Science. 2005;309:481–484. doi: 10.1126/science.1112125. [DOI] [PubMed] [Google Scholar]
- Lemasters JJ, Grunwald R, Emaus RK. Thermodynamic limits to the ATP/site stoichiometries of oxidative phosphorylation by rat liver mitochondria. J. Biol. Chem. 1984;259:3058–3063. [PubMed] [Google Scholar]
- Lewin TM, Schwerbrock NMJ, Lee DP, Coleman RA. Identification of a new glycerol-3-phosphate acyltransferase isoenzyme, mtGPAT2, in mitochondria. J. Biol. Chem. 2004;279:13488–13495. doi: 10.1074/jbc.M314032200. [DOI] [PubMed] [Google Scholar]
- Lewin TM, Wang S, Nagle CA, Van Horn CG, Coleman RA. Mitochondrial glycerol-3-phosphate acyltransferase-1 directs the metabolic fate of exogenous fatty acids in hepatocytes. Am. J. Physiol. Endocrinol. Metab. 2005;288:E835–E844. doi: 10.1152/ajpendo.00300.2004. [DOI] [PubMed] [Google Scholar]
- Lindén D, William-Olsson L, Rhedin M, Asztély A-K, Clapham JC, Schreyer S. Overexpression of mitochondrial glycerol-3-phosphate acyltransferase in rat hepatocytes leads to decreased fatty acid oxidation and increased glycerolipid biosynthesis. J. Lipid Res. 2004;45:1279–1288. doi: 10.1194/jlr.M400010-JLR200. [DOI] [PubMed] [Google Scholar]
- Luckey SW, Taylor M, Sampey BP, Scheinman RI, Petersen DR. Hydroxynonenal decreases interleukin-6 expression and protein production in primary rat Kupffer cells by inhibiting nuclear factor-B activation. J. Pharmacol. Exp. Ther. 2002;302:296–303. doi: 10.1124/jpet.102.033522. [DOI] [PubMed] [Google Scholar]
- Muoio DM, Seefield K, Witters L, Coleman RA. AMP-activated kinase (AMPK) reciprocally regulates triacylglycerol synthesis and fatty acid oxidation in liver and muscle: Evidence that sn-glycerol-3-phosphate acyltransferase is novel target. Biochem. J. 1999;338:783–791. [PMC free article] [PubMed] [Google Scholar]
- Muskhelishvili L, Hart RW, Turturro A, James SJ. Age-related changes in the intrinsic rate of apoptosis in livers of diet-restricted and ad libitum-fed B6C3F1 mice. Am. J. Pathol. 1995;147:20–24. [PMC free article] [PubMed] [Google Scholar]
- Neschen S, Morino K, Hammond LE, Zhang D, Liu ZX, Romanelli AJ, Cline GW, Pongratz RL, Zhang XM, Choi CS, Coleman RA, Shulman GI. Prevention of hepatic steatosis and hepatic insulin resistance in mitochondrial acyl-CoA:glycerol-sn-3-phosphate acyltransferase 1 knock out mice. Cell Metab. 2005;2:55–65. doi: 10.1016/j.cmet.2005.06.006. [DOI] [PubMed] [Google Scholar]
- Nogueira V, Piquet MA, Devin A, Fiore C, Fontaine E, Brandolin G, Rigoulet M, Leverve XM. Mitochondrial adaptation to in vivo polyunsaturated fatty acid deficiency: increase in phosphorylation efficiency. J. Bioenerg. Biomembr. 2001;33:53–61. doi: 10.1023/a:1005624707780. [DOI] [PubMed] [Google Scholar]
- Park H, Kaushik VK, Constant S, Prentki M, Przybytkowski E, Ruderman NB, Saha AK. Coordinate regulation of malonyl-CoA decarboxylase, sn-glycerol-3-phosphate acyltransferase, and acetyl-CoA carboxylase by AMP-activated protein kinase in rat tissues in response to exercise. J. Biol. Chem. 2002;277:32571–3257. doi: 10.1074/jbc.M201692200. [DOI] [PubMed] [Google Scholar]
- Pehowich DJ. Thyroid hormone status and membrane n-3 fatty acid content influence mitochondrial proton leak. Biochim. Biophys. Acta. 1999;1411:192–200. doi: 10.1016/s0005-2728(99)00041-9. [DOI] [PubMed] [Google Scholar]
- Petersen KF, Befroy D, Dufour S, Dziura J, Ariyan C, Rothman DL, DiPietro L, Cline GW, Shulman GI. Mitochondrial dysfunction in the elderly: possible role in insulin resistance. Science. 2003;300:1140–1142. doi: 10.1126/science.1082889. [DOI] [PMC free article] [PubMed] [Google Scholar]
- Pitot HC, Sirica AE. The stages of initiation and promotion in hepatocarcinogenesis. Biochem. Biophys. Acta. 1980;605:191–215. doi: 10.1016/0304-419x(80)90004-9. [DOI] [PubMed] [Google Scholar]
- Russell LK, Finck BN, Kelly DP. Mouse models of mitochondrial dysfunction and heart failure. J. Mol. Cell. Cardiol. 2005;38:81–91. doi: 10.1016/j.yjmcc.2004.10.010. [DOI] [PubMed] [Google Scholar]
- Rusyn I, Asakura S, Pachkowski B, Bradford BU, Denissenko MF, Peters JM, Holland SM, Reddy JK, Cunningham ML, Swenberg JA. Expression of base excision DNA repair genes is a sensitive biomarker for in vivo detection of chemical-induced chronic oxidative stress: identification of the molecular source of radicals responsible for DNA damage by peroxisome proliferators. Cancer Res. 2004;64:1050–1057. doi: 10.1158/0008-5472.can-03-3027. [DOI] [PubMed] [Google Scholar]
- Sastre J, Pallardo FV, Vina J. The role of mitochondrial oxidative stress in aging. Free Radic. Biol. Med. 2003;35:1–8. doi: 10.1016/s0891-5849(03)00184-9. [DOI] [PubMed] [Google Scholar]
- Schrauwen P, Hesselink MK. Oxidative capacity, lipotoxicity, and mitochondrial damage in type 2 diabetes. Diabetes. 2004;53:1412–1417. doi: 10.2337/diabetes.53.6.1412. [DOI] [PubMed] [Google Scholar]
- Sugrue MM, Tatton WG. Mitochondrial membrane potential in aging cells. Biol. Signals Recept. 2001;10:176–188. doi: 10.1159/000046886. [DOI] [PubMed] [Google Scholar]
- Toyokuni S, Okamoto K, Yodoi J, Hiai H. Persistent oxidative stress in cancer. FEBS Lett. 1995;358:1–3. doi: 10.1016/0014-5793(94)01368-b. [DOI] [PubMed] [Google Scholar]
- Uberti D, Carsana T, Bernardi E, Rodella L, Grigolato P, Lanni C, Racchi M, Govoni S, Memo M. Selective impairment of p53-mediated cell death in fibroblasts from sporadic Alzheimer′s disease patients. J. Cell Sci. 2002;115:3131–3138. doi: 10.1242/jcs.115.15.3131. [DOI] [PubMed] [Google Scholar]
- Watkins SM, Lin TY, Davis RM, Ching JR, DePeters EJ, Halpern GM, Walzem RL, German JB. Unique phospholipid metabolism in mouse heart in response to dietary docosahexaenoic or alpha-linolenic acids. Lipids. 2001;36:247–254. doi: 10.1007/s11745-001-0714-8. [DOI] [PubMed] [Google Scholar]
- Yamagishi SI, Edelstein D, Du XL, Kaneda Y, Guzman M, Brownlee M. Leptin induces mitochondrial superoxide production and monocyte chemoattractant protein-1 expression in aortic endothelial cells by increasing fatty acid oxidation via protein kinase A. J. Biol. Chem. 2001;276:25096–25100. doi: 10.1074/jbc.M007383200. [DOI] [PubMed] [Google Scholar]
- Youssef JA, Bouziane M, Badr MZ. Age-dependent effects of nongenotoxic hepatocarcinogens on liver apoptosis in vivo. Mech. Ageing Dev. 2003;124:333–340. doi: 10.1016/s0047-6374(02)00189-6. [DOI] [PubMed] [Google Scholar]
- Zeisel SH, Albright CD, Shin OH, Mar MH, Salganik RI, da Costa KA. Choline deficiency selects for resistance to p53-independent apoptosis and causes tumorigenic transformation of rat hepatocytes. Carcinogenesis. 1997;18:731–738. doi: 10.1093/carcin/18.4.731. [DOI] [PubMed] [Google Scholar]