

Abstract
Motivation
The study of interactomes, or networks of protein-protein interactions, is increasingly providing valuable information on biological systems. Here we report a study of cancer proteins in an extensive human protein-protein interaction network constructed by computational methods.
Results
We show that human proteins translated from known cancer genes exhibit a network topology that is different from that of proteins not documented as being mutated in cancer. In particular, cancer proteins show an increase in the number of proteins they interact with. They also appear to participate in central hubs rather than peripheral ones, mirroring their greater centrality and participation in networks that form the backbone of the proteome. Moreover, we show that cancer proteins contain a high ratio of highly promiscuous structural domains, i.e., domains with a high propensity for mediating protein interactions. These observations indicate an underlying evolutionary distinction between the two groups of proteins, reflecting the central roles of proteins, whose mutations lead to cancer.
1 INTRODUCTION
The availability of high-throughput experimental data has allowed construction of increasingly comprehensive and accurate protein-protein interaction networks. Initial network studies were performed on yeast (Uetz et al., 2000; Ito et al., 2001; Ho et al., 2002; Gavin et al., 2002) but more complex organisms are gradually being surveyed (Giot et al., 2002; Li et al., 2004). The structure, or topology, of such networks not only sheds light on the complex cellular mechanisms and processes, but also gives insight into evolutionary aspects of the proteins involved (Jeong et al., 2001; Fraser et al., 2002; Bu et al., 2003; Wuchty, 2004; Calvano et al., 2005).
Charting interaction maps of entire genomes is undoubtedly useful for improved understanding of cellular function, especially once they have been integrated with a wider collection of biological data. It is now possible to map a number of different attributes, or data types, onto interactomes. Examples of such are microarray expression data (Ideker et al., 2002; Sohler et al., 2004; de Lichtenberg et al., 2005), gene ontology (Formstecher et al., 2005), structural information (Dunker et al., 2005) and domain composition (Riley et al., 2005; Wuchty and Almaas, 2005).
Studies focusing on the human interactome have thus far been limited due to lack of reliable and comprehensive experimental data. To compensate for this, several computational methods have been developed with the aim of predicting protein-protein interactions. One approach is based on the principle of orthologous interactions described by Matthews et al. (2001), which was subsequently implemented (Lehner and Fraser, 2004; Brown and Jurisica, 2005) and further extended with the development of a confidence scoring function for interactions (Jonsson et al., 2006).
Based on our previous approach, we report an extensive genome-wide study of cancer and non-cancer proteins integrated into a carefully validated protein-protein interaction network of human proteins. Wachi et al. (2005) have reported increased interaction connectivity in differentially expressed proteins in lung cancer tissues. However, a comprehensive study of the interaction attributes of all known predisposing human cancer genes has not previously been attempted. In this study we examined the connectivity of proteins known to be susceptible to mutations leading to cancer (Furteal et al., 2004). In addition to statistical analysis of the network properties of cancer proteins, we utilized a clustering method aimed at highlighting proteins in centrally connected hubs that form the backbone of the interactome.
We show that cancer proteins display a global topology significantly different from non-cancer proteins, indicating an increased central role of cancer proteins within the interactome.
2 METHODS
2.1 Construction of the human interactome
Networks of interacting proteins were constructed for the entire human genome using an orthology-based method described by Jonsson et al. (2006). One of the benefits of the orthologous approach is the reduced noise in protein interaction data which allows predictions of interactions that would not have been detected in a single species (Sharan et al., 2005). In short, the method identifies putative interactions based on homology to experimentally determined interactions in a range of different species. BLAST searches were run for the human genome as documented in version 9 of the Reference Sequence Database (Pruitt et al., 2005) against all proteins in the DIP (Salwinski et al., 2004) and MIPS Mammalian Protein-Protein Interaction databases (Pagel et al., 2005). The putative interactions were given confidence scores based on two factors: the level of homology to proteins found experimentally to interact and the amount of experimental data available. The confidence score, S, is given by
| (1) |
where sai and sbi are sequence similarity bit scores to proteins ai and bi, respectively, which have experimentally been shown to interact; n is the number of experiments linking protein ai to protein bi and N is the total number of instances where the same pair of proteins is identified as interacting through different homologues. The complete interactome data are available in the Supplementary Material.
2.2. ROC curve analysis
Data were analysed by sensitivity and specificity derived from the receiver operating characteristic (ROC) curve, and area under the curve. The receiver operating characteristic analysis builds on the outcome of the prediction, in particular on the rates of true and false positive identification of interaction (TP and FP, respectively). True positive interactions were sourced from the Human Protein Reference Database, Version 13 (Peri et al., 2003). Interactions were classified as false positive if interacting proteins had been documented in incompatible cellular compartments (e.g. plasma membrane proteins interacting with nuclear proteins), as annotated in the December 2005 release of the Gene Ontology (GO) Consortium database (Ashburner et al., 2000).
2.3. Clustering of interconnected proteins
The network of interactions was analysed using clique percolation clustering (Adamcsek et al., 2006), which locates maximal complete subgraphs (k-cliques) in the networks and then identifies ‘communities’ by carrying out standard component analysis of the clique-clique overlap. In this context, the variable k is defined as the number of nodes in the subgraph and a k-clique community is defined as the union of all k-cliques that can be reached from each other through a series of adjacent k-cliques, where cliques sharing k − 1 nodes are defined as adjacent. The resulting communities are allowed to exhibit a degree of overlap, which is particularly useful, as such methods have been shown to be more suitable for identifying central hubs in biological networks compared with non-overlapping clustering algorithms (Wuchty and Almaas, 2005). The protein clustering data are available in the Supplementary Material.
2.4 Datasets
Information on cancer genes was obtained from a comprehensive census of human cancer genes (Futreal et al., 2004). The data, 346 genes encoding 509 protein isoforms, were mapped on to the protein-protein interaction network.
Statistics relating to the frequency of domain-domain interactions were obtained from version 19.0 of PFAM (Bateman et al., 2004).
Proteins were classified into cellular processes according to information from release 37.0 of the KEGG Pathway Database (Kanehisa et al., 2006) and June 2006 release of the Gene Ontology database.
3 RESULTS AND DISCUSSION
3.1 Network validation
The human interactome was built on a network of predicted protein-protein interactions. After constructing the human interactome we assessed the sensitivity and specificity of the predictions, on which the interactome was based. Each interaction received a score according to Equation (1), and the scoring function assessed by a ROC-curve, shown in Figure 1. The area under the curve is equal to 0.89, which illustrates that the derived scoring function is a good indicator of prediction reliability—an area of 1.0 would indicate a zero rate of false negative and 100% rate of true positive identification. The standard error for the graph is 0.00078, which indicates a sufficient sample size.
Fig. 1.
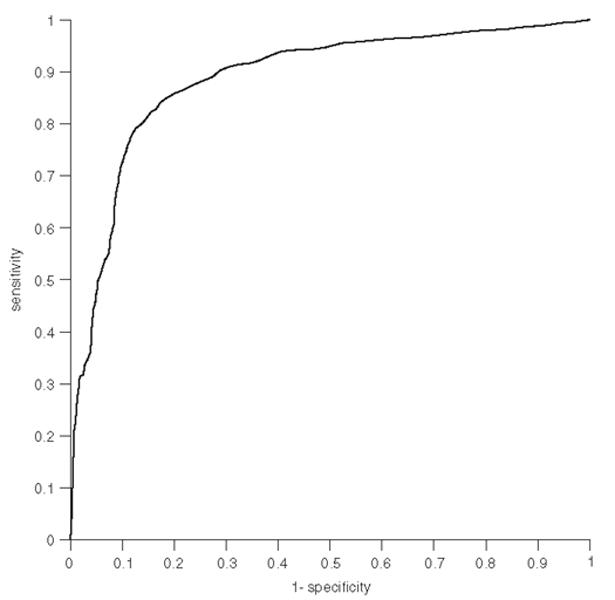
Curve of receiver operating characteristics (ROC) at different cut-off points of scores. The area under the curve is 0.89.
The trade-off for high a sensitivity is a lower specificity, which means a higher fraction of false positives. For a score cut-off of 11.0 we obtained sensitivity of 85% and specificity of 82% (Table 1), which is a reasonable balance between the true positive fraction (sensitivity) and the true negative fraction (specificity). The interactome consisted of 108 113 binary interactions when a minimum score of 11.0 was implemented. This compares to 196 213 and 66 944 for cut-off score of 10 and 12 respectively.
Table 1.
Sensitivity, specificity and PPV
| Score cut-off | Sensitivity | Specificity | PPV | Interactions |
|---|---|---|---|---|
| 10 | 0.921 | 0.639 | 0.708 | 196 213 |
| 11 | 0.849 | 0.816 | 0.810 | 108 113 |
| 12 | 0.765 | 0.887 | 0.870 | 66 944 |
| 13 | 0.686 | 0.908 | 0.882 | 53 947 |
| 14 | 0.641 | 0.915 | 0.883 | 51 034 |
| 15 | 0.607 | 0.916 | 0.879 | 50 378 |
Sensitivity, specificity and positive predictive value (PPV) as a function of the cut-off score. The positive predictive value, PPV = TP / (TP + FP), indicates the likelihood of true interaction, given a positive prediction. Also shown is the total number of interactions for each score cut-off.
3.2. Network properties of cancer proteins
The construction of a validated human protein-protein interaction network allows an in-depth analysis of individual proteins in the context of their surroundings. Here the network topographies of human cancer proteins were examined with the aim of uncovering intrinsic properties that distinguish proteins prone to cancerous mutations from those that are not.
3.2.1. Connectivity
The number of interaction partners for each protein in the network was calculated, using the cut-off score described above. Statistics were accumulated for two groups: proteins classified as cancer proteins, and those that were not classified as being linked to cancer. Cancer proteins were shown to have, on average, twice as many interaction partners as non-cancer proteins, with 23.4 and 11.4 interaction partners, respectively (Fig. 2). Table 2 shows a more detailed breakdown of the interaction frequency. Cancer proteins are under represented in the category of the least connected proteins, but show the reverse trend in all other categories. This trend is highly statistically significant (p = 5 × 10⁻³⁴).
Fig. 2.
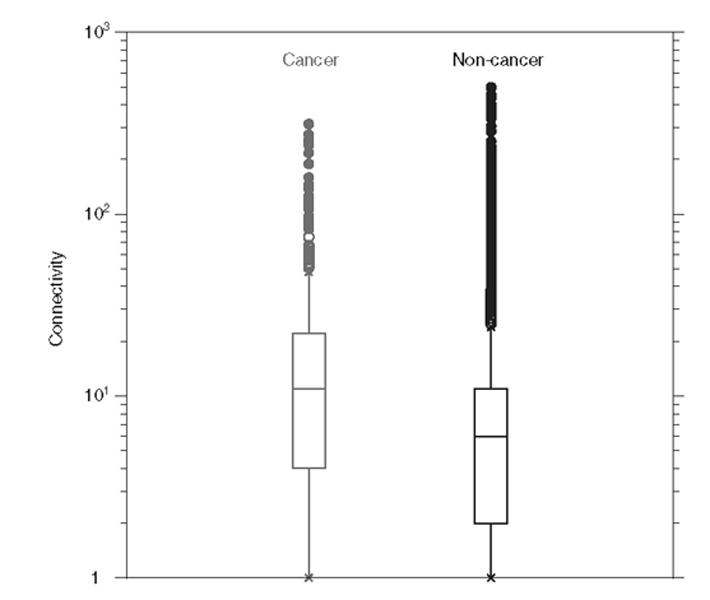
The number of interactions, in which cancer proteins participate (left), compared with the number of interactions of non-cancer proteins (right). Cancer proteins are, on average, involved in 23.4 interactions, whereas non-cancer proteins are involved in 11.4. The centre of the box is the median and the box spans from first to third quartiles (the inter-quartile range). The whiskers extend to the furthest point within 1.5 times the inter-quartile range. Beyond the whiskers, all outliers are shown, in open circles up to a distance of three times the inter-quartile range and closed beyond that.
Table 2.
Connectivity of cancer proteins
| Interactions | fObs | fExp | Difference (%) |
|---|---|---|---|
| 1–10 | 215 | 318 | −32 |
| 11–20 | 99 | 69 | 43 |
| 21–30 | 48 | 21 | 134 |
| 31–40 | 12 | 8 | 42 |
| ≥40 | 65 | 23 | 185 |
Observed interaction frequency distribution of cancer proteins compared to the expected value as observed in the genome-wide network.
As each interaction in our predicted protein-protein interaction map receives a confidence score, it is possible to test the robustness of the above observation. Increasing the cut-off score limits the amount of interaction data, but the confidence of each interaction is increased. Cancer proteins consistently showed twice as many interaction partners as non-cancer proteins, when the score cut-off was increased, indicating that the observation is reliable (data not shown).
The discovery of a difference in the number of interaction partners between cancer and non-cancer proteins could suggest a differentiation in evolutionary aspects of these two groups. Indeed, the evolutionary rate and age of genes or proteins has been the subject of several publications, showing increasing evidence for a correlation between the age of proteins and the number of interactions they participate in (Fraser et al., 2002; Eisenberg and Levanon, 2003; Wuchty, 2004). This correlation has been disputed by Jordan et al. (2003), but in a recent publication, Saeed and Deane (2006) show that a correlation does exist, although it is dependent on the completeness and quality of the dataset under study. These results indicate that proteins, whose mutation results in a detrimental change of function that leads to cancer, may generally be older than the non-cancer ones.
Jeong et al. (2001) showed that the most highly connected proteins in yeast are also the ones that are phenotypically most important, and critical for the survival of the organism. Furthermore, it has been shown that toxicity-modulating proteins exhibit a greater number of interactions (Said et al., 2004). It follows that the increased connectivity of cancer proteins, shown here, suggests that they play a central role in the protein network.
Cancers result from the accumulation of inherited and somatic mutations in oncogenes and tumour suppressor genes. With this in mind, it is of interest to distinguish between somatic and germline mutations that result in cancer. Germline mutations can be passed between generations, whereas somatic mutations are not passed on to offspring. This study shows a modest but statistically significant difference (p = 0.002) in the distribution of interaction partners of somatically mutated versus germline mutated proteins. About two-thirds of the proteins showing somatic mutations interact with a relatively low number of proteins (20 interaction partners or less), whereas just over half of germline mutated proteins fell in to the same grouping (Table 3). This may indicate somewhat younger average evolutionary age of the somatically mutated cancer proteins compared with germline, reflecting the fact that evolutionary selection pressure affects germline mutated proteins.
Table 3.
Connectivity ratio of somatic and germline mutated cancer protiens (number of proteins in parentheses). The observed difference is statistically significant ( p = 0.002)
| Interactions | Somatic | Germline | Difference (%) |
|---|---|---|---|
| 1–20 | 0.68 (175) | 0.53 (30) | 28.88 |
| ≥20 | 0.32 (83) | 0.47 (27) | −32.08 |
| Sum | 1.00 (258) | 1.00 (57) |
3.2.2 Protein domain frequencies
Comparing the structural and domain composition of cancer proteins against domain propensities of the general network reveals a functional diversity that differs from that of proteins in general. Table 4 lists the 20 most frequent domains found in the cancer protein population. Most of those domains appear with a higher frequency than expected. Many of the proteins, whose frequency is increased compared with the expected values, appear to be of nuclear origin and have functionality that particularly focuses on DNA regulation and repair, such as the Zinc-finger, PHD-finger, BRCT and Paired-box domains.
Table 4.
The 20 most frequently observed protein domains
| PFAM id | Domain annotation | fObs | fExp | n-fold difference | ppromiscuity | |
|---|---|---|---|---|---|---|
| * | PF00047 | Immunoglobulin domain | 102 | 37 | 2.76 | 7.93 × 10⁻¹¹ |
| PF00096 | Zinc-finger, C2H2 type | 51 | 35 | 1.46 | 0.027 9 | |
| * | PF00069 | Protein kinase domain | 51 | 14 | 3.64 | 3.70 × 10⁻¹³ |
| PF00628 | PHD-finger | 35 | 4 | 8.75 | 1 | |
| * | PF00097 | Zinc-finger, C3HC4 type | 28 | 8 | 3.50 | 4.67 × 10⁻³ |
| PF00855 | PWWP domain | 21 | 1 | 21.00 | 1 | |
| * | PF00046 | Homeobox domain | 17 | 7 | 2.43 | 7.80 × 10⁻⁴ |
| PF00643 | Zinc-finger, C3HC4 type plus B-box | 16 | 3 | 5.33 | 1 | |
| * | PF00036 | EF hand | 16 | 8 | 2.00 | 1.33 × 10⁻¹¹ |
| * | PF00008 | EGF-like domain | 13 | 20 | 0.65 | 1.33 × 10⁻¹¹ |
| PF00533 | BRCA1 C Terminus (BRCT) domain | 12 | 1 | 12.00 | 0.0279 | |
| * | PF00010 | Helix-loop-helix DNA-binding domain | 11 | 3 | 3.67 | 4.67× 10⁻³ |
| PF00292 | Paired-box domain | 10 | 1 | 10.00 | 0.167 | |
| * | PF00856 | SET-domain | 10 | 2 | 5.00 | 4.67 × 10⁻³ |
| * | PF00076 | RNA recognition motif. (RRM, RBD, or RNP) | 10 | 9 | 1.11 | 4.67 × 10⁻³ |
| * | PF00020 | TNFR/NGFR cysteine-rich region | 9 | 1 | 9.00 | 7.80 × 10⁻⁴ |
| * | PF00018 | SH3-domain | 8 | 7 | 1.14 | 6.09 × 10⁻⁷ |
| PF00439 | Bromodomain | 8 | 2 | 4.00 | 0.167 | |
| PF00531 | Death-domain | 7 | 1 | 7.00 | 0.167 | |
| * | PF00178 | Ets-domain | 7 | 15 | 0.47 | 7.80 × 10⁻⁴ |
The most frequently observed domains in human cancer proteins, listed in a descending order. Their frequency is compared against the expected frequency derived from a network-wide survey. The ppromiscuity-value shows the probability of observing a domain with higher interaction promiscuity as calculated by a Probability Density Function based on the PFAM domain population. Domains preceded with * show statistically higher-than-expected interaction promiscuity (ppromiscuity <0.005) in terms of the number of different domains they interact with. Domains without any documented PFAM interactions receive a p-value of 1.
The concern that the apparent increased connectivity of cancer proteins is a result of a bias in the protein network needed to be addressed. As described, the construction of the human interaction network builds on experimental data and it could be argued that cancer proteins, having been under particular scrutiny by the scientific community, have been studied in greater detail, which could explain the higher number of known interaction partners for cancer proteins. However, this appears not to be the case and is more likely to be a consequence of domain usage. Using interaction frequencies for domain-domain interactions from the PFAM database (Bateman et al., 2004), we found that the propensity of highly promiscuous domains, in terms of the variety of different domains they interact with, was higher in the cancer population, with 22.2% of domains highly promiscuous compared with 6.9% of the non-cancer population (the number of unique domains, N = 212 and N = 4042, respectively). Some of these domains (ppromiscuity < 0.005) appear in the list of the most frequently observed cancer domains (Table 4), and are preceded with the symbol “*”. This is based on a statistical analysis of interaction frequencies of PFAM domains in general, which conform to a probability density function:
| (2) |
where x is the domain interaction frequency and λ is the rate constant, derived from the average value of interactions per domain (0.56), as observed in the PFAM data.
There still remains the argument that the PFAM domain-domain interaction data could be biased towards cancer protein studies. Since PFAM is derived from the Protein Data Bank (PDB) (Berman et al., 2000) we checked for bias within this primary structural database. We found that <1% of the PDB contains structural information on the cancer proteins studied here, or their close homologues (E-value ≤1 × 10⁻⁵, sequence identity ≥70%), thereby indicating no obvious bias towards cancer proteins.
3.2.3 Cluster analysis of the human interactome
Clustering methods have previously been shown to be useful in identifying protein interactions that take place within the same cellular process (Palla et al., 2005; Jonsson et al., 2006). This can be attributed to the fact that subnetworks of proteins involved in a defined cellular process are more heavily interconnected by direct protein interactions than would be expected by chance (Jeong et al., 2001; Gunsalus et al., 2005).
The k-clique clustering method was applied repeatedly at different k-cluster values (Supplementary Figure 1). A low k-value yields a large number of extensive communities of less tightly connected protein communities, showing a high degree of overlap, whereas raising the k-value results in identification of fewer and more distinct protein communities that have a high degree of interconnection (Table 5). Interestingly, even though cluster sizes decrease with increasing k-value, the proportion of cancer genes identified in the protein communities increases, indicating the enrichment of cancer proteins in the most tightly connected communities.
Table 5.
Number of communities and proteins at different k-values
| k-value | Communities | Non-cancer proteins | Cancer proteins (%) |
|---|---|---|---|
| 3 | 222 | 8870 | 334 (3.6) |
| 4 | 189 | 4245 | 234 (5.2) |
| 5 | 98 | 1918 | 117 (5.8) |
| 6 | 37 | 764 | 53 (6.5) |
| 7 | 19 | 325 | 28 (7.9) |
| 8 | 9 | 193 | 14 (6.8) |
The number of protein communities in the entire human interactome, identified by k-clique analysis at different k-values. The number of non-cancer and cancer proteins in the communities at each k-value is listed on the right-hand side of the table.
An example of the protein communities identified by this method is shown in Figure 3. The communities contain proteins involved in a diverse range of protein functions and are either self-contained or connected to other protein communities. In the latter case, cancer proteins can be seen mediating interactions between different pathways, such as in the largest collection, where four communities are linked together, ranging from proteins involved in signal transduction to the immune system, and cell growth and death regulation.
Fig. 3.

A description of the protein communities identified by k-clique cluster analysis (k = 6). Each community is distinctly coloured, with cancer proteins shown as triangles. The main functional classes of each cluster (in bold) and individual pathways, as defined in the KEGG database, are listed alongside each community. Note that proteins can be members of more than one community, but the figure shows only one community assignment for each protein. A detailed version of this figure, including gene names for each protein, is available as supplementary material (see Supplementary Figure 2).
3.2.4 Community size and overlap
On examining the protein communities, some interesting differences in the community size were noticed. Cancer proteins, on average, belonged to more highly populated communities compared with non-cancer proteins (Fig. 4). It may be that cancer proteins take part in more complex cellular processes than their non-cancer counterparts. It is also conceivable that the larger communities contain larger or more complicated cellular machinery, where cancer proteins play a role.
Fig. 4.
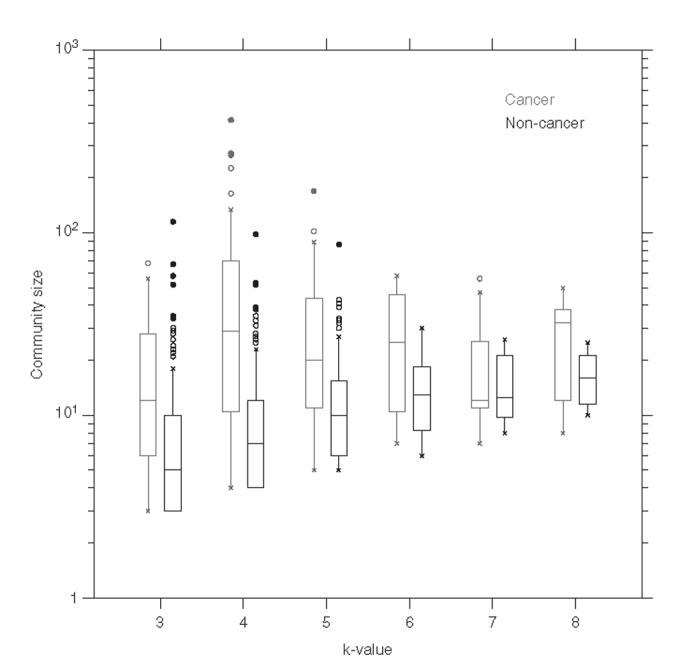
Average size distribution of protein communities that contain cancer proteins compared to those containing non-cancer proteins. Distributions are classified according to clustering k-value, with cancer communities on the left and non-cancer on the right. The difference between cancer and non-cancer groups is statistically significant, according to Wilcoxon rank sum tests, for k-values 3, 4, 5 (p < 0.005), and 6 (p < 0.05).
Proteins identified as members of more than one protein community are of particular interest. In general, each protein community represents a distinct cellular process; therefore proteins that have multiple community membership may be participating in multiple processes, and can be considered to be at the ‘interface’ of distinct but adjacent cellular processes. Comparing the cancer protein population against the non-cancer population reveals that cancer proteins reside at community interfaces to a much greater extent than their non-cancer counterparts, as shown in Table 6.
Table 6.
Multiple community membership distribution
| k-value | Observed (%) | Expected (%) | Fold difference |
|---|---|---|---|
| 3 | 12.67 | 8.38 | 1.5 |
| 4 | 21.39 | 12.38 | 1.7 |
| 5 | 12.37 | 9.96 | 1.2 |
| 6 | 17.07 | 13.67 | 1.2 |
| 7 | 17.39 | 7.26 | 2.4 |
| 8 | 7.69 | 2.66 | 2.9 |
Percentage of cancer proteins belonging to more than one community (based on proteins identified by clustering as belonging to a community). Expected value was based on non-cancer proteins.
While connectivity gives an indication of a protein’s importance, it is possible to further classify the topological role of highly connected proteins based on their locality. Wuchty and Almaas (2005) used a k-core decomposition method to distinguish between highly connected domains in peripheral cores (locally central) and highly connected domains in central cores (globally central). They show that globally central proteins form an evolutionary backbone of the proteome, present elevated evolutionary conservation, and are essential to the organism.
The protein community identification by the k-clique clustering used in this study allows a similar distinction to be made, owing to the overlapping nature of the communities. Proteins in overlapping communities can be classified as global central cores, and non-overlapping ones as local central cores. The above results thus emphasize the key role of cancer proteins, which is reflected in their protein-network topology. This observation supports and extends the findings of Wachi et al. (2005), who showed that differentially expressed proteins in squamous cell carcinoma of the lung tend to be global hubs.
Overall, the above findings reveal topological distinction of cancer proteins that is primarily displayed in increased interaction frequency compared with non-cancer proteins. In the light of this, we investigated whether this is owing to a pronounced increase within a few cellular processes or whether there is a uniform distribution of raised connectivity of cancer proteins in all aspects of cellular function. Information from the Gene Ontology Consortium was used to assign proteins to cellular process categories, showing that cancer proteins in all cellular processes contribute to the increase, although proteins in the stimulus response and cellular process groups do so more than others (Supplementary Table 1).
4 CONCLUSION
In summary, we have shown that human proteins involved in cancer exhibit a network topology different from that of proteins not documented as being mutated in cancer. The observation is based on the study of a global protein-protein interaction network, constructed by a homology based method, which we have shown to be capable of accurately predicting protein-protein interactions.
The most striking property of cancer proteins is the increased frequency of interactions they participate in. This observation indicates an underlying evolutionary pressure to which cancer genes, as genes of central importance, are subjected.
The k-clique clustering algorithm allows us to explore protein-protein connectivity in a more informative way than is possible just by looking at the interaction frequency of each protein. Its feature of overlapping protein communities allows us to distinguish between central and peripheral hubs of highly connecting proteins, revealing proteins forming the backbone of the proteome. The fact that we observe an enrichment of cancer proteins in this group indicates the central role of these proteins. The domain composition of cancer proteins may indicate why this is the case: we have shown that cancer proteins contain a high ratio of highly promiscuous domains, in terms of the number of different proteins with which they interact.
The results presented here provide first insights into the global network properties of cancer proteins, and can be used to guide experiments towards regions of the interactome likely to modulate cellular processes involved in cancer. Further studies, however, are required to fully resolve the evolutionary aspect of these findings.
Supplementary Material
Supplementary information: The interactome data are available though the PIP (Potential Interactions of Proteins) web server at http://bmm.cancerresearchuk.org/servers/pip. Further additional material is available at http://bmm.cancerresearchuk.org/servers/pip/bioinformatics/
ACKNOWLEDGEMENTS
The authors would like to thank members of the Biomolecular Modelling Laboratory for helpful discussions. This work was funded by Cancer Research UK.
Footnotes
Conflict of Interest: none declared.
REFERENCES
- Adamcsek B, et al. CFinder: locating cliques and overlapping modules in biological networks. Bioinformatics. 2006;22:1021–1023. doi: 10.1093/bioinformatics/btl039. [DOI] [PubMed] [Google Scholar]
- Ashburner M, et al. Gene ontology: tool for the unification of biology. The Gene Ontology Consortium. Nat. Genet. 2000;25:25–29. doi: 10.1038/75556. [DOI] [PMC free article] [PubMed] [Google Scholar]
- Bateman A, et al. The Pfam protein families database. Nucleic Acids Res. 2004;32:D138–D141. doi: 10.1093/nar/gkh121. [DOI] [PMC free article] [PubMed] [Google Scholar]
- Berman HM, et al. The Protein Data Bank. Nucleic Acids Res. 2000;28:235–242. doi: 10.1093/nar/28.1.235. [DOI] [PMC free article] [PubMed] [Google Scholar]
- Brown KR, Jurisica I. Online predicted human interaction database. Bioinformatics. 2005;21:2076–2082. doi: 10.1093/bioinformatics/bti273. [DOI] [PubMed] [Google Scholar]
- Bu D, et al. Topological structure analysis of the protein-protein interaction network in budding yeast. Nucleic Acids Res. 2003;31:2443–2450. doi: 10.1093/nar/gkg340. [DOI] [PMC free article] [PubMed] [Google Scholar]
- Calvano SE, et al. A network-based analysis of systemic inflammation in humans. Nature. 2005;437:1032–1037. doi: 10.1038/nature03985. [DOI] [PubMed] [Google Scholar]
- Dunker AK, et al. Flexible nets. The roles of intrinsic disorder in protein interaction networks. FEBS J. 2005;272:5129–5148. doi: 10.1111/j.1742-4658.2005.04948.x. [DOI] [PubMed] [Google Scholar]
- Eisenberg E, Levanon EY. Preferential attachment in the protein network evolution. Phys. Rev. Lett. 2003;91:138701. doi: 10.1103/PhysRevLett.91.138701. [DOI] [PubMed] [Google Scholar]
- Formstecher E, et al. Protein interaction mapping: a Drosophila case study. Genome Res. 2005;15:376–384. doi: 10.1101/gr.2659105. [DOI] [PMC free article] [PubMed] [Google Scholar]
- Fraser HB, et al. Evolutionary rate in the protein interaction network. Science. 2002;296:750–752. doi: 10.1126/science.1068696. [DOI] [PubMed] [Google Scholar]
- Futreal PA, et al. A census of human cancer genes. Nat. Rev. Cancer. 2004;4:177–83. doi: 10.1038/nrc1299. [DOI] [PMC free article] [PubMed] [Google Scholar]
- Gavin AC, et al. Functional organization of the yeast proteome by systematic analysis of protein complexes. Nature. 2002;415:141–147. doi: 10.1038/415141a. [DOI] [PubMed] [Google Scholar]
- Giot L, et al. A Protein Interaction Map of Drosophila melanogaster. Science. 2002;302:1727–1736. doi: 10.1126/science.1090289. [DOI] [PubMed] [Google Scholar]
- Gunsalus KC, et al. Predictive models of molecular machines involved in Caenorhabditis elegans early embryogenesis. Nature. 2005;436:861–865. doi: 10.1038/nature03876. [DOI] [PubMed] [Google Scholar]
- Ho Y, et al. Systematic identification of protein complexes in Saccharomyces cerevisiae by mass spectrometry. Nature. 2002;415:180–183. doi: 10.1038/415180a. [DOI] [PubMed] [Google Scholar]
- Ideker T, et al. Discovering regulatory and signalling circuits in molecular interaction networks. Bioinformatics. 2002;18:S233–S240. doi: 10.1093/bioinformatics/18.suppl_1.s233. [DOI] [PubMed] [Google Scholar]
- Ito T, et al. A comprehensive two-hybrid analysis to explore the yeast protein interactome. Proc. Natl Acad. Sci. USA. 2001;98:4569–4574. doi: 10.1073/pnas.061034498. [DOI] [PMC free article] [PubMed] [Google Scholar]
- Jeong H, et al. Lethality and centrality in protein networks. Nature. 2001;411:41–42. doi: 10.1038/35075138. [DOI] [PubMed] [Google Scholar]
- Jonsson PF, et al. Cluster analysis of networks generated through homology: automatic identification of important protein communities involved in cancer metastasis. BMC Bioinformatics. 2006;7:2. doi: 10.1186/1471-2105-7-2. [DOI] [PMC free article] [PubMed] [Google Scholar]
- Jordan IK, et al. No simple dependence between protein evolution rate and the number of protein-protein interactions: only the most prolific interactors tend to evolve slowly. BMC Evol. Biol. 2003;3:1. doi: 10.1186/1471-2148-3-1. [DOI] [PMC free article] [PubMed] [Google Scholar]
- Kanehisa M, et al. From genomics to chemical genomics: new developments in KEGG. Nucleic Acids Res. 2006;34:D354–D357. doi: 10.1093/nar/gkj102. [DOI] [PMC free article] [PubMed] [Google Scholar]
- Lehner B, Fraser AG. A first-draft human protein-interaction map. Genome Biol. 2004;5:R63. doi: 10.1186/gb-2004-5-9-r63. [DOI] [PMC free article] [PubMed] [Google Scholar]
- Li S, et al. A Map of the Interactome Network of the Metazoan C. elegans. Science. 2004;303:540–543. doi: 10.1126/science.1091403. [DOI] [PMC free article] [PubMed] [Google Scholar]
- de Lichtenberg U, et al. Dynamic complex formation during the yeast cell cycle. Science. 2005;307:724–727. doi: 10.1126/science.1105103. [DOI] [PubMed] [Google Scholar]
- Matthews LR, et al. Identification of potential interaction networks using sequence-based searches for conserved protein-protein interactions or “interologs”. Genome Res. 2001;11:2120–2126. doi: 10.1101/gr.205301. [DOI] [PMC free article] [PubMed] [Google Scholar]
- Pagel P, et al. The MIPS mammalian protein-protein interaction database. Bioinformatics. 2005;21:832–834. doi: 10.1093/bioinformatics/bti115. [DOI] [PubMed] [Google Scholar]
- Palla G, et al. Uncovering the overlapping community structure of complex networks in nature and society. Nature. 2005;435:814–818. doi: 10.1038/nature03607. [DOI] [PubMed] [Google Scholar]
- Peri S, et al. Development of human protein reference database as an initial platform for approaching systems biology in humans. Genome Res. 2003;13:2363–2371. doi: 10.1101/gr.1680803. [DOI] [PMC free article] [PubMed] [Google Scholar]
- Pruitt KD, et al. NCBI Reference Sequence (RefSeq): a curated non-redundant sequence database of genomes, transcripts and proteins. Nucleic Acids Res. 2005;33:D501–D504. doi: 10.1093/nar/gki025. [DOI] [PMC free article] [PubMed] [Google Scholar]
- Riley R, et al. Inferring protein domain interactions from databases of interacting proteins. Genome Biology. 2005;6:R89. doi: 10.1186/gb-2005-6-10-r89. [DOI] [PMC free article] [PubMed] [Google Scholar]
- Saeed R, Deane CM. Protein protein interactions, evolutionary rate, abundance and age. BMC Bioinformatics. 2006;7:128. doi: 10.1186/1471-2105-7-128. [DOI] [PMC free article] [PubMed] [Google Scholar]
- Said MR, et al. Global network analysis of phenotypic effects: protein networks and toxicity modulation in Saccharomyces cerevisiae. Proc. Natl Acad. Sci. USA. 2004;101:18006–18011. doi: 10.1073/pnas.0405996101. [DOI] [PMC free article] [PubMed] [Google Scholar]
- Salwinski L, et al. The Database of Interacting Proteins: 2004 update. Nucleic Acids Res. 2004;32:D449–D451. doi: 10.1093/nar/gkh086. [DOI] [PMC free article] [PubMed] [Google Scholar]
- Sharan R, et al. Conserved patterns of protein interaction in multiple species. Proc. Natl Acad. Sci. USA. 2005;102:1974–1979. doi: 10.1073/pnas.0409522102. [DOI] [PMC free article] [PubMed] [Google Scholar]
- Sohler F, et al. New methods for joint analysis of biological networks and expression data. Bioinformatics. 2004;20:1517–1521. doi: 10.1093/bioinformatics/bth112. [DOI] [PubMed] [Google Scholar]
- Uetz P, et al. A comprehensive analysis of protein-protein interactions in Saccharomyces cerevisiae. Nature. 2000;403:623–627. doi: 10.1038/35001009. [DOI] [PubMed] [Google Scholar]
- Wachi S, et al. Interactome-transcriptome analysis reveals the high centrality of genes differentially expressed in lung cancer tissues. Bioinformatics. 2005;21:4205–4208. doi: 10.1093/bioinformatics/bti688. [DOI] [PMC free article] [PubMed] [Google Scholar]
- Wuchty S. Evolution and topology in the yeast protein interaction network. Genome Res. 2004;14:1310–1314. doi: 10.1101/gr.2300204. [DOI] [PMC free article] [PubMed] [Google Scholar]
- Wuchty S, Almaas E. Evolutionary cores of domain co-occurrence networks. BMC Evol. Biol. 2005;5:24. doi: 10.1186/1471-2148-5-24. [DOI] [PMC free article] [PubMed] [Google Scholar]