Abstract
Iron regulatory protein 1 (IRP1) is an RNA binding protein that posttranscriptionally modulates the expression of mRNAs coding for proteins involved in iron metabolism. It has long been held that its RNA binding activity is regulated posttranslationally by the insertion/extrusion of a 4Fe-4S cluster, without changes in IRP1 levels. However, the question of a possible regulation of the expression of this protein has remained open. In the present study we analyzed the modulation of IRP1 expression in murine macrophages. We showed that activation by IFN-γ and/or lipopolysaccharide, which induces IRP1 RNA binding activity via nitric oxide (NO), results simultaneously in a reduction in IRP1 protein levels, as determined by Western blot analyses. IRP1 expression decreased time-dependently to about 40% of control levels after 16 h. Down-regulation of IRP1 protein levels was correlated with the amount of NO produced and was partially abolished by the NO synthase (NOS) inhibitor N-monomethyl-l-arginine. No changes in IRP1 levels could be detected in stimulated peritoneal macrophages from NOS2 knockout (NOS2−/−) mice, unlike wild-type mice. Converse modulation of IRP1 RNA binding activity and IRP1 levels could be reproduced by exogenous NO and also was observed in nonmacrophage cells cocultured with NO-producing macrophages. We also analyzed IRP1 mRNA levels by Northern blotting and found a decrease in IRP1 mRNA expression after stimulation with IFN-γ plus lipopolysaccharide, which was abrogated in the presence of N-monomethyl-l-arginine. This is evidence that IRP1 is regulated by a physiological stimulus other than posttranslationally.
In mammals, cellular iron homeostasis is largely coordinated through the action of two cytoplasmic RNA binding proteins, iron regulatory proteins 1 and 2 (IRP1 and IRP2). IRPs interact with specific mRNA stem-loop structures, the iron responsive elements (IREs), located in the untranslated regions of several mRNAs including ferritin H-chain and L-chain mRNA and TfR mRNA. IRPs bind to IREs with high affinity in situations of iron starvation. This notably results in coordinate inhibition of ferritin translation and stabilization of TfR mRNA, leading to decreased iron sequestration and enhanced iron uptake. By contrast, when cells are iron replete, IRPs lose their capacity to bind IREs, allowing efficient translation of ferritin and reducing TfR mRNA half-life (reviewed in refs. 1–3).
IRP1 and IRP2 differ in the way they sense and respond to intracellular iron availability. Whereas IRP2 is rapidly degraded in response to high iron levels by a proteasome-mediated pathway (4, 5), IRP1, which in most mammalian cells is more abundant than IRP2 (6), is considered as a quite stable protein whose half-life (more than 12 h) is not affected by changes in iron levels (7, 8). Different studies have shown that its IRE binding activity is posttranslationally regulated by cellular iron changes through the assembly/disassembly of a labile 4Fe-4S cluster, without alterations in IRP1 protein levels (9, 10). This 4Fe-4S cluster is present in IRP1 when cells are rich in iron, preventing RNA binding by limiting access of critical RNA binding residues to IREs. In this situation IRP1, which shares 30% amino acid identity with mitochondrial aconitase, functions as a cytosolic aconitase, converting citrate into isocitrate. When cells are iron depleted, IRP1 is devoid of such a cluster, lacks aconitase activity, and gains the capacity to bind RNA (1, 10, 11).
The mechanisms responsible for the conversion between holoprotein and apoprotein have been largely investigated and, in addition to iron, different signals i.e., nitric oxide (NO) (12–14), oxidative stress (15), phosphorylation (16), and hypoxia/reoxygenation (17), have been shown to modulate IRP1 activity posttranslationally. However, the question of whether and how the expression of this protein could be regulated in another way is still unanswered. In previous studies, we observed that stimulation of macrophages with IFN-γ plus lipopolysaccharide (LPS), which activates IRE binding by IRP1 via NO, consistently resulted in a decrease in the total IRP1 IRE binding capacity as assessed by treatment with 2% 2-mercaptoethanol (2-ME) (18). Indeed, this reductant fully converts IRP1 into its RNA binding form and therefore provides an indication of the total amount of IRP1 in the cell (19). This intriguing observation led us to conceive that stimulation with IFN-γ and/or LPS also could modulate IRP1 at another level. We therefore sought to analyze the modulation of IRP1 expression in the RAW 264.7 macrophage cell line and in murine primary macrophages. We show here that activation by IFN-γ plus LPS reduces IRP1 protein levels, as determined by Western blot analyses. The decrease in IRP1 expression induced by IFN-γ/LPS is mediated by NO, as demonstrated by the absence of IRP1 down-regulation in stimulated macrophages from NO synthase 2-deficient (NOS2−/−) mice. Furthermore, we found that stimulation with IFN-γ plus LPS decreases IRP1 mRNA levels in RAW 264.7 macrophages, via an NO-dependent pathway.
Materials and Methods
Materials.
Murine recombinant IFN-γ (specific activity 2 × 10⁷ units/mg) was produced by Genentech and provided by G. R. Adolf, Boehringer Ingelheim. Rabbit anti-IRP1 antiserum and the pSPT-fer plasmid containing the IRE of human ferritin H-chain were kindly provided by Lukas C. Kühn (Institut Suisse de Recherches Experimentales sur le Cancer, Epalinges, Switzerland). The murine macrophage NOS2 cDNA probe was a generous gift of C. Nathan (Cornell University Medical College, New York). The IRP1 cDNA probe was kindly provided by E. Leibold (University of Utah, Salt Lake City). DMEM and low endotoxin FCS were from GIBCO. Lactacystin was from Calbiochem (San Diego, CA). MG 132 was a generous gift from F. Baleux (Institut Pasteur, Paris). The NO donors were from Cayman Chemicals (Ann Harbor, MI). Escherichia coli LPS and all other chemicals were from Sigma.
Primary Macrophages and Cell Lines.
Eight- to 10-week-old mice were injected i.p. with 2 ml of thioglycolate broth 4–5 days before they were killed. Peritoneal macrophages were purified by adherence and cultured in 80-mm Petri dishes (Nunc). The mouse macrophage cell line RAW 264.7 was obtained from the American Type Culture Collection. Cells were cultured with high glucose DMEM supplemented with 5% low endotoxin FCS. The rat C58 pre-T cell line was kindly supplied by Markus Nabholz (Institut Suisse de Recherches Experimentales sur le Cancer, Epalinges, Switzerland). Cells were maintained in RPMI medium containing 5% low endotoxin FCS.
Cell Cocultures.
RAW 264.7 macrophages were stimulated for 16 h with 10 units/ml IFN-γ and 50 ng/ml LPS for NOS2 induction. Cells were exhaustively washed with PBS to remove the stimulating agents. Pre-T C58 target cells were added to the NO-producing macrophage monolayers at an effector-to-target ratio of 1.
Preparation of Cytosolic Extracts.
Cells were resuspended in 0.25 M sucrose, 100 mM Hepes, pH 7.4 and treated with 0.007% digitonin at 4°C for 5 min (20). After centrifugation at 1800 × g for 10 min, supernatants were collected and centrifuged at 150,000 × g for 20 min in a Beckman TL100 ultracentrifuge. Cytosolic extracts (0.5 mg/ml) were kept at −80°C.
Aconitase Activity.
Aconitase activity was measured spectrophotometrically by following the disappearance of cis-aconitate at 240 nm at 37°C, as described (21). Units are nmoles of substrate consumed/min.
Electrophoretic Mobility-Shift Assay (EMSA).
The IRP–IRE interactions were analyzed as described (22, 23), by incubating 2 μg protein of cell lysates with a molar excess of 32P-CTP-labeled ferritin IRE probe in 20 μl of 10 mM Hepes (pH 7.6), 40 mM KCl, 3 mM MgCl2, and 5% glycerol. In parallel experiments, samples were treated with 2% 2-ME before addition of the RNA probe to allow full expression of the IRE binding activity. After a 20-min incubation at room temperature, 1 μl RNase T1 (1 unit/μl) and 2 μl of heparin (50 mg/ml) were sequentially added for 10 min each. The IRP–IRE complexes were resolved on 6% nondenaturing polyacrylamide gels and were quantified with imagequant software (Molecular Dynamics).
Western Blot Analysis.
Ten micrograms of protein from cell lysates was resolved on a 10% SDS/polyacrylamide gel and transferred to nitrocellulose membranes. Membranes were blocked with 1% BSA at 4°C overnight and incubated with an affinity-purified rabbit antiserum raised against the human IRP1 NH2-terminal peptide (24) (kindly provided by Lukas C. Kühn). After 40-min incubation at room temperature the membranes were washed and incubated with a horseradish peroxidase-conjugated goat anti-rabbit IgG antibody for another 40 min. The antigen was detected by using the enhanced chemiluminescence Western blotting detection system Super signal (Pierce).
Northern Blotting.
Total RNA was isolated by using TRizol (Life Technologies, Grand Island, NY). Equal amounts of RNA (20 μg) were resolved on a 1% agarose gel containing formaldehyde and transferred to a Hybond nylon membrane. After cross-linking of the RNA to the membrane by UV light and prehybridization for 4–6 h, the membrane was hybridized overnight with 1.5 × 10⁶ cpm/ml of a random primed α-32P-dCTP-labeled IRP1 cDNA probe at 42°C. Blots were washed twice in 2× standard saline phosphate/EDTA (0.15 M NaCl/10 mM phosphate, pH 7.4/1 mM EDTA) (SSPE) for 15 min at room temperature and then twice in 0.1× SSPE, 0.1% SDS at 55°C for 15 min. Blots were exposed to x-ray films or for PhosphorImaging. The membrane was stripped and reprobed with random-primed α-32P-dCTP-labeled cDNA probes for NOS2 or glyceraldehyde phosphate dehydrogenase (GAPDH). Blots were washed as above except for the last two washes, which were performed at 65°C.
Measurement of Nitrite.
Nitrite, one of the end-products of the NO pathway, was determined spectrophotometrically at 543 nm in the culture medium by using the Griess reagent with final concentrations of 0.5% sulfanilamide and 0.05% N-(1-naphthyl)ethylenediamine hydrochloride in 45% acetic acid. The detection limit was 1 μM.
Protein Determination.
The protein content of cytoplasmic extracts was determined spectrophotometrically at 595 nm by using the Bio-Rad protein assay with BSA as a standard.
Results
Down-Regulation of IRP1 Levels in RAW 264.7 Cells After Stimulation with IFN-γ and/or LPS.
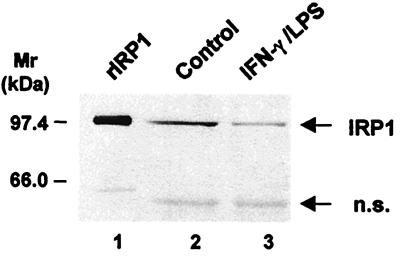
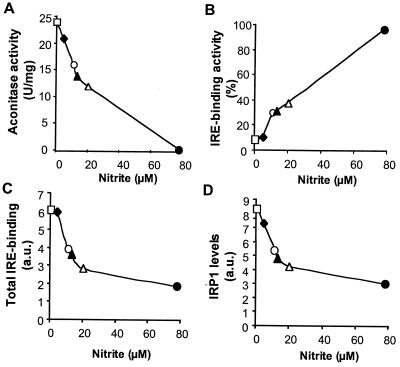
In a first series of experiments, RAW 264.7 cells were stimulated with IFN-γ (10 units/ml) and LPS (50 ng/ml) for 16 h. IRP1 levels in cell cytosols were measured by immunoblot analysis using an anti-IRP1 purified rabbit antiserum. Purified recombinant IRP1 was used as a positive control. As shown in Fig. 1, stimulation with IFN-γ plus LPS resulted in a significant decrease in IRP1 expression (compare lanes 2 and 3). Data from densitometric analysis revealed that IRP1 levels in stimulated cells were 39 ± 10% (mean ± SD of five independent experiments) of the control. Cells then were stimulated overnight with increasing concentrations of IFN-γ or LPS used alone or in combination. Synthesis of NO under each set of conditions was assessed by determination of nitrite in the culture medium. Cytosolic lysates then were analyzed in parallel for both aconitase and IRE binding activities of IRP1 as well as for IRP1 expression. As previously demonstrated (12), overnight stimulation with IFN-γ and/or LPS resulted in a dose-dependent decrease in aconitase activity of IRP1 and in an increase in IRP1 IRE binding activity, which was correlated with the amount of nitrite released (Fig. 2 A and B). The increase in IRP1 IRE binding activity was accompanied by a reduction in IRP1 expression, as suggested by quantification of the total IRP1–IRE binding capacity obtained in the presence of 2% 2-ME (Fig. 2C) and confirmed by direct determination of IRP1 levels by Western blotting (Fig. 2D). These results indicate that (i) IRP1–IRE binding activity and IRP1 expression are conversely modulated by IFN-γ/LPS, and (ii) the decrease in IRP1 expression is correlated with NO synthesis.
Figure 1.
Regulation of IRP1 expression in RAW 264.7 macrophages upon exposure to a combination of IFN-γ and LPS. RAW 264.7 cells were stimulated with 10 units/ml IFN-γ and 50 ng/ml LPS for 16 h. IRP1 levels in cytosolic extracts were analyzed by Western blotting with an affinity-purified rabbit IRP1 antiserum, as described in Materials and Methods. Purified recombinant IRP1 (rIRP1) was used as a positive control. Molecular masses of protein standards in kDa are shown on the left. The additional band at <66 kDa detected in some experiments (nonspecific, n.s.) may represent cross-reactivity with other protein or a degradation product, as previously observed (24).
Figure 2.
Converse modulation of IRP1–IRE binding activity and IRP1 expression in RAW 264.7 cells in response to increasing concentrations of INF-γ and LPS. Cells were grown for 16 h in the presence of 10 units/ml IFN-γ (⧫), 100 units/ml IFN-γ (▴), 10 ng/ml LPS (○), 100 ng/ml LPS (▵), 10 units/ml IFN-γ + 50 ng/ml LPS (●), or without any stimulus (□). NO production was measured by assessing nitrite in the culture medium. (A) Aconitase activity was analyzed by spectrophotometry. (B) IRP1–IRE binding activity was analyzed by EMSA as described in Materials and Methods. Radioactivity associated with IRP1–IRE complexes was quantified by PhosphorImaging. IRP1–IRE binding activity is expressed as the percentage of the value obtained in the presence of 2% 2-ME. (C) Total IRP1–IRE binding capacity obtained in the presence of 2% 2-ME is expressed in arbitrary units. (D) IRP1 levels were analyzed by Western blotting and quantified by densitometry.
Time Course of IRP1 Down-Regulation.
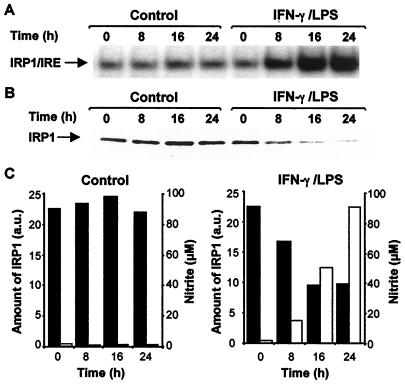
We next investigated the kinetics of IRP1 down-regulation after optimal stimulation with IFN-γ (10 units/ml) plus LPS (50 ng/ml). As can be seen in Fig. 3 A and B, reduction of IRP1 level paralleled the increase in IRE binding. A 30% decrease in IRP1 expression was detected in stimulated cells after 8 h, when the level of nitrite reached 15 μM (Fig. 3 B and C). IRP-1 down-regulation was more pronounced at 16 h, as the IRP1 level reached 40% of that observed in control cells. IRP1 levels then remained stable. In unstimulated cells, IRP1 expression did not significantly change with time.
Figure 3.
Time course of IRP1 down-regulation in RAW 264.7 cells stimulated with IFN-γ and LPS. Cells were cultured in the presence of 10 units/ml IFN-γ plus 50 ng/ml LPS or without any stimuli for different times. NO production was assessed by measuring nitrite (empty bars) in the culture medium. (A) IRP1–IRE binding activity was analyzed by EMSA. (B) Equal amounts of protein (10 μg) were subjected to Western blot analysis using an anti-IRP1 antiserum. (C) IRP1 levels (filled bars) were quantified by densitometry.
IFN-γ/LPS-Induced Reduction of IRP1 Levels Is Mediated by NO.
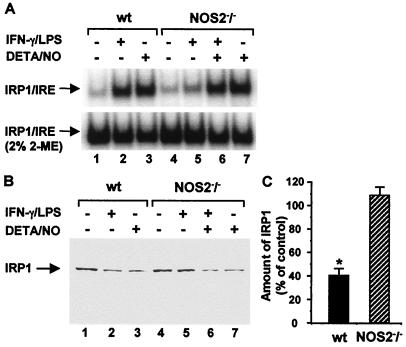
To see whether the decrease in IRP1 expression observed in response to IFN-γ/LPS treatment was caused by NO production, RAW 264.7 macrophages were incubated overnight with IFN-γ plus LPS in the presence or absence of N-monomethyl-l-arginine (l-NMMA), an inhibitor of NOS. As determined by band-shift analysis of the total IRP1–IRE binding capacity in the presence of 2% 2-ME and by immunoblot experiments, administration of l-NMMA reversed the IFN-γ/LPS-induced down-regulation of total IRP1, although not completely (not shown). As a competitive inhibitor, l-NMMA was unable to abrogate NOS2 activity completely as indicated by nitrite released. To test further whether NO biosynthesis is fully responsible for down-regulating IRP1 levels, we compared IRP1 expression in stimulated macrophages from wild-type and NOS2−/− mice. Primary macrophages were explanted from mouse peritoneum and cultured for 16 h with IFN-γ (10 units/ml) plus LPS (50 ng/ml). As can be seen in Fig. 4 A and B, overnight stimulation with IFN-γ/LPS induced IRP1–IRE binding activity and reduced IRP1 levels in macrophages from wild-type mice (compare lanes 1 and 2). Densitometric analysis revealed that IRP1 levels in stimulated macrophages were 40 ± 6% (mean ± SD of three independent experiments) of the control value in the wild-type mice (Fig. 4C). This result is in agreement with that observed with the RAW 264.7 macrophage cell line. In contrast, no changes in IRE binding activity or IRP1 levels could be detected after stimulation of macrophages from NOS2−/− mice (Fig. 4 A and B, compare lanes 4 and 5, and Fig. 4C). Interestingly, exposure of macrophages from NOS2−/− mice to exogenous NO released from diethylenetriamine NONOate (DETA/NO) restored IRE binding capacity (compare lanes 6 and 7 with lane 5 in Fig. 4A) and triggered down-regulation of IRP1 expression (compare lanes 6 and 7 with lane 5 in Fig. 4B). Altogether, these data clearly demonstrate that the decrease in IRP1 levels induced by IFN-γ/LPS is mediated by NO.
Figure 4.
IRP1 levels in stimulated peritoneal macrophages from wild-type and NOS2 knockout mice. Peritoneal macrophages from wild-type (wt) and NOS2 knockout (NOS2−/−) mice were activated with a combination of 10 units/ml IFN-γ and 50 ng/ml LPS, and/or exposed to 500 μM DETA/NO for 16 h. (A) IRP1–IRE binding activity in cytosolic extracts was analyzed by EMSA. (B) IRP1 levels were analyzed by Western blotting using anti-IRP1 antiserum. (C) IRP1 levels in stimulated cells were quantified by densitometry and are expressed as percentages of controls. Results from three independent experiments are shown. *, Significantly different relative to control levels, P < 0.007.
Modulation of IRP1 Expression by Exogenous NO.
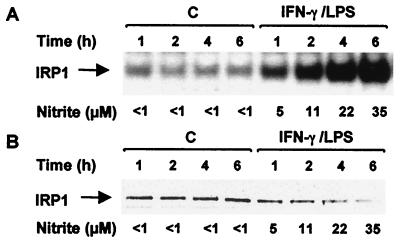
An outstanding feature of NO is its capacity to exert an effect in adjacent tissues or cells. To examine the effect of exogenous NO, we investigated whether NO produced by macrophages also could modulate IRP1 levels in other cell types in a paracrine manner. To address this issue we performed a series of coculture experiments. RAW 264.7 macrophages were activated with IFN-γ/LPS to induce NOS2 and then were exhaustively washed. Under these conditions, macrophages are able to produce NO for 24 h without further stimuli. C58 rat pre-T cells, which do not produce NO, then were added to the macrophage monolayer. IRP1–IRE binding activity and IRP1 expression in the C58 target cell line were measured versus time. As documented previously (18), a progressive induction of IRE binding activity of IRP1 could be detected in cytosolic extracts from C58 cells cocultured with NO-producing macrophages (Fig. 5A). A time-dependent decrease in IRP1 levels also was observed in these cells, which was correlated with the amount of nitrite in the culture medium (Fig. 5B). C58 cells cocultured with macrophages not stimulated for NO production exhibited no change in IRP1 activity and expression. These results show that NO synthesis leads to converse modulation of IRP1 activity and protein expression in adjacent nonmacrophage cells.
Figure 5.
Modulation of IRP1 expression in C58 pre-T cells cocultured with NO-producing RAW 264.7 cells. RAW 264.7 cells were grown for 16 h in the presence or absence of 10 units/ml IFN-γ and 50 ng/ml LPS. Cells were washed to remove IFN-γ and LPS before addition of C58 cells. C58 cells were cultured for 1–6 h with control (C) and activated (IFN-γ/LPS) RAW 264.7 cells and then were withdrawn from the macrophage monolayer. Nitrite production was measured in the culture medium at each time point. (A) Cytosolic extracts from C58 cells were analyzed for IRP1–IRE binding activity by EMSA. (B) IRP1 expression in C58 cells was determined by Western blot analysis with anti-IRP1 antiserum.
In addition, we also exposed RAW 264.7 cells to the NO-releasing agent spermine NONOate (Sper/NO) for different times. IRP1 activities and expression then were assessed in parallel. As shown in Fig. 6, incubation with 100 μM Sper/NO induced complete inhibition of IRP1 aconitase activity, 3-fold increase in IRE binding, and 40% reduction of protein expression within 4 h. Similar findings were obtained by exposing cells for 8 h to 1 mM DETA/NO, which is a slower NO releaser. Neither nitrite, nitrate nor “spent” NONOates had any effect. In the same set of experiments, two other structurally different NO donors i.e., S-nitrosoglutathione and S-nitroso-N-acetyl-penicillamine, used at 1 mM, showed the same general trend on IRP1 activities and expression, although they were less effective than DETA/NO (data not shown).
Figure 6.
Effect of Sper/NO on IRP1 activities and expression in RAW 264.7 cells. Cells were treated with 100 μM Sper/NO for different times. (A) Aconitase activity in cytosolic extracts was measured by spectrophotometry. (B) IRP1–IRE binding activity was analyzed by EMSA in the presence or absence of 2% 2-ME, and the radioactivity associated with IRP1–IRE complexes was quantified by PhosphorImaging. IRP1 activity is expressed as the percentage of the value obtained after exposure to 2% 2-ME. (C) IRP1 levels were analyzed by Western blotting and quantified by densitometry. ◊, Control; ■, Sper/NO.
Stimulation with IFN-γ/LPS Decreases IRP1 mRNA Levels.
To gain further insights into the mechanism by which NO decreases IRP1 expression, we analyzed IRP1 mRNA steady-state levels in stimulated cells by Northern blotting. RAW 264.7 cells were first stimulated with IFN-γ/LPS for different times (Fig. 7). Blots were hybridized with a cDNA probe specific for IRP1 and then rehybridized with cDNA probes specific for NOS2 and GAPDH. Interestingly, we observed a time-dependent decrease in IRP1 mRNA in stimulated cells, which was correlated with NOS2 mRNA expression. Indeed, reduction of IRP1 mRNA levels was detectable after 4 h of activation with IFN-γ/LPS and conspicuous after 8 h.
Figure 7.
Time-dependent decrease in IRP1 mRNA levels after exposure to IFN-γ/LPS. RAW 264.7 cells were activated with 10 units/ml IFN-γ and 50 ng/ml LPS for 1–8 h. Total RNA was extracted and assayed for IRP1 and NOS2 mRNA expression by Northern blotting, as described in Materials and Methods. Blots were hybridized sequentially with IRP1 (Top), NOS2 (Middle), and GAPDH (Bottom) 32P-labeled cDNA probes. Data are representative of four independent experiments.
Effect of NO on IRP1 mRNA Down-Regulation.
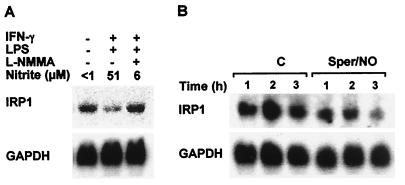
To further examine the role of NO in IFN-γ/LPS-mediated IRP1 mRNA down-regulation, we compared IRP1 mRNA levels from cells treated for 12 h with IFN-γ/LPS, in the absence or presence of l-NMMA. As can be seen from the representative experiment shown in Fig. 8A, stimulation with IFN-γ/LPS for 12 h significantly decreased IRP1 mRNA expression. Densitometric analysis revealed that IRP1 mRNA levels were 56 ± 14% (mean ± SD for 10 independent experiments) of that observed in control cells. It is worth noting that the degree of inhibition of IRP1 mRNA expression at that time was strictly correlated with the amount of NO produced (correlation coefficient 0.916) as determined by nitrite accumulation in the culture medium (data not shown). In agreement with this observation, inhibition of endogenous NO production by addition of l-NMMA prevented the decrease in IRP1 mRNA induced by IFN-γ/LPS treatment (Fig. 8A, compare lanes 2 and 3). Finally, we analyzed the effect of exogenous NO on IRP1 mRNA from RAW 264.7 cells. As can be seen in Fig. 8B, treatment of cells with 100 μM of the NO donor Sper/NO resulted in a time-dependent down-regulation of IRP1 mRNA levels.
Figure 8.
Effect of endogenous and exogenous NO on IRP1 mRNA levels. (A) RAW 264.7 cells were cultured for 16 h with 10 units/ml IFN-γ and 50 ng/ml LPS, in the presence or absence of 1 mM l-NMMA. Nitrite released was measured in the culture medium. Total RNA was extracted and IRP1 mRNA levels were analyzed by Northern blotting with a 32P-labeled IRP1 cDNA probe. (B) Cells were treated with 100 μM Sper/NO for different times. IRP1 mRNA levels were analyzed as described in A.
Discussion
Upon changes in cellular iron or in response to environmental signals, mammalian cells react by inverting the function of IRP1 (1, 2, 25). From aconitase, it becomes an RNA binding protein able to participate in tune adjustment of cellular iron uptake and storage. In previous studies we showed that NO biosynthesis induces concomitant loss of aconitase activity and increase in RNA binding activity of IRP1. Here, we provide evidence that NO also modulates IRP1 expression. Indeed, we report that stimulation of macrophages with IFN-γ and/or LPS decreases IRP1 levels. This decrease in IRP1 expression is time dependent and correlates with the amount of NO produced. We demonstrated that the decrease in IRP1 levels observed after stimulation with IFN-γ/LPS actually depends on NO. This conclusion is based on different experimental approaches. First, incubation of RAW 264.7 cells with the NOS2 competitive inhibitor l-NMMA largely abolished the reduction in IRP1 expression induced by IFN-γ/LPS. Second, no changes in IRP1 levels after stimulation with IFN-γ/LPS could be detected in primary macrophages explanted from the peritoneum of NOS2−/− mice. Finally, down-regulation of IRP1 levels in RAW 264.7 cells could be reproduced by treatment with NO donors. Importantly, reduction of IRP1 expression was limited to about 60%, which suggests a regulatory function. NO-dependent down-regulation of IRP1 expression was not restricted to macrophages because it also was seen in C58 pre-T cells cocultured with NO-producing macrophages. This set of experiments also indicated that NO-mediated down-regulation of IRP1 occurs in a paracrine manner. This may be particularly relevant at inflammatory sites or in vascular tissues where cells susceptible to exhibit NOS2 activity are often present.
Our Northern blot experiments revealed that reduction in IRP1 expression is mainly the consequence of a decrease in mRNA level. Ongoing studies will determine whether NO affects transcription rate or mRNA stability. At first glance, it seems clear that decrease in IRP1 level is simply the extension of reduction in IRP1 mRNA expression. However, NO may well also affect the rate of IRP1 synthesis or degradation. Indeed, careful comparison of the degree of reduction in protein and mRNA levels pointed to a greater reduction of the former (60% vs. 44%). A recent study showed that mitochondrial aconitase could be degraded in vitro by a proteasome-dependent pathway after exposure to peroxynitrite, an NO-derived oxidant (26). The possibility of a proteasome-dependent degradation of IRP1 after exposure to NO was thus considered. However, we could not detect any reversion of NO-mediated IRP1 down-regulation in cells that had been pretreated with the proteasome inhibitors MG 132 and lactacystin (data not shown). Therefore, further experiments will be necessary to determine whether a decrease in the rate of synthesis or accelerated turnover of the protein may contribute to some extent to the NO-mediated reduction in IRP1 levels.
One striking feature is that NO-dependent gain in RNA binding activity of IRP1 and loss of IRP1 expression are concomitant. The two events may coincide if, by chance, NO affects independently, but with the same time course, the activity of IRP1 and its expression, via, for example, the modification of a redox-sensitive trans-regulator or signaling molecule. Alternatively, loss of IRP1 expression may result from an autoregulatory loop, which would involve IRP1 itself after exposure to NO or an NO-derived molecule. The results of our kinetics experiments exclude a delayed feedback mechanism that may result from an accumulation of some uneven form of IRP1. However, it may be rewarding to see whether NO-modified IRP1 can progressively regulate its own expression. In this connection, the case of mitochondrial aconitase is appealing. Indeed, upon NO formation, activity of mitochondrial aconitase is lost (27). In addition, the structure of IRP1 changes enough to accommodate IRE motifs including that present at the 5′ end of mitochondrial aconitase mRNA (28). NO therefore affects both activity and expression of this enzyme. Does NO affect IRP1, i.e., the cytosolic aconitase, similarly? This situation is unlikely because IRE-like structures have not been reported on untranslated regions of IRP1 mRNA (29, 30). Furthermore, our results show that IRP1 mRNA levels decrease in response to NO, whereas regulation through the IRE/IRP system would lead either to no difference in mRNA levels if an IRE-like structure were in a 5′ untranslated region or to an increase if it were located in a 3′ untranslated region (1).
Another crucial question arises as to why IRP1 is altered posttranslationally and is down-regulated transcriptionally or posttranscriptionally by the same chemical signal. As deduced from experiments performed in a cell-free system or with purified recombinant protein, it has long been known that NO or an NO-derived molecule directly inhibits aconitase activity of IRP1 (12, 31). Reduced IRP1 expression therefore exacerbates cytosolic aconitase loss. It is difficult to speculate about the consequence of such an event because the physiological role of cytosolic aconitase thus far has remained an enigma. Alternatively, it may be more fruitful to go thoroughly into the question of a possible balancing of IRP1 RNA binding activity. Indeed binding to IRE sequences present on mRNA of several proteins, particularly ferritin and transferrin receptor, is considered as the cardinal activity of IRP1. NO increases RNA binding by IRP1 through direct interaction with the protein, very likely by hitting its 4Fe-4S cluster (31). Sustained production of NO by NOS2 can last many hours and, at least during this time frame, IRP1 activation by NO is not reversible. Hence, the intrinsic nature of the interaction between NO and IRP1 makes it hardly controllable. Enhanced affinity of NO-modified IRP1 for IREs in the ferritin mRNA represses ferritin translation and therefore iron storage (13), which should result in an increase in intracellular free iron levels. This may be hazardous for the cell as an excess of free iron can catalyze the formation of noxious hydroxyl radicals by the Fenton reaction. It therefore makes sense that a regulatable and limited decrease in IRP1 gene expression could temper the somewhat rough NO-dependent reaction that boosts RNA binding by IRP1. This regulatory mechanism may be of particular importance in limiting the expansion of the catalytically active iron pool when the cell has to cope with a sustained and risky inhibition of ferritin translation.
There are few examples of proteins whose activity and expression are oppositely regulated at two different levels by the same effector. If we focus on NO, the two-level modulation of IRP1 is reminiscent of that of c-fos and cyclooxygenase-2. Indeed, an in vitro study showed that activity of purified recombinant c-fos (DNA binding by AP-1) was inhibited after S-nitrosation of Cys154 (32). Besides, other independent studies have demonstrated an NO-dependent up-regulation of c-fos promoter activity, thus increasing mRNA levels (33, 34). As regards cyclooxygenase-2, it has been reported that NO produced by LPS-stimulated rat macrophages down-regulates protein expression by decreasing mRNA levels (35), whereas NO also directly increases enzyme activity, presumably by acting directly on its heme prosthetic group (36). Strikingly, another example is provided by E. coli aconitase whose activity is inhibited by O2− or NO (37, 38), whereas its promoter is activated by the same signals via activation of the SoxRS regulon (39). However, these data were obtained by different investigators under various experimental conditions. Our report describes a dual control on both expression and activity by NO, in parallel and under physiological conditions.
Looking ahead, the regulatory mechanism we describe here may represent an adaptation to nitrosative stress not restricted to IRP1. It is tempting to speculate that expression of other proteins with NO-sensitive redox active cysteine(s) or metals also may be modulated by NO as a compensatory mechanism. Future investigations are thus requisite to see whether the double effect of NO on both activity and expression of IRP1 is a more general type of regulation that applies to other NO-targeted proteins.
Acknowledgments
We are grateful to Dr. C. Bouton, Dr. L. Kühn, and Dr. D. Touati for helpful discussions. We thank Dr. J. Mudgett (Merck, Rahway, NJ) for providing the NOS2-deficient mice. This work was supported by a grant from the Portuguese Fundação para a Ciência e Tecnologia (PRAXIS XXI/BD/2691/94) and by the Program Chemistry and Physics of the Living Forms (Centre National de la Recherche Scientifique).
Abbreviations
- IRP
iron regulatory protein
- IRE
iron responsive element
- LPS
lipopolysaccharide
- 2-ME
2-mercaptoethanol
- NOS2
NO synthase 2
- l-NMMA
N-monomethyl-l-arginine
- EMSA
electrophoretic mobility-shift assay
- DETA/NO
diethylenetriamine NONOate
- Sper/NO
spermine NONOate
- GAPDH
glyceraldehyde phosphatedehydrogenase
Footnotes
This paper was submitted directly (Track II) to the PNAS office.
Article published online before print: Proc. Natl. Acad. Sci. USA, 10.1073/pnas.120571797.
Article and publication date are at www.pnas.org/cgi/doi/10.1073/pnas.120571797
References
- 1.Klausner R D, Rouault T A, Harford J B. Cell. 1993;72:19–28. doi: 10.1016/0092-8674(93)90046-s. [DOI] [PubMed] [Google Scholar]
- 2.Hentze M W, Kühn L C. Proc Natl Acad Sci USA. 1996;93:8175–8182. doi: 10.1073/pnas.93.16.8175. [DOI] [PMC free article] [PubMed] [Google Scholar]
- 3.Eisenstein R S, Blemings K P. J Nutr. 1998;128:2295–2298. doi: 10.1093/jn/128.12.2295. [DOI] [PubMed] [Google Scholar]
- 4.Guo B, Brown F M, Phillips J D, Yu Y, Leibold E A. J Biol Chem. 1995;270:21645–21651. doi: 10.1074/jbc.270.37.21645. [DOI] [PubMed] [Google Scholar]
- 5.Iwai K, Klausner R D, Rouault T A. EMBO J. 1995;14:5350–5357. doi: 10.1002/j.1460-2075.1995.tb00219.x. [DOI] [PMC free article] [PubMed] [Google Scholar]
- 6.Henderson B R. BioEssays. 1996;18:739–746. doi: 10.1002/bies.950180909. [DOI] [PubMed] [Google Scholar]
- 7.Tang C K, Chin J, Harford J B, Klausner R D, Rouault T A. J Biol Chem. 1992;267:24466–24470. [PubMed] [Google Scholar]
- 8.Pantopoulos K, Gray N K, Hentze M W. RNA. 1995;1:155–163. [PMC free article] [PubMed] [Google Scholar]
- 9.Haile D J, Rouault T A, Harford J B, Kennedy M C, Blondin G A, Beinert H, Klausner R D. Proc Natl Acad Sci USA. 1992;89:11735–11739. doi: 10.1073/pnas.89.24.11735. [DOI] [PMC free article] [PubMed] [Google Scholar]
- 10.Beinert H, Kennedy M C. FASEB J. 1993;7:1442–1449. doi: 10.1096/fasebj.7.15.8262329. [DOI] [PubMed] [Google Scholar]
- 11.Kennedy M C, Mende-Mueller L, Blondin G A, Beinert H. Proc Natl Acad Sci USA. 1992;89:11730–11734. doi: 10.1073/pnas.89.24.11730. [DOI] [PMC free article] [PubMed] [Google Scholar]
- 12.Drapier J C, Hirling H, Wietzerbin J, Kaldy P, Kuhn L C. EMBO J. 1993;12:3643–3649. doi: 10.1002/j.1460-2075.1993.tb06038.x. [DOI] [PMC free article] [PubMed] [Google Scholar]
- 13.Weiss G, Goossen B, Doppler W, Fuchs D, Pantopoulos K, Werner-Felmayer G, Wachter H, Hentze M W. EMBO J. 1993;12:3651–3657. doi: 10.1002/j.1460-2075.1993.tb06039.x. [DOI] [PMC free article] [PubMed] [Google Scholar]
- 14.Oliveira L, Bouton C, Drapier J C. J Biol Chem. 1999;274:516–521. doi: 10.1074/jbc.274.1.516. [DOI] [PubMed] [Google Scholar]
- 15.Pantopoulos K, Hentze M W. EMBO J. 1995;14:2917–2924. doi: 10.1002/j.1460-2075.1995.tb07291.x. [DOI] [PMC free article] [PubMed] [Google Scholar]
- 16.Schalinske K L, Eisenstein R S. J Biol Chem. 1996;271:7168–7176. doi: 10.1074/jbc.271.12.7168. [DOI] [PubMed] [Google Scholar]
- 17.Hanson E S, Leibold E A. J Biol Chem. 1998;273:7588–7593. doi: 10.1074/jbc.273.13.7588. [DOI] [PubMed] [Google Scholar]
- 18.Bouton C, Oliveira L, Drapier J C. J Biol Chem. 1998;273:9403–9408. doi: 10.1074/jbc.273.16.9403. [DOI] [PubMed] [Google Scholar]
- 19.Hentze M W, Rouault T A, Harford J B, Klausner R D. Science. 1989;244:357–359. doi: 10.1126/science.2711187. [DOI] [PubMed] [Google Scholar]
- 20.Drapier J C, Hibbs J B., Jr J Clin Invest. 1986;78:790–797. doi: 10.1172/JCI112642. [DOI] [PMC free article] [PubMed] [Google Scholar]
- 21.Drapier J C, Hibbs J B., Jr Methods Enzymol. 1996;269:26–36. doi: 10.1016/s0076-6879(96)69006-5. [DOI] [PubMed] [Google Scholar]
- 22.Leibold E A, Munro H N. Proc Natl Acad Sci USA. 1988;85:2171–2175. doi: 10.1073/pnas.85.7.2171. [DOI] [PMC free article] [PubMed] [Google Scholar]
- 23.Mullner E W, Neupert B, Kühn L C. Cell. 1989;58:373–382. doi: 10.1016/0092-8674(89)90851-9. [DOI] [PubMed] [Google Scholar]
- 24.Henderson B R, Seiser C, Kühn L C. J Biol Chem. 1993;268:27327–27334. [PubMed] [Google Scholar]
- 25.Bouton C. Cell Mol Life Sci. 1999;55:1043–1053. doi: 10.1007/s000180050355. [DOI] [PMC free article] [PubMed] [Google Scholar]
- 26.Grune T, Blasig I E, Sitte N, Roloff B, Haseloff R, Davies K J A. J Biol Chem. 1998;273:10857–10862. doi: 10.1074/jbc.273.18.10857. [DOI] [PubMed] [Google Scholar]
- 27.Drapier J C. Methods. 1997;11:319–329. doi: 10.1006/meth.1996.0426. [DOI] [PubMed] [Google Scholar]
- 28.Gray N K, Pantopoulous K, Dandekar T, Ackrell B C A, Hentze M. Proc Natl Acad Sci USA. 1996;93:4925–4930. doi: 10.1073/pnas.93.10.4925. [DOI] [PMC free article] [PubMed] [Google Scholar]
- 29.Rouault T A, Tang C K, Kaptain S, Burgess H W, Haile D J, Samaniego G, McBride O W, Harford J P, Klausner R D. Proc Natl Acad Sci USA. 1990;87:7958–7962. doi: 10.1073/pnas.87.20.7958. [DOI] [PMC free article] [PubMed] [Google Scholar]
- 30.Hirling H, Emery-Godman A, Thompson N, Neupert B, Seiser C, Kuhn L C. Nucleic Acids Res. 1992;20:33–39. doi: 10.1093/nar/20.1.33. [DOI] [PMC free article] [PubMed] [Google Scholar]
- 31.Kennedy M C, Antholine W E, Beinert H. J Biol Chem. 1997;272:20340–20347. doi: 10.1074/jbc.272.33.20340. [DOI] [PubMed] [Google Scholar]
- 32.Nikitovic D, Holmgren A, Spyrou G. Biochem Biophys Res Commun. 1998;242:109–112. doi: 10.1006/bbrc.1997.7930. [DOI] [PubMed] [Google Scholar]
- 33.Peunova N, Enikolopov G. Nature (London) 1993;364:450–453. doi: 10.1038/364450a0. [DOI] [PubMed] [Google Scholar]
- 34.Haby C, Lisovoski F, Aunis D, Zwiller J. J Neurochem. 1994;62:496–501. doi: 10.1046/j.1471-4159.1994.62020496.x. [DOI] [PubMed] [Google Scholar]
- 35.Habib A, Bernard C, Lebret M, Creminon C, Esposito B, Tedgui A, Maclouf J. J Immunol. 1997;158:3845–3851. [PubMed] [Google Scholar]
- 36.Salvemini D, Misko T P, Masferrer J L, Seibert K, Curie M G, Needleman P. Proc Natl Acad Sci USA. 1993;90:7240–7244. doi: 10.1073/pnas.90.15.7240. [DOI] [PMC free article] [PubMed] [Google Scholar]
- 37.Flint D H, Tuminello J F, Emptage M H. J Biol Chem. 1993;268:22369–22376. [PubMed] [Google Scholar]
- 38.Gardner P R, Constantino G, Szabo C, Salzman A L. J Biol Chem. 1997;272:25071–25076. doi: 10.1074/jbc.272.40.25071. [DOI] [PubMed] [Google Scholar]
- 39.Demple B. Gene. 1996;179:53–57. doi: 10.1016/s0378-1119(96)00329-0. [DOI] [PubMed] [Google Scholar]


