Abstract
Repolarization abnormalities, including those induced by the congenital or acquired long QT (LQT) syndrome, provide a substrate for life-threatening cardiac arrhythmias. In this article, we use computational biology to link HERG mutations mechanistically to the resulting abnormalities of the whole-cell action potential. We study how the kinetic properties of IKs (the slow delayed rectifier) that are conferred by molecular subunit interactions, facilitate its role in repolarization and ‘repolarization reserve’. A new non-invasive imaging modality (electrocardiographic imaging) is shown to image cardiac repolarization on the epicardial surface, suggesting its possible role in risk stratification, diagnosis and treatment of LQT syndrome.
Keywords: cardiac arrhythmias, cardiac electrophysiology, electrocardiography, long QT syndrome
Introduction
Depolarization of the cardiac action potential (AP) is generated, under most conditions, by activation of and current flow through the fast Na+ channels. In contrast to this ‘single-current’ mechanism, AP repolarization depends on a very delicate balance between several inward (e.g. L-type Ca2+) and outward currents. Whilst the ‘multiple-current’ mechanism of repolarization provides precise control of the AP duration (a necessary property that allows the AP to adapt to changes in heart rate), the delicate balance is easily perturbed by abnormal ion channel function and by interventions such as drugs. The ‘Second Key Symposium’ in Stockholm addressed abnormal cardiac repolarization and its role in arrhythmogenesis. In particular, the meeting focused on the long QT (LQT) syndrome (hereditary and acquired), its molecular basis and its clinical manifestations. In recent years, we have witnessed unparalled advances in our ability to identify genetic mutations and link them to clinical disease phenotypes. At the same time, major advances were made in our understanding of molecular processes that underlie disease, including mutation-induced alterations in ion channel function in the LQT syndrome [1]. Because ion channel function is studied mostly in isolation (e.g. in Xenopus oocyte or HEK cells), away from the cellular physiological environment where the channels normally operate, a challenge remains to integrate the ion channels back into the physiological system. By doing so, a mechanistic link can be established between altered channel function and the abnormal functioning of the cell, the organ, and the whole organism. Experimentally, genetically engineered animals (mostly transgenic mice) have been used to make the genotype–phenotype mechanistic connection. We developed and applied computational biology approaches to this problem, in the context of cardiac arrhythmia [2].
This article, which is based on my presentation at the ‘Key Symposium’, provides examples of how computational biology (mathematical modelling) can be used to provide a mechanistic link between ion channel mutations and their electrophysiological consequences at the whole-cell level. Specifically, mutations in HERG that cause the LQT syndrome are investigated [3]. Additionally, we study the molecular basis of IKs (the slow delayed rectifier) participation in AP repolarization [4]. We use these studies to revisit, from a theoretical perspective, two important concepts associated with the LQT syndrome namely the ‘loss of function/gain of function’ concept and the ‘repolarization reserve’ concept. Finally, a new noninvasive imaging modality for cardiac electrophysiology and arrhythmia, called Electrocardiographic Imaging (ECGI), is introduced and its ability to image cardiac repolarization and reentrant arrhythmias is examined [5]. The material covered in this review article has been published previously [3–5]; additional details can be found in the original publications [3–5].
Methods
The general approach for modelling the AP is the same as described for the dynamic Luo–Rudy (LRd) model of a cardiac ventricular cell [6–8]. For simulating ion channel mutations, a Markov model of the channel is formulated from the single-channel kinetics [2, 3, 9]. Figure 1 shows the LRd cell model and the Markovian model for IKr (the rapid delayed rectifier) used in the simulations of HERG mutations [3]. For the IKs study a similar strategy is used, except that a Markovian IKs model is introduced into the LRd model cell [4]. ECGI combines over 200 body surface electrocardiograms with heart-torso geometry obtained from computed tomography (CT) to compute potentials, electrograms and isochrones (activation sequences) on the epicardial surface of the heart [5]. All protocols were approved by the Institutional Review Board at University Hospitals of Cleveland. A diagram describing the ECGI procedure is included in the imaging section of this article; details can be found in Ramanathan et al. [5].
Fig. 1.
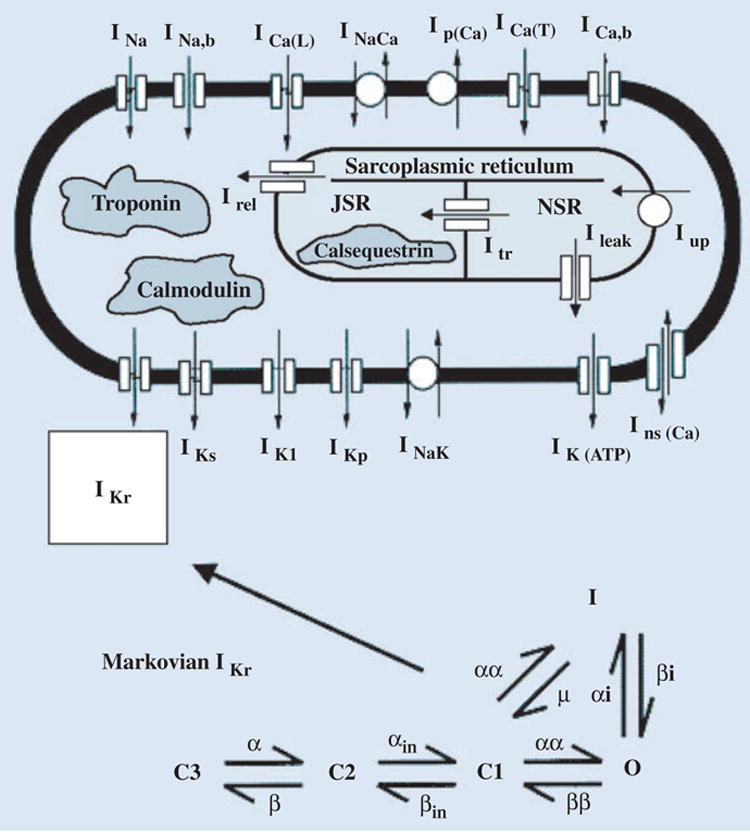
Integrating ion channel kinetics into the whole-cell model. To relate ion channel properties to whole-cell function, a Markov model of the channel is introduced into the Luo–Rudy dynamic (LRd) model of a cardiac ventricular cell [6–8]. For simulating HERG mutations [3], the Markovian model of IKr includes three closed states (C3, C2, C1), an open state (O), and an inactivated state (I). Details can be found at http://rudylab.wustl.edu. Reproduced with permission from Clancy and Rudy [3].
Results
HERG mutations and LQT2: reexamination of the ‘gain of function/loss of function’ concept
A variety of mutations in HERG, the major subunit of the rapidly activating potassium current IKr, underlie the congenital LQT syndrome, LQT2 [10]. Many of these mutations exert their effects through trafficking defects that prevent expression of the IKr channels at the cell membrane [11]. Other mutations alter the channel function and kinetic properties. Obviously, complete absence of IKr because of abnormal trafficking amounts to total ‘loss of function’ of this current. The resulting reduction in total repolarizing current during the late AP plateau (to a good approximation the sum of IKr and the slowly activating potassium current IKs [6, 8, 12]) causes AP prolongation which is reflected as prolongation of the Q-T interval on the ECG, the LQT phenotype. The mechanism through which mutation-induced changes in channel kinetics cause AP prolongation and LQT is not so obvious and requires careful investigation. We use computational biology approaches (see Methods) to study the effects of selected HERG mutations that alter channel kinetics on the AP [3]. We use this study to examine whether the presently accepted rule that ‘loss of function of channels that carry a repolarizing current results in AP prolongation, whilst gain of function of such channels results in AP shortening’ is always true and is sufficient to describe the effects of ion channel mutations on the AP and the ECG.
Three well-characterized defects that alter cell electrophysiology through their effects on channel properties were chosen as examples (Fig. 2). The first, T474I point mutation in the S2–S3 linker, shifts the activation curve to more negative potentials (experimentally measured V1/2 is shifted by −27.3 mV relative to wild type (WT) [13]). This shift represents ‘gain of function’ because the current activates earlier during the AP, generating a larger current. However, the experiments also measure reduction in macroscopic current density [13, 14]. These changes are simulated in the IKr Markov model (Fig. 1) by altering the voltage dependence of activation transition rates (C1 to C2 and C3 to O, to achieve the voltage shift of activation) and by reducing GKr, the maximum membrane conductance for IKr, by 35% (to simulate the observed reduction in macroscopic current).
Fig. 2.
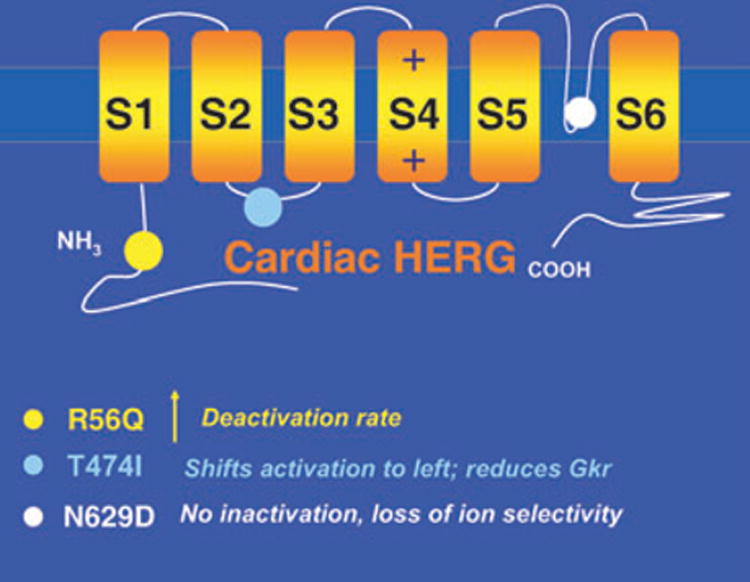
HERG mutations. Structure of cardiac HERG showing locations of mutations simulated in this study (colour circles). Kinetic changes caused by the mutations are summarized below the diagram (colour coded).
The second mutation, R56Q, is a point mutation in the Per-Arnt-Sim domain in the amino-terminus (N-terminus) of HERG, which normally interacts with the channel to reduce the rate of deactivation [15]. Mutations in this region appear to prevent proper interaction of the N-terminus with the channel, thereby acting to increase the rate of channel deactivation. We simulate this effect by increasing the transition rate from the open state of the channel to its closest closed state (the process of deactivation) as well as into deeper closed states (from C2 to C3 in the model of Fig. 1). Note that acceleration of deactivation amounts to ‘loss of function’ (the channel stays for a shorter time in its open, conducting state) and reduction of IKr current.
The third mutation, N629D, results in loss of C-type inactivation together with loss of K+ selectivity (the mutant channel can conduct other monovalent cations) [16]. These changes represent ‘gain of function’ because the channel does not inactivate and can rely on Na+, in addition to K+, as charge carrier. Within the accepted scheme of rules, a gain of function of IKr is expected to generate a greater repolarizing current and shorten the AP. Yet the mutation is associated, seemingly paradoxically, with LQT [16]. The alterations in channel function were simulated in the IKr Markov model by eliminating C-type inactivation (setting the O to I transition rate to zero; Fig. 1) and by allowing Na+ to pass through the channel with relative selectivity PNa/PK = 0.65 [16].
Once the mutations are simulated at the ion channel level, the model channels are introduced into the whole-cell model (guinea-pig ventricular myocyte [6–8]) (Fig. 1) to examine the cellular electrophysiological consequences of the mutations. Figure 3 provides a comparison of APs from WT IKr, T474I and R56Q. IKr current and occupancy of the different channel states during the AP are also shown. Normally (WT, left column), during the AP upstroke channels move from the farthest closed state, C3, through C2 to C1 from which they can open (O) or inactivate directly (I). Channels that open, rapidly inactivate (transition form O to I). The dynamic balance between inactivation (O to I) and recovery from inactivation (I to O) progressively favours recovery as the AP plateau repolarizes. This dynamic balance generates a pronounced peak of open-state occupancy (O) late during the AP plateau (arrow, panel f of Fig. 3). Following the peak, channels slowly deactivate (transition from O to C1). The late peak of open channel occupancy in the WT cell ensures that the IKr current (panel b) peaks late during the AP, when it is most effective in influencing repolarization and AP duration (at this time the AP depends on a very delicate balance between inward and outward currents and is easily modulated [6, 8, 12]).
Fig. 3.
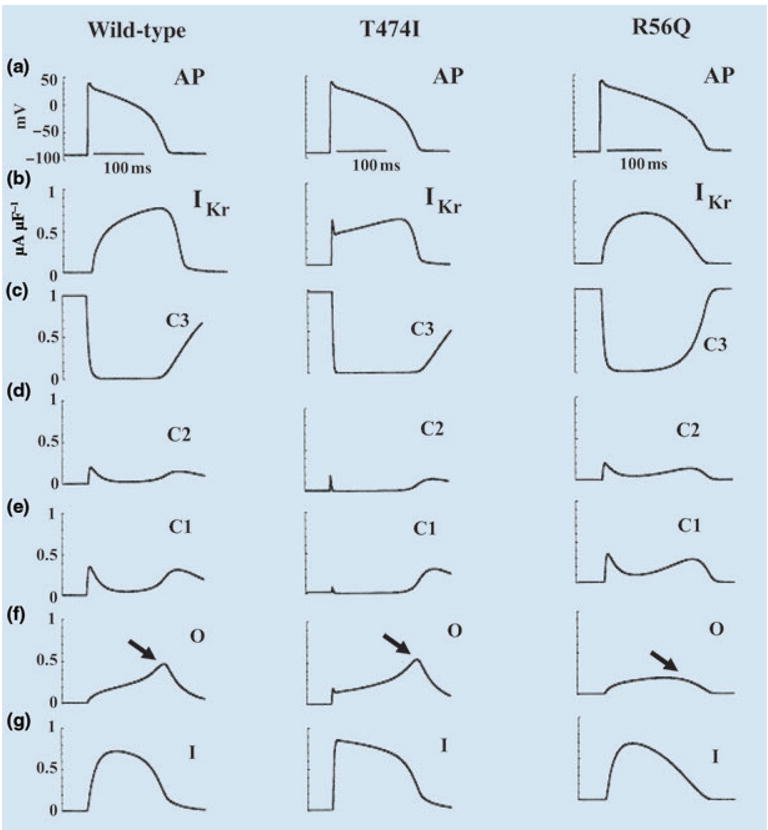
Effects of HERG mutations on the action potential (AP). (a) The AP (1000th paced beat) at a cycle length CL = 750 ms. (b) IKr during the AP. (c–g) The probabilities of residence in the indicated channel states over the course of the AP. Left column: wild-type; middle column: T474I mutation; right column: R56Q mutation. Reproduced with permission from Clancy and Rudy [3].
The middle column of Fig. 3 shows the same information for the T474I mutant. There is only minor prolongation of AP duration relative to WT, caused by the reduction of GKr. The kinetic abnormality caused by the mutation (earlier activation) alters IKr early during the AP (panel b), when it has very little effect on AP repolarization. The late peak of open-state occupancy (panel f, arrow) is preserved, ensuring that IKr increases during the AP and reaches its maximum magnitude late in the AP (as in WT), when it has a major influence on repolarization and AP duration.
The right-hand column of Fig. 3 shows the results of the R56Q mutation. Unlike T474I, R56Q causes a large prolongation of the AP (by 33 ms relative to WT at a pacing cycle length of 750 ms). The large effect is a consequence of the altered kinetics of the mutant channels. Whilst open-state occupancy and IKr of the mutant are similar to WT at the beginning of the AP, they are very different during the late AP plateau and repolarization phase. The increased rate of deactivation (O to C1 transition) in the mutant removes the late peak of open-state residency (panel f, arrow) and the corresponding peak of IKr. Therefore, IKr contributes less repolarizing current late in the AP where it usually plays a major role in repolarization. The consequence is a major prolongation of the AP.
Figure 4 shows the effects of the N629D ‘gain of function’ mutation on the AP in epicardial and midmyocardial M cells. APs and corresponding IKr traces are shown. Because of the altered ion selectivity, the reversal potential for mutant IKr increases to −13 mV, a value that falls in the range of AP plateau potentials. Consequently, IKr early during the AP is an outward current carried by K+; however, it reverses direction as the membrane repolarizes below −13 mV. This late inward current (arrows in Fig. 4), carried by Na+, causes severe prolongation of epicardial AP (by 80 ms). In M cells, where IKs expression is smaller [17], the late IKr inward current is sufficient to cause the generation of arrhythmogenic early afterdepolarizations (EADs) [18]. This HERG mutation generates a late inward current, carried by Na+, that prolongs the AP to cause LQT2. Interestingly, this mechanism closely resembles the effects of ‘gain of function’ mutations in SCN5A (the sodium channel-encoding gene) that generate a late Na+ current during the AP to cause LQT3 [2, 19].
Fig. 4.
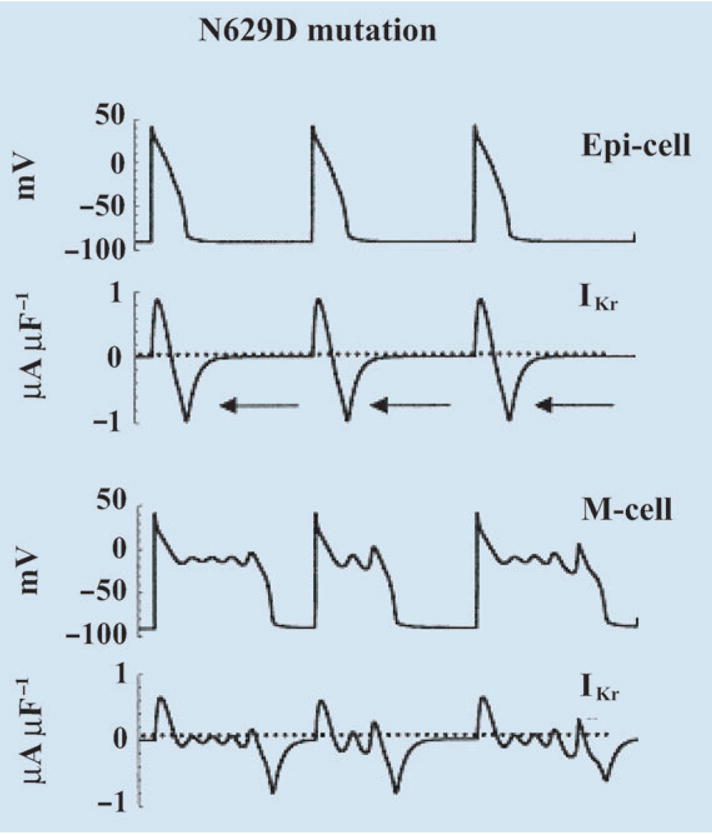
Simulation of HERG N629D mutation. Action potential (AP) and IKr during the AP are shown for epicardial cell (top) and M cell (bottom). Adapted with permission from Clancy and Rudy [3].
An important conclusion emerges from the simulations described above: the AP phenotypic consequences of mutations that alter ion channel kinetic properties depend on the details of the change and the time during the AP when it exerts its effects, not simply on whether it causes ‘loss or gain of function’. In the examples shown here, accelerated activation (T474I) has a minor effect because it manifests early during the AP, whilst accelerated deactivation (R56Q) has a major effect because it affects the late AP plateau. Moreover, a ‘gain of function’ mutation in HERG (N629D), a repolarizing channel, causes AP prolongation.
Role of IKs in cardiac repolarization: reexamination of the ‘repolarization reserve’ concept
Repolarization of the cardiac AP is controlled by a delicate balance between inward (depolarizing) and outward (repolarizing) currents. In large mammals, the outward current during phases 2 and 3 of the AP is carried by only two channels, IKr and IKs, with IKr playing the primary role, especially under low β-adrenergic tone. Several facts indicate that IKs plays an important role in AP repolarization: (i) mutations in the IKs subunits KCNQ1 and KCNE1 cause the LQT syndrome (LQT1 and LQT5 respectively) [20, 21]. (ii) Transmural heterogeneity of IKs expression is a major determinant of the unique rate-dependent repolarization properties of midmyocardial M cells [17]. (iii) β-adrenergic signalling molecules are incorporated in the IKs structure, suggesting an important role in AP rate-adaptation under β-adrenergic stimulation [22].
The properties described above suggest an important role for IKs in repolarization and its rate dependence. Importantly, the fact that AP repolarization occurs when IKr is compromised by disease (e.g. HERG mutations) or drugs, suggests that IKs can ‘rise to the task’ and provide sufficient repolarization current to compensate for the reduced IKr. This phenomenon has been termed ‘repolarization reserve’ [23].
Despite the evidence above, a controversy still exists as to the role of IKs in AP repolarization and its rate dependence. The controversy stems from the kinetic properties of IKs in large mammals, where IKs is characterized by slow, delayed activation and relatively fast deactivation. Our understanding of the mechanism by which IKs contributes to AP shortening as rate increases (a characteristic property of cardiac cells, termed adaptation, that is essential for normal functioning) is based on experiments in the guinea-pig, where IKs deactivation is slow [24]. With slow deactivation, channels do not have sufficient time to deactivate (close) between beats at fast rates and they accumulate in the open (conducting) state, generating a greater repolarizing current at the onset and during every AP, shortening its duration [8, 12]. The question is how can IKs in large mammals, where deactivation is faster, participate in rate-dependent AP repolarization (adaptation) without (or with minimal) channel accumulation in the open state between beats as rate increases?
To resolve this controversy, we conducted computational studies [4] to test the following hypothesis: IKs can participate in repolarization and provide repolarization reserve due to kinetic properties conferred by interaction between its subunits KCNQ1 and KCNE1; the kinetics are such that open state accumulation is not necessary for effective participation of IKs in repolarization. To this end we developed kinetic (Markov) models of KCNQ1 and IKs channels and examined their behaviour during the AP in the whole-cell environment at various (fast and slow) pacing rates.
Models of KCNQ1 and IKs
The α-subunit of IKs, KCNQ1, is a six-transmembrane domain protein (Fig. 5); four KCNQ1 proteins can form a functional homomeric potassium channel. KCNQ1 proteins can also co-assemble with KCNE1, a protein containing a single transmembrane domain to form the IKs channel. Because the S4 domain in each KCNQ1 protein serves as a voltage sensor for voltage-dependent gating (Fig. 5), the tetramers that form the KCNQ1 and the IKs channels contain four voltage sensors. Functional and structural studies in Shaker K+ channels [25, 26] suggest that each voltage sensor undergoes independently through two conformational changes before channel opening. A delay in activation of KCNQ1 [27] and IKs [28] is consistent with two voltage sensor transitions before channel opening. Figure 6 depicts the voltage sensor transitions that lead to channel opening. For the channel at rest, all four voltage sensors are in their resting position (blue), a closed state indicated by C1. Upon depolarization, any of the four voltage sensors can go into an intermediate state (red) via a first transition (C2–C5). Voltage sensors already at their intermediate state can go through a second transition to the activated (final) state (green) before channel opening. All the possibilities (e.g. a single sensor in its activated state, C6; one sensor activated and another in intermediate state, C7, etc.) lead to 15 closed states (C1–C15, as shown in Fig. 6). Note that the first transitions (horizontal in Fig. 6) are an order of magnitude slower than the second transitions (vertical in Fig. 6). Once all voltage sensors are activated (green, C15), there is a voltage-independent transition to the open state, O [29, J. Cui, pers. comm.].
Fig. 5.
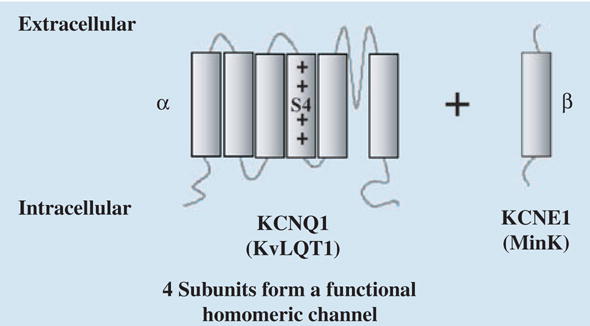
Structure and subunits of IKs. Diagram shows the KCNQ1 (α) and KCNE1 (β) subunits of IKs. S4 is the voltage sensor. The α and β subunits have also been named KvLQT1 and MinK.
Fig. 6.
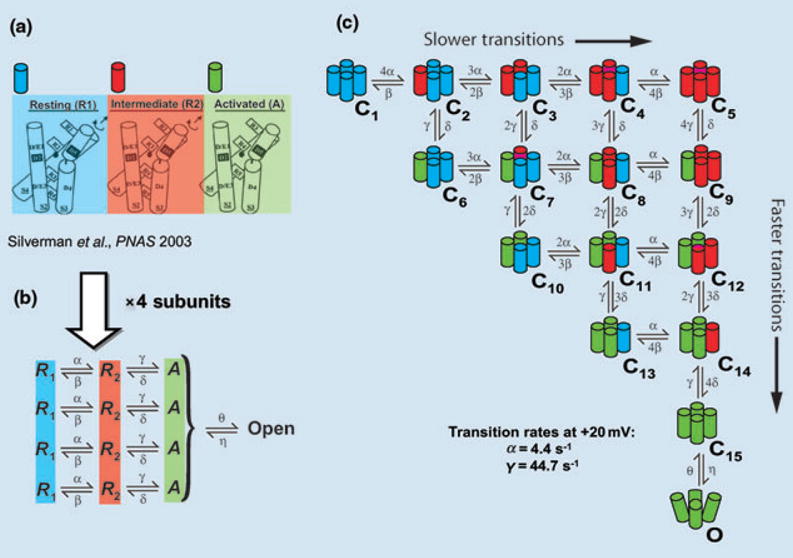
Conformational changes of IKs during activation. (a) Structural basis for two voltage sensor transitions before channel opening [26]. (b) Kinetic representation of the two voltage sensor transitions in panel a; all four α subunits that form the channel undergo a first transition from a resting state (R1) to an intermediate state (R2) and a second transition from R2 to an activated state (A). Once all voltage sensors are in the activated state, the channel can open. (c) All combinations of voltage sensor states in the four subunits can be represented by 15 closed states before channel opening. Blue, red, green indicate a voltage sensor in state R1, R2 or A respectively. Panel a is based on data from the ether –á-go-go (eag) and Shaker K+ channels and is adapted with permission from reference Silverman et al. [26].
Figure 7 shows the Markov models for KCNQ1 (panel a) and IKs (panel b). The closed states, C1–C15, represent the voltage sensor transitions described above. Note that we have distinguished the closed states that have completed all first transitions of the voltage sensors and only have to undergo second (fast) transitions before opening. These states (C5–C15; shown in blue) form zone 1 of closed states that are close to the open state; they are able to rapidly transit to the open state and generate current. The remaining closed states (shown in green) still require first (slow) transitions of voltage sensors; they are therefore more remote kinetically from the open state and grouped into zone 2. For KCNQ1, five open states allow channels to occupy open states far from the closed state (O4 and O5, Fig. 7a), which delays deactivation during a short hyperpolarizing pulse as observed experimentally [27]. KCNQ1 also demonstrates rapid and voltage-dependent inactivation [27], represented in the model by the inactivated state, I. The IKs model (Fig. 7b) resembles that of KCNQ1, with the number of open states truncated to 2 and inactivation removed [27]. For IKs, first transitions of voltage sensors are slower than those for KCNQ1, resulting in longer occupancy of channels in zone 2 and longer delay before activation, as observed experimentally [28]. The models of Fig. 7 were validated extensively using experimental data; details can be found in reference [4].
Fig. 7.
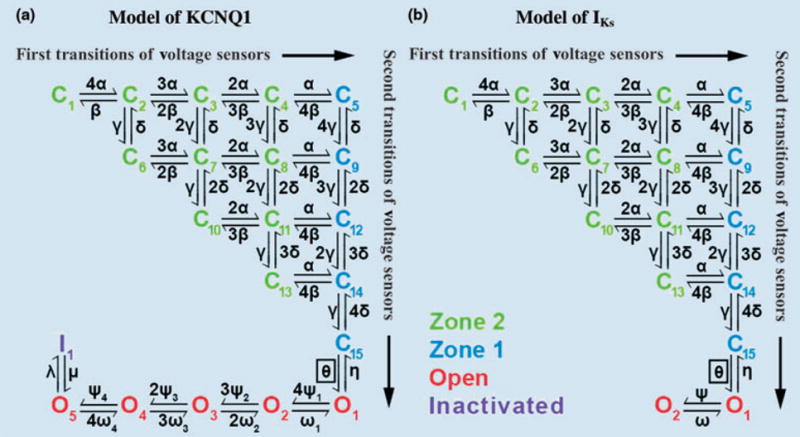
Markov models of KCNQ1 and IKs channels. Both models contain 15 closed states. Green closed states represent channels in zone 2 that have not completed yet all first transitions of their four voltage sensors. Blue closed states represent channels in zone 1 that have completed first transition of all voltage sensors. (a) KCNQ1 model includes five open states (O1–O5, red) and an inactivated state (I, purple). (b) IKs contains two open states with no inactivation. Reproduced with permission from Silva and Rudy [4].
IKs role in rate adaptation of AP duration: the concept of ‘available reserve’
Figure 8 shows whole-cell AP (panel a) during fast and slow pacing. The IKs model of Fig. 7b was inserted into the LRd ventricular cell model for this simulation. As expected, AP shortens at the faster rate (adaptation). Examination of IKs during the AP (panel b) shows very little instantaneous current at AP onset (indicative of minimal open-state accumulation) at fast rate. Instead, IKs increases faster at the faster rate to provide close to 20% greater mean current than at the slow rate during the AP, thereby accelerating repolarization and causing AP shortening. This ability of IKs to increase rapidly at fast rate is a result of its closed-state transitions, rather than open-state accumulation as commonly assumed. Figure 8(c,d) shows total occupancy in zone 2 (green), zone 1 (blue), and the open states O1 and O2 (red). At slow pacing (Fig. 8c), most IKs channels reside in zone 2 before AP depolarization and must make a slow transition into zone 1 before opening. In contrast, at fast rate (Fig. 8d), channels accumulate in zone 1 between APs, allowing IKs to activate rapidly during the AP. There is not sufficient time between beats for channels to transition back to zone 2 before the next AP, as at slow rate. Thus, at fast rate there is a build up of an ‘available reserve’ (AR) of channels in zone 1, from which they are ready to open very rapidly on demand. Transitions from the AR closed states to the open states generate the rapid rise of IKs during the AP that shortens effectively the AP duration. This novel concept of AR as a mechanism for IKs participation in rate-dependent repolarization is supported by AP clamp experiments at fast and slow rates [30]. The experiments show minimal open-state accumulation, but faster activation of IKs at fast than at slow rate, as simulated by the model (Fig. 5 of Silva and Rudy [4]).
Fig. 8.
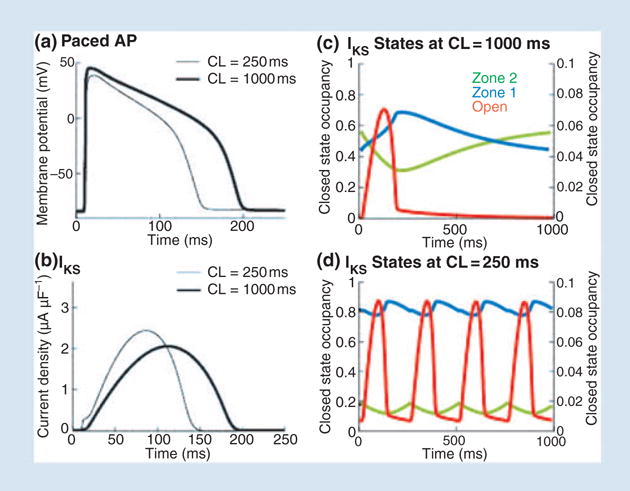
Role of IKs in rate-adaptation of action potential (AP) duration. (a) AP during pacing at slow (CL = 1000 ms, thick line) and fast (CL = 250 ms, thin line) rate. (b) Corresponding IKs, computed using a guinea-pig-based model of the current. (c) State occupancy in zone 2 (green), zone 1 (blue) and in the open state (red) during the AP at slow rate. (d) State occupancy at fast rate (same format as panel c); note accumulation in zone 1. Reproduced with permission from Silva and Rudy [4].
Figure 9 compares the AP rate-adaptation capabilities of IKs and KCNQ1. A comparison of panels a and b demonstrates that IKs is much more effective than KCNQ1 in shortening the AP at fast rate. This is also evident from the AP duration adaptation curves in panel f. The IKs-based adaptation curve (solid) is steeper than that of KCNQ1 (dashed), indicating greater change of AP duration as a function of rate and much better adaptability to rate changes. A comparison of panels c and d shows that KCNQ1 (panel d) exerts its shortening effect at fast rate by generating large instantaneous current at the AP onset (arrow) which does not increase any further during the AP. The large instantaneous current is a consequence of open-state accumulation between beats due to the relatively slow deactivation kinetics of KCNQ1. In contrast, IKs (panel c) shows minimal open-state accumulation at fast rate (arrow), but fast increase of current during the AP leads to a much larger peak current than at slow rate late during the AP plateau, when it has a major effect on repolarization. This ‘delayed action’ of IKs results from its build up of AR (zone 1 closed states) at fast rate. Panel e compares zone 1 accumulation at fast rate of KCNQ1 and IKs; as rate increases from cycle length of 1000 to 250 ms, increase in zone 1 residency of IKs channels is 0.25 (black) whilst that of KCNQ1 channels is only 0.04 (grey). Thus, KCNQ1 channels open early during the AP when they have limited effect on repolarization. In contrast, IKs channels open late during the AP when they can influence repolarization in a major way.
Fig. 9.
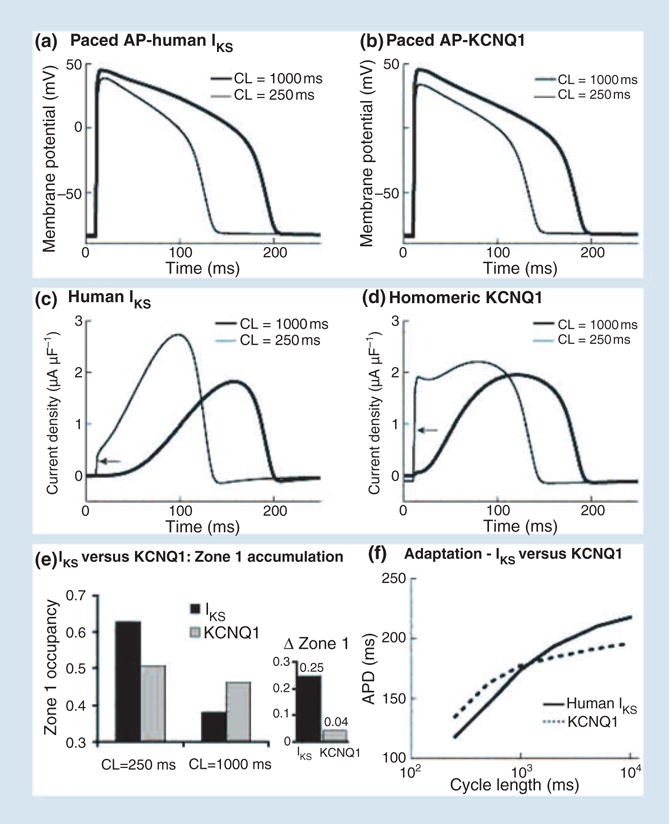
Comparison of action potential (AP) adaptation with human IKs and human KCNQ1. (a) AP with IKs at slow (thick line) and fast (thin line) rate. (b) AP with KCNQ1 at slow (thick line) and fast (thin line) rate. (c) IKs during the AP in panel a. (d) KCNQ1 current during the AP in panel b. Arrows point to instantaneous current due to open-state accumulation. (e) IKs (black) and KCNQ1 (grey) zone 1 occupancy at fast (CL = 250 ms) and slow (CL = 1000 ms) rate. Δ zone 1 is the difference in occupation of zone 1 between the fast and slow rate. (f) Rate adaptation of AP duration with IKs (solid) and KCNQ1 (dashed). Note reduced capacity for adaptation (flatter curve) with KCNQ1 compared with IKs. Reproduced with permission from Silva and Rudy [4].
IKs as ‘repolarization reserve’ when IKr is compromised
The case of pathologically reduced IKr, by mutation (congenital LQT2 [10]) or drugs (acquired LQT syndrome [31, 32]), is examined in Fig. 10. It has been hypothesized that IKs constitutes a ‘repolarization reserve’ (RR) that compensates for the reduction in IKr under such conditions [23]. Figure 10a shows mean IKs (black) compared with KCNQ1 current (grey) for the first and 40th APs during pacing at cycle length of 500 ms. IKs increases by approximately 50% from the first to the 40th beat, whilst KCNQ1 remains almost the same. When IKr is blocked, greater IKs increase is observed over 40 beats (compared with control, in the absence of IKr block) whilst only a limited increase is observed in KCNQ1. The superior ability of IKs to provide greater current when IKr is blocked is due to its build up of AR. IKr block prolongs the AP plateau and elevates its potential, thereby facilitating transitions of IKs channels into zone 1 of closed states that constitute the AR. In contrast, KCNQ1 accumulation is mostly in the open state, which is at the expense of closed states in zone 1 and therefore depletes the AR. Thus, most KCNQ1 channels open on every beat, allowing for very limited accumulation over many beats. In this sense, KCNQ1 is a ‘wasteful’ current.
Fig. 10.
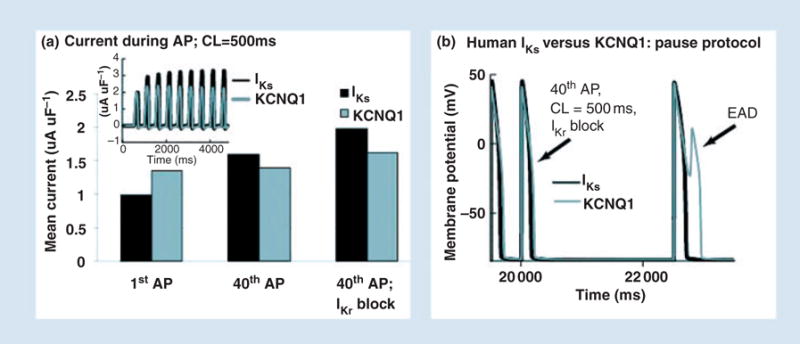
IKs as repolarization reserve. (a) Mean IKs during the AP (black) accumulates during pacing, showing significant increase over 40 paced APs. In contrast, KCNQ1 shows only a small increase. When IKr is blocked (right bars) IKs increases further, providing a compensating repolarizing current. (b) When IKr is blocked, a post-pause AP develops an early afterdepolarization (EAD) with KCNQ1 (grey) but not with IKs (black). Repreduced with permission from Silva and Rudy [4].
Many clinical arrhythmias that are associated with reduced IKr occur following a pause [33, 34]. We simulate a pause protocol in Fig. 10b. A pause is inserted after 40 beats in the presence of IKr block. The post-pause AP with KCNQ1 (grey) develops an EAD as a consequence of insufficient KCNQ1 current late during the AP. In contrast, the AP with IKs (black) repolarizes normally because of the ability of IKs to provide current late during the plateau, where it has a major effect on repolarization.
The following conclusions emerge from the IKs simulations: (i) IKs participates in rate-dependent repolarization by accumulating channels in closed states that are close to the open state. This creates an available reserve that is ready to open ‘on demand’. (ii) This capability is conferred by the interaction between the molecular subunits of the channel. (iii) Accumulation in the closed states (zone 1) is more effective in controlling AP repolarization than accumulation in the open state because it maximizes current late, rather than early, during the AP. (iv) As a result of this property, IKs can provide repolarization reserve and prevent arrhythmogenic EADs when IKr is compromised by disease or drugs.
Imaging repolarization and reentry
Repolarization abnormalities caused by mutations or drugs (as described in the previous sections) can lead to triggered activity, spatial dispersion of excitability and consequently to reentrant arrhythmias. It will be most helpful for both basic research and for clinical diagnosis and treatment to obtain information noninvasively on the electrophysiological state of the myocardium; in particular, in the context of this article, on the degree of dispersion of repolarization (as an index of vulnerability to arrhythmia) and on the properties of a reentry circuit during an arrhythmia. Over the last 20 years, a novel noninvasive imaging modality for cardiac electrophysiology and arrhythmia has been under development in our laboratory [35]. This method, called ECGI, was extensively validated and evaluated in animal experiments in normal and abnormal hearts [36–42], including hearts with repolarization abnormalities and large dispersion of repolarization induced by local epicardial cooling and warming [43].
Recently, we described the first application of ECGI in human subjects [5, 44]. In ECGI, a multielectrode vest records 224 body surface electrocardiograms and this information is combined with CT scan to reconstruct noninvasively electrical potentials, electrograms and isochrones (activation sequences) on the epicardial surface of the heart. The ECGI method is illustrated in Fig. 11 (see Ramanathan et al. [5] for details).
Fig. 11.
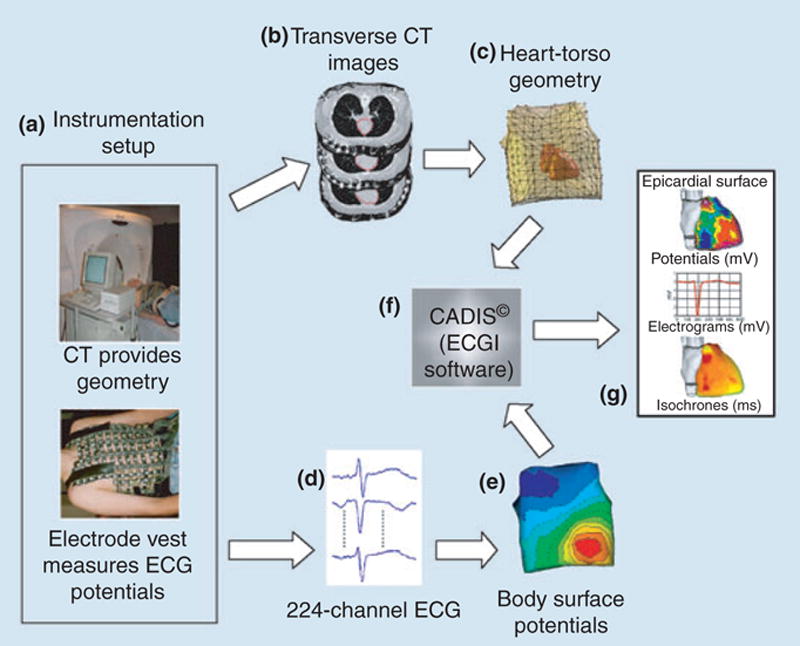
A block diagram of the ECGI procedure. (a) Multielectrode vest for obtaining ECGs and CT for obtaining geometry. (b) CT slices showing heart contour (red) and body surface electrodes (shiny dots). (c) Heart-torso geometry constructed from the CT slices. (d) Sample ECGs obtained with the multielectrode vest and mapping system. (e) Body surface potential map. (f) ECGI software, CADIS, for reconstruction of epicardial potentials. (g) Examples of noninvasive ECGI images: epicardial potentials, electrograms and isochrones. Reproduced from Ramanathan et al. [5].
Imaging repolarization
Figure 12 shows noninvasively imaged epicardial potential maps during repolarization (peak T-wave) in a normal subject (left panel) and noninvasively reconstructed epicardial electrograms (right panel) from locations 1 (right ventricle) and 2 (left ventricle) shown on the left. The epicardial potential pattern does not change much during the entire T wave (although potential magnitudes change substantially), reflecting the relatively slow process of repolarization and its large spatial extent (unlike the very dynamic depolarization process that involves wave propagation of local excitation). From the electrograms, one can determine the activation and recovery times at each position on the epicardial surface (600 electrograms all around the epicardium are reconstructed). For the electrograms shown, these times are marked by vertical lines. The difference between activation and recovery times is the local activation recovery interval (ARI), which reflects the local AP duration. For the locations shown, ARI (location 1) is 225 ms and ARI (location 2) is 265 ms. These values are consistent with AP durations measured in human myocytes; they indicate a repolarization gradient of 40 ms between right and left ventricular epicardium at the given locations.
Fig. 12.
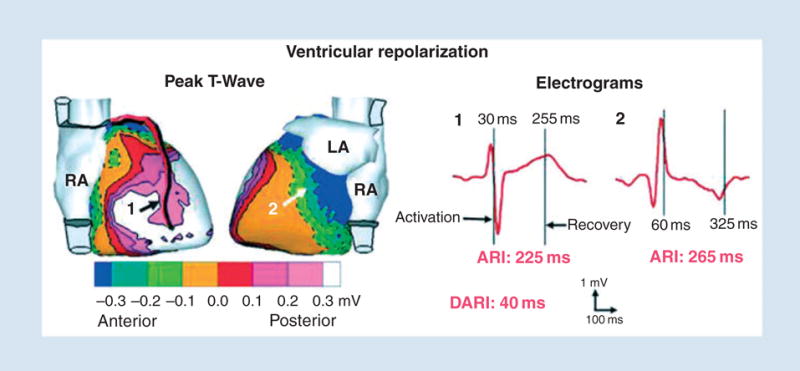
Noninvasive ECGI images of ventricular repolarization. Left: Epicardial potentials. Numbers indicate locations of electrograms shown on the right. Right: Examples of ECGI reconstructed electrograms on right ventricle (1) and left ventricle (2) epicardium. Vertical lines mark activation and recovery times. ECGI, electrocardiographic imaging; ARI, activation recovery interval; DARI, difference in ARI between locations 2 and 1. Reproduced from Ramanathan et al. [5].
Imaging reentry (atrial flutter)
Figure 13 demonstrates the ability of ECGI to image noninvasively a reentry circuit during an arrhythmia; in this case atrial flutter. The anterior view shows the right atrial reentry circuit that drives the flutter (black arrows). The wavefront propagates up the septum (dashed arrow) and emerges near the Bachman bundle (asterisk). It then propagates down the free wall and reenters the septum through the isthmus between the inferior vena cava (IVC) and tricuspid annulus (TA). This primary circuit generates many secondary excitation waves that spread in all directions. A major wavefront propagates around the IVC (white arrow in inferior IVC view) and ascends the lateral right atrium (white arrow in right lateral view) to collide at the crista terminalis region with a leftward front (grey arrows) that emerges from the reentry circuit (black arrow). Other wavefronts (grey arrows; posterior, anterior and right lateral views) that emanate from the reentry circuit propagate to the left atrium, with the left atrial appendage being last to activate. This reentry circuit and activation pattern, mapped noninvasively using ECGI, is consistent with results from direct mapping of typical atrial flutter using intracardiac catheters [45–47].
Fig. 13.
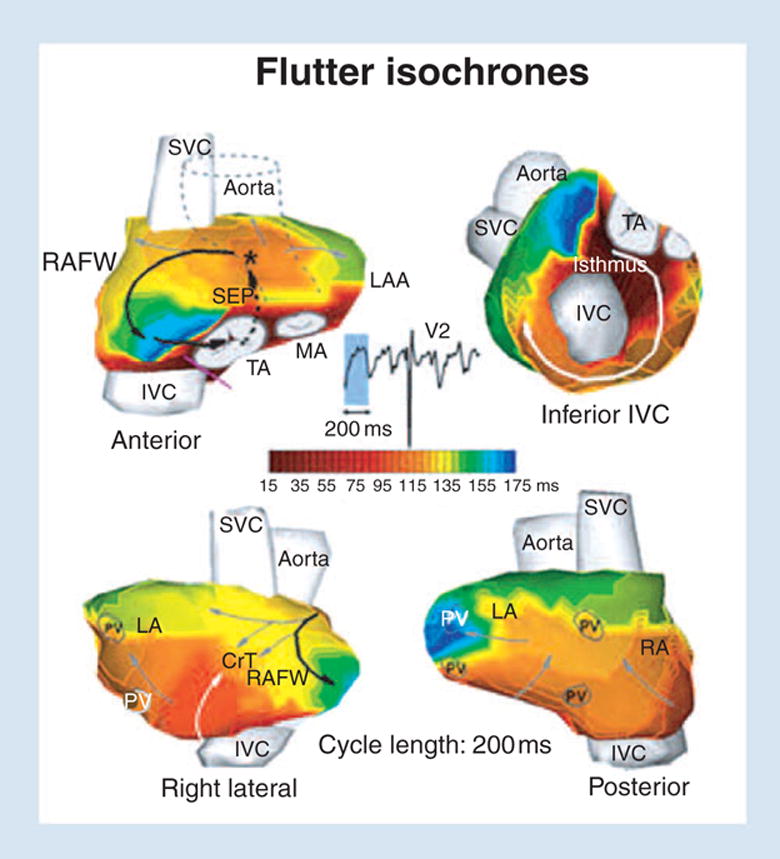
ECGI images of atrial flutter. Isochrone maps are shown. The right atrial reentry circuit that drives the flutter is indicated by black arrows. ECGI, electrocardiographic imaging; RAFW, right atrial free wall; LAA, left atrial appendage; SVC, superior vena cava; TA, tricuspid annulus; MA, mitral annulus; PV, pulmonary vein; SEP, septum; CrT, crista terminalis. Reproduced from Ramanathan et al. [5].
In conclusion, our studies so far demonstrate the ability of ECGI to image human cardiac electrophysiology noninvasively and, in particular, cardiac repolarization and reentrant arrhythmias. It is our hope that ECGI data from LQT patients will provide new insights into the mechanisms of LQT arrhythmias and sudden death. We also hope that ECGI will serve to identify patients at risk of fatal arrhythmias so that prophylactic measures can be taken.
Discussion
Ion channels interact with the dynamic ionic environment of the cell, with the membrane voltage, and with a variety of regulatory molecules to generate and modulate the cardiac AP. These interactions are complex and nonlinear, and their outcome usually defies intuition. Computational biology is a powerful approach that can provide a mechanistic link between ion channel function and the whole-cell behaviour. The examples of HERG mutations shown here demonstrate the complexity of interactions that result in the LQT syndrome. The results serve to demonstrate that the ‘gain of function/loss of function’ rule is not always sufficient to predict the effect of a mutation on the AP. In many cases, detailed consideration of the mutation-induced changes in channel kinetics is required and, in particular, an understanding of when during the AP the mutation exerts its effect. A similar principle emerges from the IKs simulations. Due to its kinetics, IKs can build an available reserve and generate current late during the AP, thus affecting repolarization very effectively. This property is conferred by the interaction between the molecular subunits of the channel, a finding that demonstrates the role of an accessory subunit as a modulator of channel function that is important for effective functioning during the AP. These kinetic properties explain how IKs can serve as ‘repolarization reserve’ when IKr is compromised. The simulations also show that IKs can build its own available reserve, expanding the concept of repolarization reserve between channels (e.g IKs as reserve for IKr) to the workings of a single channel. As shown in the last section, ECGI is capable of providing information on the electrophysiological state of the heart noninvasively. In the context of the ‘Key Symposium’, we hope that a combination of computational biology studies and imaging of LQT substrates and associated arrhythmias in humans will advance our understanding of mechanisms, our ability to identify individuals at risk, and our ability to make accurate diagnosis as a basis for effective intervention.
Conflict of interest statement
No conflict of interest was declared.
Acknowledgments
The work presented in this review was supported by grant R01-HL49054 and Merit Award R37-HL33343 (to Y.R.) from the National Institutes of Health – National Heart, Lung and Blood Institute, and by a Whitaker Foundation Development Award. Y. Rudy is the Fred Saigh Distinguished Professor at Washington University in St Louis. Special thanks to J.L. Godwin for her expert help in preparing the manuscript and figures.
References
- 1.Keating MT, Sanguinetti MC. Molecular genetic insights into cardiovascular disease. Science. 1996;272:681–5. doi: 10.1126/science.272.5262.681. [DOI] [PubMed] [Google Scholar]
- 2.Clancy CE, Rudy Y. Linking a genetic defect to its cellular phenotype in a cardiac arrhythmia. Nature. 1999;400:566–9. doi: 10.1038/23034. [DOI] [PubMed] [Google Scholar]
- 3.Clancy CE, Rudy Y. Cellular consequences of HERG mutations in the long QT syndrome: precursors to sudden cardiac death. Cardiovasc Res. 2001;50:301–13. doi: 10.1016/s0008-6363(00)00293-5. [DOI] [PubMed] [Google Scholar]
- 4.Silva J, Rudy Y. Subunit interaction determines IKs participation in cardiac repolarization and repolarization reserve. Circulation. 2005;112:1384–91. doi: 10.1161/CIRCULATIONAHA.105.543306. [DOI] [PMC free article] [PubMed] [Google Scholar]
- 5.Ramanathan C, Ghanem RN, Jia P, Ryu K, Rudy Y. Electrocardiographic imaging (ECGI): a noninvasive imaging modality for cardiac electrophysiology and arrhythmia. Nature Med. 2004;10:422–8. doi: 10.1038/nm1011. [DOI] [PMC free article] [PubMed] [Google Scholar]
- 6.Luo C, Rudy Y. A dynamic model of the cardiac ventricular action potential: I. Simulations of ionic currents and concentration changes. Circ Res. 1994;74:1071–96. doi: 10.1161/01.res.74.6.1071. [DOI] [PubMed] [Google Scholar]
- 7.Faber GM, Rudy Y. Action potential and contractility changes in [Na+]i overloaded cardiac myocytes: a simulation study. Biophys J. 2000;78:2392–404. doi: 10.1016/S0006-3495(00)76783-X. [DOI] [PMC free article] [PubMed] [Google Scholar]
- 8.Rudy Y. The cardiac ventricular action potential. In: Page E, Fozzard HA, Solaro RJ, editors. Handbook of Physiology: the Heart. Oxford: Oxford University Press; 2001. pp. 531–47. [Google Scholar]
- 9.Clancy CE, Rudy Y. A Na+ channel mutation that causes both Brugada and long QT syndrome phenotypes: a simulation study of mechanism. Circulation. 2002;105:1208–13. doi: 10.1161/hc1002.105183. [DOI] [PMC free article] [PubMed] [Google Scholar]
- 10.Roden DM, Balser JR. A plethora of mechanisms in the HERG-related long-QT syndrome: genetics meets electrophysiology. Cardiovasc Res. 1999;44:242–6. doi: 10.1016/s0008-6363(99)00224-2. [DOI] [PubMed] [Google Scholar]
- 11.Zhou Z, Gong Q, Epstein ML, January CT. HERG channel dysfunction in human long QT syndrome. Intracellular transport and functional defects. J Biol Chem. 1998;273:21061–6. doi: 10.1074/jbc.273.33.21061. [DOI] [PubMed] [Google Scholar]
- 12.Hund TJ, Rudy Y. Rate dependence and regulation of action potential and calcium transient in a canine cardiac ventricular cell model. Circulation. 2004;110:3168–74. doi: 10.1161/01.CIR.0000147231.69595.D3. [DOI] [PMC free article] [PubMed] [Google Scholar]
- 13.Zhou Z, Gong Q, Epstein ML, January CT. HERG channel dysfunction in human long QT syndrome. Intracellular transport and functional defects. J Biol Chem. 1998;273:21061–6. doi: 10.1074/jbc.273.33.21061. [DOI] [PubMed] [Google Scholar]
- 14.Nakajima T, Furukawa T, Tanaka T, et al. Novel mechanism of HERG current suppression in LQT2: shift in voltage dependence of HERG inactivation. Circ Res. 1998;83:415–22. doi: 10.1161/01.res.83.4.415. [DOI] [PubMed] [Google Scholar]
- 15.Chen J, Zou A, Splawski I, Keating MT, Sanguinetti MC. Long QT syndrome-associated mutations in the Per-Arnt-Sim (PAS) domain of HERG potassium channels accelerate channel deactivation. J Biol Chem. 1999;274:10113–8. doi: 10.1074/jbc.274.15.10113. [DOI] [PubMed] [Google Scholar]
- 16.Lees-Miller JP, Duan Y, Teng GQ, Thorstad K, Duff HJ. Novel gain of function mechanism in K+ channel related long-QT syndrome: altered gating and selectivity in the HERG1 N629D mutant. Circ Res. 2000;86:507–13. doi: 10.1161/01.res.86.5.507. [DOI] [PubMed] [Google Scholar]
- 17.Liu DW, Gintant GA, Antzelevitch C. Ionic bases for electrophysiological distinctions among epicardial, midmyocardial, and endocardial myocytes from the free wall of the canine left ventricle. Circ Res. 1993;72:671–87. doi: 10.1161/01.res.72.3.671. [DOI] [PubMed] [Google Scholar]
- 18.Zeng J, Rudy Y. Early afterdepolarizations in cardiac myocytes: mechanism and rate dependence. Biophys J. 1995;68:949–64. doi: 10.1016/S0006-3495(95)80271-7. [DOI] [PMC free article] [PubMed] [Google Scholar]
- 19.Bennett PB, Yazawa K, Makita N, et al. Molecular mechanism for an inherited cardiac arrhythmia. Nature. 1995;376:683–5. doi: 10.1038/376683a0. [DOI] [PubMed] [Google Scholar]
- 20.Duggal P, Vesely MR, Wattanasirichaigoon D, Villafane J, Kaushik V, Beggs AH. Mutation of the gene for IsK associated with both Jervell and Lange-Nielsen and Romano-Ward forms of long-QT syndrome. Circulation. 1998;97:142–6. doi: 10.1161/01.cir.97.2.142. [DOI] [PubMed] [Google Scholar]
- 21.Splawski I, Tristani-Firouzi M, Lehmann MH, Sanguinetti MC, Keating MT. Mutations in the hminK gene cause long QT syndrome and suppress IKs function. Nat Genet. 1997;17:338–40. doi: 10.1038/ng1197-338. [DOI] [PubMed] [Google Scholar]
- 22.Marx SO, Kurokawa J, Reiken S, et al. Requirement of a macromolecular signaling complex for beta adrenergic receptor modulation of the KCNQ1-KCNE1 potassium channel. Science. 2002;295:496–9. doi: 10.1126/science.1066843. [DOI] [PubMed] [Google Scholar]
- 23.Roden DM. Review in this issue of J Intern Med [Google Scholar]
- 24.Lu Z, Kamiya K, Opthof T, Yasui K, Kodama I. Density and kinetics of I(Kr) and I(Ks) in guinea pig and rabbit ventricular myocytes explain different efficacy of I(Ks) blockade at high heart rate in guinea pig and rabbit: implications for arrhythmogenesis in humans. Circulation. 2001;104:951–6. doi: 10.1161/hc3401.093151. [DOI] [PubMed] [Google Scholar]
- 25.Zagotta WN, Hoshi T, Aldrich RW. Shaker potassium channel gating. III: evaluation of kinetic models for activation. J Gen Physiol. 1994;103:321–62. doi: 10.1085/jgp.103.2.321. [DOI] [PMC free article] [PubMed] [Google Scholar]
- 26.Silverman WR, Roux B, Papazian DM. Structural basis of two-stage voltage-dependent activation in K+ channels. PNAS. 2003;100:2935–40. doi: 10.1073/pnas.0636603100. [DOI] [PMC free article] [PubMed] [Google Scholar]
- 27.Tristani-Firouzi M, Sanguinetti MC. Voltage-dependent inactivation of the human K+ channel KvLQT1 is eliminated by association with minimal K+ channel (mink) subunits. J Physiol. 1998;510 :37–45. doi: 10.1111/j.1469-7793.1998.037bz.x. Pt 1. [DOI] [PMC free article] [PubMed] [Google Scholar]
- 28.Cui J, Kline RP, Pennefather P, Cohen IS. Gating of IsK expressed in Xenopus oocytes depends on the amount of mRNA injected. J Gen Physiol. 1994;104:87–105. doi: 10.1085/jgp.104.1.87. [DOI] [PMC free article] [PubMed] [Google Scholar]
- 29.Koren G, Liman ER, Logothetis DE, Nadal-Ginard B, Hess P. Gating mechanism of a cloned potassium channel expressed in frog oocytes and mammalian cells. Neuron. 1990;4:39–51. doi: 10.1016/0896-6273(90)90442-i. [DOI] [PubMed] [Google Scholar]
- 30.Rocchetti M, Besana A, Gurrola GB, Possani LD, Zaza A. Rate dependency of delayed rectifier currents during the guinea-pig ventricular action potential. J Physiol. 2001;534:721–32. doi: 10.1111/j.1469-7793.2001.00721.x. [DOI] [PMC free article] [PubMed] [Google Scholar]
- 31.Roden DM. Drug-induced prolongation of the QT interval. N Engl J Med. 2004;350:1013–22. doi: 10.1056/NEJMra032426. [DOI] [PubMed] [Google Scholar]
- 32.Volders PG, Stengl M, van Opstal JM, et al. Probing the contribution of IKs to canine ventricular repolarization: key role for beta-adrenergic receptor stimulation. Circ. 2003;107:2753–60. doi: 10.1161/01.CIR.0000068344.54010.B3. [DOI] [PubMed] [Google Scholar]
- 33.Kay NG, Plumb VJ, Arciniegas JG, Henthorn RW, Waldo AL. Torsade de pointes: the long-short initiating sequence and other clinical features: observations in 32 patients. J Am Coll Cardiol. 1983;2:806–17. doi: 10.1016/s0735-1097(83)80226-5. [DOI] [PubMed] [Google Scholar]
- 34.Viswanathan PC, Rudy Y. Pause induced early afterdepolarizations in the long QT syndrome: a simulation study. Cardiovasc Res. 42. 199:530–42. doi: 10.1016/s0008-6363(99)00035-8. [DOI] [PubMed] [Google Scholar]
- 35.Rudy Y, Burnes JE. Noninvasive electrocardiographic imaging (ECGI) Annals of Noninvasive Electrocardiology. 1999;4:340–359. [Google Scholar]
- 36.Oster HS, Taccardi B, Lux RL, Ershler PR, Rudy Y. Noninvasive electrocardiographic imaging: reconstruction of epicardial potentials, electrograms and isochrones, and localization of single and multiple electrocardiac events. Circulation. 1997;96:1012–24. doi: 10.1161/01.cir.96.3.1012. [DOI] [PubMed] [Google Scholar]
- 37.Oster HS, Taccardi B, Lux RL, Ershler PR, Rudy Y. Electrocardiographic imaging: noninvasive characterization of intramural myocardial activation from inverse reconstructed epicardial potentials and electrograms. Circulation. 1998;97:1496–507. doi: 10.1161/01.cir.97.15.1496. [DOI] [PubMed] [Google Scholar]
- 38.Burnes JE, Taccardi B, MacLeod RS, Rudy Y. Noninvasive electrocardiographic imaging of electrophysiologically abnormal substrate in infracted hearts: a model study. Circulation. 2000;101:533–40. doi: 10.1161/01.cir.101.5.533. [DOI] [PubMed] [Google Scholar]
- 39.Burnes JE, Taccardi B, Rudy Y. A noninvasive imaging modality for cardiac arrhythmias. Circulation. 2000;102:2152–8. doi: 10.1161/01.cir.102.17.2152. [DOI] [PMC free article] [PubMed] [Google Scholar]
- 40.Ramanathan C, Rudy Y. Electrocardiographic imaging: II. Effect of torso inhomogeneities on the noninvasive reconstruction of epicardial potentials, electrograms and isochrones. J Cardiovasc Electrophysiol. 2001;12:241–52. doi: 10.1046/j.1540-8167.2001.00241.x. [DOI] [PubMed] [Google Scholar]
- 41.Burnes JE, Taccardi B, Ershler P, Rudy Y. Noninvasive ECG imaging of substrate and intramural ventricular tachycardia in infracted hearts. J Am Coll Cardiol. 2001;38:2071–8. doi: 10.1016/s0735-1097(01)01653-9. 42. [DOI] [PMC free article] [PubMed] [Google Scholar]
- Ramanathan C, Jia P, Ghanem RN, Calvetti D, Rudy Y. Noninvasive electrocardiographic imaging (ECGI): application of the generalized minimal residual (GMRes) method. Ann Biomed Eng. 2003;31:981–94. doi: 10.1114/1.1588655. [DOI] [PMC free article] [PubMed] [Google Scholar]
- 43.Ghanem RN, Burnes JE, Waldo AL, Rudy Y. Imaging dispersion of myocardial repolarization II. Noninvasive reconstruction of epicardial measures. Circulation. 2001;104:1306–12. doi: 10.1161/hc3601.094277. [DOI] [PubMed] [Google Scholar]
- 44.Ghanem RN, Jia P, Ramanathan C, Ryu K, Markowitz A, Rudy Y. Noninvasive electrocardiographic imaging (ECGI): comparison to intraoperative mapping in patients. Heart Rhythm J. 2005;2:339–54. doi: 10.1016/j.hrthm.2004.12.022. [DOI] [PMC free article] [PubMed] [Google Scholar]
- 45.Yamabe H, Misumi I, Fukushima H, Ueno K, Kimura Y, Hokamura Y. Conduction properties of the crista terminalis and its influence on the right atrial activation sequence in patients with typical atrial flutter. Pacing Clin Electrophysiol. 2002;25:132–41. doi: 10.1046/j.1460-9592.2002.00132.x. [DOI] [PubMed] [Google Scholar]
- 46.Daoud EG, Morady F. Pathophysiology of atrial flutter. Ann Rev Med. 1998;49:77–83. doi: 10.1146/annurev.med.49.1.77. [DOI] [PubMed] [Google Scholar]
- 47.Rodriguez L-M, Timmermans C, Nabar A, Hofstra L, Wellens HJJ. Biatrial activation in isthmus-dependent atrial flutter. Circulation. 2001;104:2545–50. doi: 10.1161/hc4601.097996. [DOI] [PubMed] [Google Scholar]


