

Traditional, dideoxy-based (Sanger) sequencing of DNA is remarkably reliable and robust. However, the quest for more rapid, economical ways to sequence genomes has driven interest in alternative approaches (1, 2). Methods capable of sequencing single DNA molecules represent the logical endpoint of miniaturization, leading to the maximum extraction of information from a minimum of material.
Most approaches to single-molecule sequencing have concentrated either on the detection of fluorescent nucleotides incorporated during DNA polymerization or on the conductance changes produced as DNA molecules traverse membranes through nanopores. For the present, both these approaches are beset by limitations. By using fluorescence signals collected from individual molecules, one group reported sequencing up to five noncontiguous bases on specially designed templates (2), and nanopore techniques have distinguished base differences only in the context of engineered hairpins (3) or identified DNA polymers composed of long stretches of a single nucleotide species (4).
Here, we report a method for sequencing that relies upon resolving the motion of a processive nucleic acid enzyme. We used a newly developed assay for tracking transcription by single molecules of Escherichia coli RNA polymerase (RNAP) in which a pair of optical traps levitates two polystyrene beads: one attached to the RNAP enzyme and the other to the distal end of a DNA template. Transcriptional motion of RNAP along the template changes the length of the DNA tether joining the two beads, leading to displacements that can be registered with angstrom-level precision, affording single–base pair resolution (5). When the transcriptional assay is carried out in a buffer where one of the four nucleoside tri-phosphates (NTPs) is present at a very low concentration, RNAP will be induced to pause at every DNA position that requires the addition of the limiting nucleotide.
To sequence DNA, we repeated the single-molecule assay four times (on four copies of the target DNA sequence) with each NTP species held rate-limiting in turn, and we inferred the template sequence directly from the ordered sequence of pauses in the set of four transcription records. The success of this enterprise relies on being able to align all four records to within one base pair. To establish subnanometer alignment, we used known sequence information found in the DNA regions flanking the unknown segment to be sequenced, which produces an expected pause pattern. This pattern was used to place the four records in register by a maximum correlation method (6, 7). The flanking sequences used for alignment provide a common starting point and play an analogous role to the oligo-nucleotide primers used in Sanger sequencing.
Four aligned records are shown (Fig. 1A). DNA positions from these records were histogrammed, smoothed, and normalized (Fig. 1B). Bases were assigned to every 3.4 Å window [corresponding to the distance spanned by 1 base pair (bp)] by following a simple heuristic. First, if a single histogram peak was detected within one of the windows, it was assigned to the corresponding base. Next, for windows with multiple peaks, the tallest peaks were associated with the nearest unassigned windows. Last, any remaining windows were assigned to the base with the highest histogram value found at the center of the window. With this scheme, we correctly identified 30 out of 32 bases in a target region on the basis of less than 3 min of net observation time for exactly four molecules (Fig. 1). Greatly improved accuracy can be obtained by combining statistics from multiple single-molecule records and by using more a sophisticated base-calling algorithm, e.g., one based on peak deconvolution.
Fig. 1.
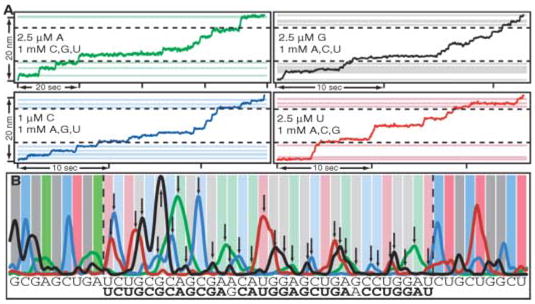
Motion-based DNA sequencing. (A) Aligned records of transcriptional position versus time for a single molecule of RNAP under the four different limiting nucleotide conditions (ATP, green; CTP, blue; GTP, black; and UTP, red). Positions of expected pauses used for record alignment (solid horizontal lines) flank the region to be sequenced (dotted horizontal lines). (B) Position histograms for the data in (A), normalized and smoothed. Flanking positions used for alignment (dark vertical bars) and unknown bases to be called (light vertical bars) are shown; base calls are indicated (arrows). The true sequence of the template is shown above the inferred sequence, with 30 of 32 correct bases (boldface type).
Read lengths of DNA sequences determined by this approach are ultimately limited, in principle, by the processivity of RNAP, which is thousands of base pairs. In practice, it has proved possible to follow RNAP at the single-molecule level with near–base pair accuracy over templates in excess of 2000 bp (6). Another factor potentially influencing read length may be transcriptional pausing. About 95% of pauses are brief (~1 to 5 s) and sequence-specific and occur about once every 100 bases (6): These are not likely to pose problems. However, ~5% of pauses exceed 20 s and occur at random positions, about once per 1000 bases: These are associated with mis-incorporation errors. Because such errors are unrelated to any particular sequence, records from multiple molecules may be combined to disambiguate these events from pauses induced by limiting NTPs. DNA reading speeds will ultimately be set by RNA synthesis rates at limiting NTPs (several bases/s). However, the degree to which motion-resolved sequencing can be parallelized and/or miniaturized to obtain signals from many molecules remains to be established. This proof of principle demonstrates that the movement of a processive nucleic acid enzyme may be used to extract sequence information directly from DNA and opens the door to further refinements and extensions of the technique.
Footnotes
Supporting Online Material
References and Notes
- 1.Shendure J, Mitra RD, Varma C, Church GM. Nat Rev Genet. 2004;5:335. doi: 10.1038/nrg1325. [DOI] [PubMed] [Google Scholar]
- 2.Braslavsky I, Hebert B, Kartalov E, Quake SR. Proc Natl Acad Sci USA. 2003;100:3960. doi: 10.1073/pnas.0230489100. [DOI] [PMC free article] [PubMed] [Google Scholar]
- 3.Vercoutere W, et al. Nat Biotechnol. 2001;19:248. doi: 10.1038/85696. [DOI] [PubMed] [Google Scholar]
- 4.Meller A, Nivon L, Brandin E, Golovchenko J, Branton D. Proc Natl Acad Sci USA. 2000;97:1079. doi: 10.1073/pnas.97.3.1079. [DOI] [PMC free article] [PubMed] [Google Scholar]
- 5.Abbondanzieri EA, Greenleaf WJ, Shaevitz JW, Landick R, Block SM. Nature. 2005;438:460. doi: 10.1038/nature04268. [DOI] [PMC free article] [PubMed] [Google Scholar]
- 6.Herbert KM, et al. Cell. 2006;125:1083. doi: 10.1016/j.cell.2006.04.032. [DOI] [PMC free article] [PubMed] [Google Scholar]
- 7.Materials and methods are available as supporting material on Science Online.
- 8.S.M.B. acknowledges NIH grant GM057035 for support.