

Abstract
Background
To survive starvation and other forms of stress, eukaryotic cells undergo a lysosomal process of cytoplasmic degradation known as autophagy. Autophagy has been implicated in a number of cellular and developmental processes, including cell growth control and programmed cell death. However, direct evidence of a causal role for autophagy in these processes is lacking, due in part to the pleiotropic effects of signaling molecules such as TOR that regulate autophagy. Here, we circumvent this difficulty by directly manipulating autophagy rates in Drosophila through the autophagy-specific protein kinase Atg1.
Results
We find that overexpression of Atg1 is sufficient to induce high levels of autophagy, the first such demonstration among wild type Atg proteins. In contrast to findings in yeast, induction of autophagy by Atg1 is dependent on its kinase activity. We find that cells with high levels of Atg1-induced autophagy are rapidly eliminated, demonstrating that autophagy is capable of inducing cell death. However, this cell death is caspase dependent and displays DNA fragmentation, suggesting that autophagy represents an alternative induction of apoptosis, rather than a distinct form of cell death. In addition, we demonstrate that Atg1-induced autophagy strongly inhibits cell growth, and that Atg1 mutant cells have a relative growth advantage under conditions of reduced TOR signaling. Finally, we show that Atg1 expression results in negative feedback on the activity of TOR itself.
Conclusions
Our results reveal a central role for Atg1 in mounting a coordinated autophagic response, and demonstrate that autophagy has the capacity to induce cell death. Furthermore, this work identifies autophagy as a critical mechanism by which inhibition of TOR signaling leads to reduced cell growth.
Keywords: autophagy, cell growth, programmed cell death, Target of Rapamycin (TOR), Drosophila
Introduction
Under starvation conditions, eukaryotic cells recover nutrients via autophagy, a lysosome-mediated process of bulk cytoplasmic degradation. Through autophagy, long-lived proteins, organelles, and other components of the cytoplasm are non-selectively engulfed within specialized double-membraned vesicles known as autophagosomes. Subsequent fusion of the outer autophagosomal membrane with the lysosome results in a structure known as the autolysosome, in which the inner membrane and its cytoplasmic cargo are degraded. Breakdown products released from the autolysosome supply the cell with an internal source of nutrients that can support essential metabolic processes during starvation [1]. Approximately 20 ATG (autophagy-related) genes specifically required for autophagy have been discovered in Saccharomyces cerevisiae [2-4], and many of these genes have functional homologs in metazoans [1, 5].
In addition to survival of starvation, autophagy has been implicated in many aspects of health and development, including aging, programmed cell death, pathogenic infection, stress responses, neurodegenerative and muscle disorders, cellular remodeling, cancer, and cell growth [1, 6]. As in many of these processes, evidence for a role of autophagy in cell growth control is largely correlative. Autophagy is promoted by several tumor suppressor genes including PTEN, TSC1 & 2, and beclin 1, and is inhibited by growth-promoting pathways such as type I PI3K and target of rapamycin (TOR) signaling [5, 7-10]. A variety of conditions that stimulate cell growth, such as growth factor addition, partial hepatectomy, and refeeding after starvation, also inhibit autophagy, while growth suppressive signals, such as contact inhibition and substrate detachment, induce autophagy [11]. Together, these correlative findings are consistent with a model in which the catabolic effects of autophagy act as a brake on cell growth during development. However, this issue is complicated by the pleiotropic nature of the signaling pathways that regulate autophagy. For example, in addition to inhibiting autophagy, the TOR pathway controls cell metabolism and biosynthesis by promoting ribosome biogenesis, protein synthesis and nutrient uptake [12]. The relevant contribution of each of these downstream effector pathways to net cell growth is poorly understood.
Autophagy is also known to be involved in programmed cell death, and distinguishes Type II (autophagic) from Type I (apoptotic) cell death. Autophagic cell death is characterized by an abundance of autophagosomes and autolysosomes in the dying cell and differs from apoptotic cell death in that dying cells are degraded by their own lysosomal enzymes, rather than by phagocytosis [13]. It has been difficult, however, to establish whether autophagy plays a causal role in Type II cell death or represents a failed attempt at cell survival in cells undergoing programmed cell death. Death signals often induce features of both apoptosis and autophagy, and mutations that disrupt autophagy have been shown to suppress cell death in some cases [14-16], and hasten it in others [2, 17]. Thus, as in the case for cell growth, much of the support for a direct role for autophagy in cell death rests on correlative evidence.
One approach to addressing the potential role of autophagy in functions such as cell death and growth would be to induce autophagy directly, independent of the signaling pathways that normally control it. In yeast, multiple signaling pathways, including TOR, AMPK and Ras/PKA, converge on the Ser-Thr kinase Atg1 to regulate autophagy [18-20]. In addition, Atg1 interacts with multiple components of the autophagic machinery, through direct association, phosphorylation, and/or through effects on intracellular localization [18, 21, 22]. Thus, Atg1 may represent a nodal point for controlling multiple steps in the autophagic process in response to various inductive cues.
Interestingly, the role of Atg1 kinase activity in yeast is the subject of some debate, and studies from different groups using ATP analog-sensitive and kinase-defective Atg1 mutants have reached conflicting conclusions. One study reported that Atg1 kinase activity is required for the autophagy-related biosynthetic cytoplasm to vacuole targeting (CVT) pathway but not for autophagy, and concluded that Atg1 plays a structural role in autophagy [23]. However, other studies using similar reagents found a requirement for Atg1 kinase activity in both CVT and autophagy [18, 24].
We have previously shown that the Drosophila melanogaster homolog of Atg1 is required for autophagy in the larval fat body, an organ analogous to the vertebrate liver with roles in nutrient storage and mobilization [5]. Here, we investigate the effects of Drosophila Atg1 loss of function and overexpression on autophagy induction, cell growth control, and cell death. Our findings indicate that Atg1 expression is sufficient to effect a full autophagic response, resulting in a marked inhibition of cell growth and a rapid induction of apoptotic cell death.
Results
Overexpression of Atg1 induces autophagy
Null mutation of Atg1 results in a severe block of starvation-induced autophagy, and leads to fully penetrant lethality by the late pupal stage [5]. To test the effects of Atg1 overexpression, we generated multiple transgenic lines expressing wild type Atg1 under GAL4/UAS control. We also used an independently generated line (GS10797), in which UAS regulatory sequences have been inserted upstream of the endogenous Atg1 gene. In control experiments, weak expression of UAS-Atg1 was sufficient to partially rescue Atg1 null mutants to adult viability (34% of expected progeny; Supplemental Figure S1A), and partially rescued the autophagy defect of these mutants, as measured by Lysotracker Red staining, an effective marker of autolysosomes in fat body tissue [5, 25]. Similar to wild type larvae, Atg1 mutants rescued by UAS-Atg1 showed no Lysotracker staining when fed normally (Supplemental Figure S1B & G), but regained some capability to induce autophagy under starvation conditions (Supplemental Figure S1C & G).
To address whether Atg1 overexpression is sufficient to induce autophagy in fed animals, we expressed high levels of transgenic Atg1 using the heat shock-inducible Hsp70-GAL4 driver. Ultrastructural analysis showed that heat shock alone does not increase the abundance of autophagic structures in fat body cells of normally fed larvae (Figure 1A). In contrast, heat shock-induced overexpression of Atg1 resulted in the formation of autophagosomes and autolysosomes throughout fat body cells of fed animals (Figure 1B). These autophagic structures were indistinguishable from those generated by starvation [5], with readily identifiable cytoplasmic components in various stages of degradation. Robust induction of autophagy in response to heat shock-induced Atg1 overexpression was also evident using Lysotracker staining in live fat body tissue from fed larvae (compare Figure 1C & 1D; Figure 1I). Punctate Lysotracker staining was also observed in response to constitutive expression of Atg1 throughout the fat body (see Figure 5C), in fat body cell clones (Supplemental Figure S1E), and in eye and wing imaginal disc cells (data not shown). In addition, we occasionally observed localization of autolysosomes to the perinuclear region by TEM and Lysotracker staining (Supplemental Figures S1E & S3G and data not shown). This is consistent with recent observations that mammalian Atg9, a potential marker of the membrane source of autophagosomes, is recruited from the perinuclear trans-Golgi network in response to starvation in an Atg1-dependent manner [26]. Accumulation of Atg1-induced autolysosomes in the perinuclear region may therefore represent an early site of autolysosome formation.
Figure 1.
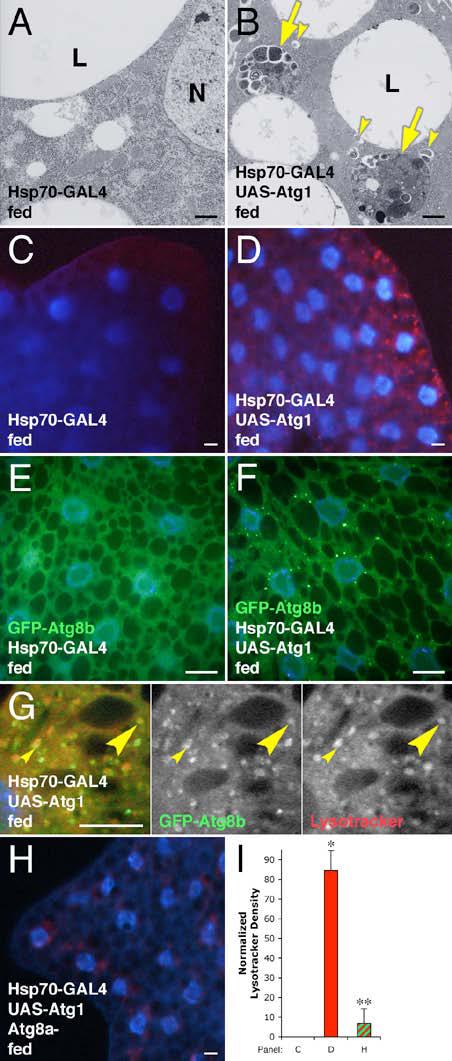
Overexpression of Atg1 induces autophagy.
(A-G) Induction of autophagy by heat shock-induced overexpression of Atg1. TEM showing no induction of autophagy in the fat body of normally fed animals by heat shock alone (A), whereas heat shock-induced overexpression of Atg1 (B) results in the accumulation of autolysosomes (arrows) and autophagosomes (arrowheads). Heat shock alone shows no Lysotracker staining (C), while heat shock-induced Atg1 overexpression results in punctate Lysotracker staining (red) (D). Induction of Atg1 overexpression leads to a redistribution of GFP-Atg8b (green) from uniform staining (E) to a punctate pattern (F). Many GFP-Atg8 positive punctae are found either adjacent to (small arrowheads) or overlapping with (large arrowheads) Lysotracker labeled structures (G). N indicates the nucleus in (A); L indicates a lipid droplet in (A & B).
(H) Mutation of Atg8a disrupts Atg1-induced Lysotracker staining.
(I) Quantitation of Lysotracker staining. * indicates a significant difference from wild type: p < 0.0001; ** indicates a significant difference from Atg1 overexpression alone: p = 0.0001. Error bars indicate standard deviation (SD).
Scale bars represent 1 μm in (A-B) and 10 μm in (C-H). Nuclei are marked in blue in panels (C-H). Genotypes: (A, C) Hsp70-GAL4/+. (B, D) Hsp70-GAL4/UAS-Atg19. (E) Hsp70-GFP-Atg8b6B/Hsp70-GFP-Atg8b6B; Hsp70-GAL4/TM6B. (F-G) Hsp70-GFP-Atg8b6B/Hsp70-GFP-Atg8b6B; Hsp70-GAL4/UASAtg16B. (H) Atg8aKG07569/Y; Hsp70-GAL4/UAS-Atg16B. (I) As in panels C, D, & H.
Figure 5.
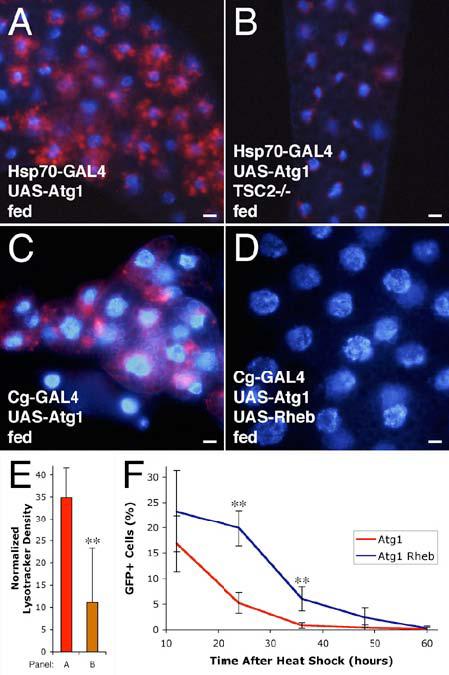
Regulation of Atg1 by TOR signaling.
(A-D) Atg1-induced autophagy is suppressed by activation of the TOR pathway. Heat shock-induced overexpression of Atg1 (A) induces autophagy as shown by Lysotracker staining (red), but mutation of TSC2 inhibits this induction (B). Overexpression of Rheb rescues Atg1 overexpression phenotypes. Overexpression of Atg1 throughout the fat body (C) results in variable reduction in cell size and induction of autophagy. Simultaneous overexpression of Rheb (D) rescues these effects.
(E) Quantitation of Lysotracker staining. ** indicates a significant difference from Atg1 overexpression alone: p = 0.0051.
(F) Co-expression of Rheb delays elimination of Atg1 overexpressing cells. Mean numbers of GFP-positive cells are expressed as a percentage of total cells. ** indicates a significant difference from Atg1 overexpression alone: p < 0.002.
Scale bars represent 10 μm. Nuclei are marked in blue. Error bars indicate SD.
Genotypes: (A) Hsp70-GAL4/UAS-Atg16B. (B) Hsp70-GAL4 gig192/UAS-Atg16B gig109. (C) Cg-GAL4/+; UAS-Atg1GS10797/+. (D) Cg-GAL4/+; UAS-Atg1GS10797/UAS-RhebEP50.084-loxP. (E) As in panels A & B. (F) Atg1: hsflp/+; Act>CD2>GAL4/UAS-Atg16B. Atg1 Rheb: hsflp/+; Act>CD2>GAL4/UAS-Atg16B UAS-RhebAV4.
To determine whether autophagy induced by Atg1 overexpression utilizes the same molecular components as starvation-induced autophagy, we first examined the localization of GFP-Atg8a and GFP-Atg8b, specific markers of the autophagosomal membrane [5, 27, 28]. As previously described, GFP-Atg8b was distributed uniformly in control fat body cells from fed animals (Figure 1E). In contrast, heat shock-induced overexpression of Atg1 resulted in redistribution of GFP-Atg8b to a punctate pattern (Figure 1F), similar to the effects of starvation [5]. In costaining experiments, GFP-Atg8 labeled punctae were often observed adjacent to or overlapping with Lysotracker positive spots (Figure 1G), as previously observed in starved wild type animals [5]. Expression of Atg1 in the developing retinal cells behind the morphogenetic furrow of the eye imaginal disc with GMR-GAL4 also resulted in punctate localization of GFP-Atg8a in normally fed animals, as compared to control cells ahead of the furrow (Supplemental Figure S2C). Interestingly, Atg1 overexpression also led to a marked increase in abundance of GFP-Atg8a and GFP-Atg8b in both eye and wing imaginal discs. In these experiments, Atg1 was overexpressed in the posterior region of eye or wing discs with GMR-GAL4 or en-GAL4, respectively, causing increased levels of hsp70-driven GFP-Atg8 relative to the anterior regions of these discs (compare Supplemental Figure S2A & S2B, and data not shown). An increase in GFP-Atg8b levels was also observed in Atg1-overexpressing eye and wing discs by immunoblot analysis (Supplemental Figure S2E and data not shown). As GFP-Atg8 expression is regulated by heterologous promoter and UTR sequences in these lines [5], and Atg1 overexpression did not affect the abundance of GFP alone nor of a control GFP fusion (data not shown), we conclude that Atg1 has a post-translational effect on GFP-Atg8 levels, perhaps through stabilization of GFP-Atg8 protein. Thus, Atg8 levels are increased under autophagy-inducing conditions, both transcriptionally [27, 29, 30] and post-transcriptionally.
To further explore the requirement for known components of the autophagic machinery, we tested whether mutations in other Atg genes affect the ability of Atg1 overexpression to induce autophagy. We identified a P element insertion in the coding region of Atg8a, and generated a deletion in the Atg3 locus, previously shown to be required for autophagy in Drosophila through RNAi analysis [31]. Each of these mutations caused a significant decrease in starvation-induced autophagy (compare Supplemental Figure S3A to S3B & S3E; Supplemental Figure S3K), which could be rescued by transgenic expression of the respective wild type gene (Supplemental Figure S3C, F, & K), and by excision of the P insertion from Atg8a (Supplemental Figure S3D & K). Importantly, each also mutation caused a significant inhibition of Atg1-induced autophagy (Figure 1H & I; Supplemental Figure S3G, H, & K). Together, these results indicate that Atg1 is both necessary and sufficient to induce a complete autophagic response, and that Atg1-induced autophagy engages at least some of the same molecular machinery as starvation-induced autophagy.
Atg1-dependent autophagy restricts cell growth
Inhibition of autophagy is strongly correlated with the cell growth effects of TOR / PI3K signaling, suggesting that as a catabolic process autophagy may inhibit growth. To determine whether the increased level of autophagy in TOR / PI3K pathway mutants contributes to their reduced rate of cell growth, we first examined the growth properties of mitotic clones in the wing imaginal disc. We found that clones of cells with a null mutation in Pdk1, a positive regulator of the TOR pathway [12], were reduced in size by 78% as compared with their wild type twinspot (Figure 2A & E). Clones doubly mutant for Pdk1 and Atg1 showed no significant difference in size from Pdk1 mutant clones (Figure 2B & E), indicating that while loss of Pdk1 induces autophagy [5], this does not contribute significantly to the reduced growth rate of Pdk1 null mutant cells. This result is consistent with our previous finding that RNAi-mediated inhibition of autophagy does not alleviate the growth defect of Tor null mutant cells [5].
Figure 2.
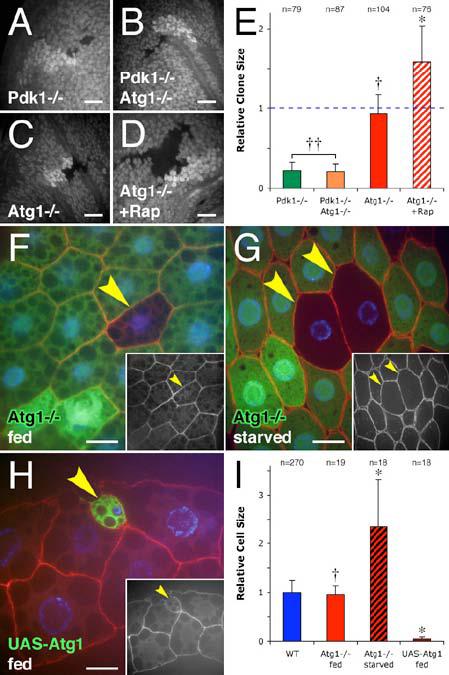
Atg1 expression leads to reduced cell size.
(A-D) Growth effects of Atg1 loss of function in wing disc clones. Pdk1 mutant clones (loss of GFP) display decreased clone size relative to the wild type twin spot (increased GFP) (A). Simultaneous loss of Atg1 (B) fails to rescue this reduction in size. Atg1 mutant clones do not display a growth phenotype when grown on normal medium (C), but growth on medium containing 2 μM rapamycin gives the Atg1 mutant clones a relative growth advantage over wild type (D).
(E) Quantitation of relative clone size in wing discs. Mean clone size normalized to wild type twin spot within the same image. Dotted line indicates a 1:1 ratio (no growth phenotype). †† indicates no significant difference from Pdk1 mutant clones: p = 0.44; † indicates an insignificant difference from wild type twinspot: p = 0.28; * indicates a significant difference from wild type twinspot: p = 0.016. n indicates clone number.
(F-H) Cell size effects of Atg1 in the fat body. Clonal loss of Atg1 function (loss of GFP, arrowheads) has no effect on fat body cell size in normally fed animals (F), but results in a relative growth advantage in animals starved of all nutrients for 45 hr (G). Clonal overexpression of Atg1 (GFP positive cells, arrowhead) (H) results in a marked reduction in cell size. Actin cytoskeleton (red) is labeled with phalloidin (F-G) or alpha-spectrin antibody (H), nuclei are marked in blue. DNA channel in (H) shows two representative confocal sections. Insets show phalloidin (or alpha-spectrin) channels of respective images.
(I) Quantitation of relative cell size in fat body. Mean cell size normalized to wild type (homozygous and heterozygous) cells within the same image. Wild type column includes cells from both fed and starved animals. † indicates no significant difference from wild type: p = 0.54; * indicates a significant difference from wild type: p < 0.0001. n indicates cell number.
Scale bars represent 10 μm. Error bars indicate SD.
Genotypes: (A) hsflp/+; Pdk15 FRT80B/Ubi-GFP FRT80B. (B) hsflp/+; Pdk15 Atg1Δ3D FRT80B/Ubi-GFP FRT80B. (C-D) hsflp/+; Atg1Δ3D FRT80B/Ubi-GFP FRT80B. (E) As in panels A-D. (F-G) hsflp/+; Cg-GAL4/+; Atg1Δ3D FRT80B/UAS-2x eGFP FRT80B. (H) hsflp/+; Act>CD2>GAL4 UAS-GFP/UAS-Atg16B. (I) As in panels F-H.
We reasoned that the severe block to TOR / PI3K signaling in Pdk1 and Tor null mutants may lead to metabolic changes that mask the potential growth effects of autophagy. For example, the reduction of nutrient import in Tor null mutant cells [32] may engender a requirement for nutrients generated by autophagy, and thus the potential growth suppressive effects of autophagy may be balanced or outweighed by its metabolic benefits under these severe conditions. To test the potential growth effects of autophagy under conditions of more moderately reduced TOR signaling, we treated larvae with a concentration of rapamycin that causes a twofold delay in larval development. In normally fed animals, the size of Atg1 null mutant clones did not differ significantly from their twin spot controls (Figure 2C & E). In contrast, addition of rapamycin to the media gave Atg1 mutant clones a significant growth advantage over wild type cells, resulting in a 59% larger average clone size compared to the wild type twinspot (Figure 2D & E).
To test the growth functions of autophagy under more physiological conditions, we examined the effects of starvation on the relative size of wild type and Atg1 mutant cells in the larval fat body. We found that, as in wing discs, Atg1 mutant cells did not show a significant difference in size relative to neighboring wild type cells in normally fed animals (Figure 2F & I), consistent with the low rates of autophagy observed under these conditions. Prolonged starvation, however, gave Atg1 mutant cells a 2.3-fold growth advantage over their wild type neighbors (Figure 2G & I). Similar results were observed in cells expressing an RNAi construct targeting Atg5 (data not shown). We conclude that under physiological conditions that reduce TOR signaling, induction of autophagy is partially responsible for the observed reduced rates of cell growth. These results are consistent with recent findings that autophagy is required for starvation-induced size reduction of mouse embryonic fibroblasts, using a tetracycline-regulated Atg5 expression system [33].
As a complement to these genetic loss of function studies, we tested the growth effects of autophagy induced by UAS-Atg1 expression. Clonal overexpression of Atg1 caused a striking inhibition of fat body cell growth, resulting in a 94% decrease in cell area (Figure 2H & I). A corresponding decrease in nuclear size and DNA content was also observed in Atg1-expressing cells (Figure 2H; see also Figure 4D & E), indicating that high levels of autophagy inhibit the endoreplicative cell cycle of these cells. Constitutive expression of Atg1 throughout the fat body, or in the eye or wing imaginal disc, also resulted in a marked reduction in size of these organs (Figure 5C, Supplemental Figure S2G, and data not shown). Together, these results indicate that autophagy is necessary for normal growth inhibition in response to reduced TOR signaling, and is sufficient to inhibit cell growth independent of upstream signaling.
Figure 4.
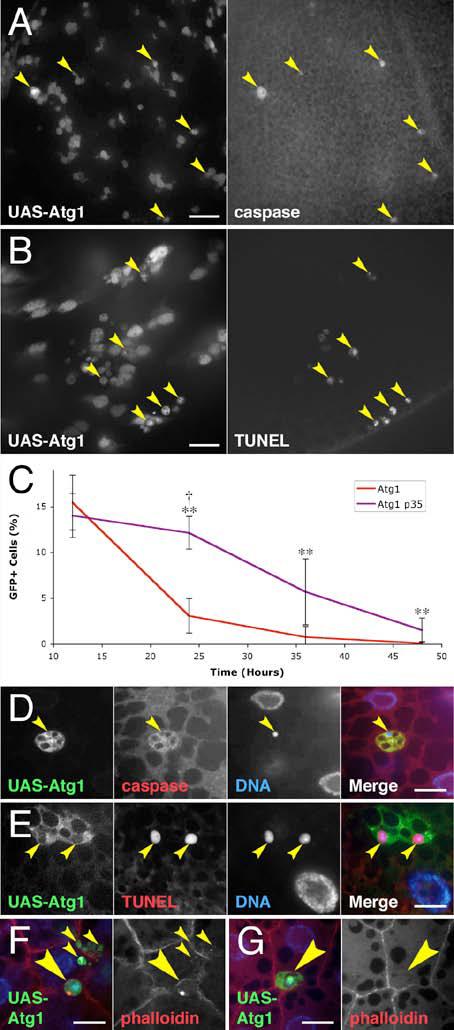
Atg1 overexpression induces apoptosis.
(A) Wing discs display active caspase 3 staining (arrowheads) in 20% (±15%, p = 0.007) of cells overexpressing Atg1 (GFP positive cells).
(B) Wing discs show DNA fragmentation in 22% (±6%, p = 0.0002) of Atg1 overexpressing cells (GFP positive cells) by TUNEL staining (arrowheads).
(C) Co-expression of p35 reduces elimination of Atg1 overexpressing cells. Mean numbers of GFP-positive cells are expressed as a percentage of total cells. ** indicates a significant difference from Atg1 overexpression alone: p < 0.020; † indicates no significant difference from the wild type control: p = 0.63.
(D-G) Fat body cells overexpressing Atg1 die by apoptosis. (D) An Atg1 overexpressing cell (arrowhead) staining for active caspase 3. (E) Atg1 overexpressing cells (arrowheads) staining positive for TUNEL. TUNEL and DNA channels show two representative confocal sections. (F) Atg1 overexpressing cells with aberrant actin staining (large arrowhead) or that have fragmented and been absorbed into neighboring cells (small arrowheads). (G) A cell overexpressing Atg1 (arrowhead) has lost most peripheral actin staining and has been completely engulfed by a neighboring fat body cell. Scale bars represent 10 μm. Nuclei are marked in blue. Error bars indicate SD.
Genotypes: (A-B, D-G) hsflp/+; Act>CD2>GAL4 UAS-GFP/UAS-Atg16B. (C) Control: hsflp/+; Act>CD2>GAL4 UAS-GFP/+. Atg1: hsflp/+; Act>CD2>GAL4 UAS-GFP/UAS-Atg16B. Atg1 p35: hsflp/+; Act>CD2>GAL4 UAS-GFP/UAS-Atg16B UAS-p35.
High levels of autophagy lead to apoptotic cell death
Autophagy and cell death are correlated in a number of contexts, but the causal relationships are unclear. To test the potential role of autophagy in promoting cell death, we induced clones of GFP-marked wing imaginal disc cells overexpressing Atg1, and assayed the percentage of GFP-positive cells at successive intervals after induction. Although this approach does not monitor individual cells in real time, it allowed us to make strong inferences about their survival by assaying large numbers of cells across multiple timepoints. We found that, in contrast to control cells expressing GFP alone, most cells overexpressing Atg1 were eliminated within 36 hours of induction (Figure 3A-C). Reduced cell numbers were noticeable by 12 hours after induction, the earliest timepoint at which we could identify GFP expression. Elimination of Atg1 overexpressing cells was significantly reduced in an Atg8a mutant background (Figure 3D), suggesting that cell death resulted directly from increased autophagy.
Figure 3.
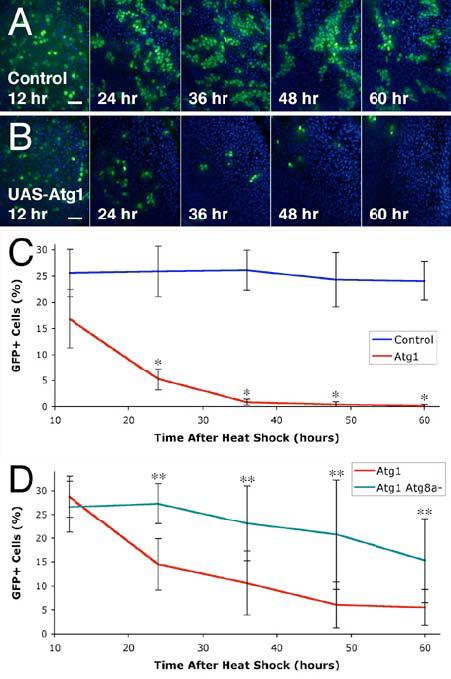
Overexpression of Atg1 leads to cell elimination.
(A-C) Elimination of Atg1 overexpressing clones in the wing disc. Wild type controls show consistent numbers of GFP positive cells at 12, 24, 36, 48, and 60 hours after induction by heat shock (A). Cells overexpressing Atg1 (GFP positive cells) are abundant 12 hours after heat shock, but are eliminated over time (B). Mean numbers of GFP-positive cells, expressed as a percentage of total cells (C). * indicates a significant difference from the wild type control: p < 0.0001.
(D) Mutation of Atg8a delays elimination of Atg1 overexpressing cells. Mean numbers of GFP-positive cells are expressed as a percentage of total cells. ** indicates a significant difference from Atg1 overexpression alone: p < 0.03.
Scale bars represent 10 μm. Nuclei are marked in blue. Error bars indicate SD.
Genotypes: (A) hsflp/+; Act>CD2>GAL4 UAS-GFP/+. (B) hsflp/+; Act>CD2>GAL4 UAS-GFP/UASAtg16B. (C) As in panels A & B. (D) Atg1: hsflp/Y; tub>CD2>GAL4/+; UAS-Atg16B/+. Atg1 Atg8a-: hsflp Atg8aKG07569/Y; tub>CD2>GAL4/+; UAS-Atg16B/+.
Cells undergoing autophagic cell death have been observed to display signs of apoptosis [34, 35]. We therefore examined Atg1 overexpressing cells for caspase activity and DNA fragmentation, hallmark features of apoptotic cells. We found that 20% of wing disc cells clonally overexpressing Atg1 displayed caspase activation, as shown by active Caspase-3 antibody staining (Figure 4A). Similarly, terminal uridine nick end labeling (TUNEL) revealed DNA fragmentation in 22% of Atg1 overexpressing cells (Figure 4B). Consistent with these observations, co-expression of the caspase inhibitor p35 was sufficient to delay the death of Atg1 overexpressing cells, although these cells were also eventually eliminated (Figure 4C). Similar effects on Caspase-3 activation and TUNEL staining were observed in fat body cells clonally overexpressing Atg1 (Figure 4D & E). We also observed that Atg1 overexpression resulted in reduced or absent filamentous actin staining at the periphery of these cells, and that they often became fragmented and/or engulfed by neighboring wild type cells (Figure 4F & G).
Constitutive expression of Atg1 throughout the fat body (see Figure 5C) also resulted in substantial apoptosis (13% positive for caspase activation, 17% for TUNEL; Supplemental Figure S3I), and this cell death was reduced by 94% in Atg3 mutants (p < 0.0001; Supplemental Figure S3J). TUNEL and active Caspase-3 staining due to clonal Atg1 overexpression were also reduced by 33% and 35%, respectively, in Atg8a mutants, consistent with their partial reduction in Atg1-induced Lysotracker staining (see Figure 1H) and elimination (see Figure 3D). These results indicate that the apoptosis observed in Atg1-overexpressing cells is due to high levels of autophagy.
The reduced eye size resulting from Atg1 overexpression (compare Supplemental Figure S2F & S2G) also appears to be due in part to apoptosis, as co-expression of the caspase inhibitors DIAP1 or p35 resulted in a partial suppression of this phenotype (Supplemental Figure S2H and data not shown). Finally, we found that Atg1 overexpression mediated by GMR-GAL4 led to a decrease in adult viability, and that this was suppressed by co-expression of p35 or DIAP1 (Supplemental Figure S2D).
Together, these results indicate that constitutive overexpression of Atg1 leads to a form of cell death that is both caspase- and autophagy-dependent, with features typical of apoptosis, such as DNA and cytoskeletal fragmentation. We therefore conclude that, in addition to promoting cell survival, autophagy has the capacity to promote cell death when induced to high levels.
Atg1-dependent phenotypes are modulated by the TOR / PI3K pathway
In yeast, suppression of autophagy by TOR signaling is transduced to the core Atg machinery in part through regulation of the assembly and activity of a multi-protein complex containing Atg1, Atg13, and Atg17. Under growth-promoting conditions, TOR-dependent hyperphosphorylation of Atg13 reduces its affinity for Atg1, resulting in dissociation of Atg13 from the complex and decreased kinase activity of Atg1. Upon TOR inactivation, dephosphorylation of Atg13 increases its affinity for Atg1, leading to increased Atg1 kinase activity and induction of autophagy [18]. Whether these aspects of Atg1 regulation by TOR signaling are conserved in higher eukaryotes is unclear, as homologs of Atg13 or Atg17 have not been identified in animals.
To investigate the connection between TOR and Atg1 in Drosophila, we tested whether increased TOR activity affected the ability of Atg1 overexpression to induce autophagy. As described above, heat shock-driven overexpression of Atg1 led to induction of autophagy in the fat body of normally fed larvae (Figure 5A & E). However, we found that in animals mutant for Tsc2, a negative regulator of TOR, induction of autophagy by heat shock-induced Atg1 overexpression was significantly reduced (Figure 5B & E). Similarly, induction of autophagy and inhibition of cell growth by constitutive expression of Atg1 throughout the fat body (Figure 5C) was strongly suppressed by co-expression of the small GTPase Rheb, an upstream activator of TOR signaling (Figure 5D). Overexpression of Rheb also significantly delayed the elimination of wing disc cells caused by Atg1 overexpression (Figure 5F). These results are consistent with the idea that TOR signaling in Drosophila may inhibit Atg1 activity as in yeast, although they do not rule out parallel, opposing inputs to autophagy by Atg1 and TOR.
Atg1 negatively feeds back on TOR signaling
Although studies in yeast indicate that Atg1 is directly associated with multiple components of the autophagic machinery, the effects of Atg1 overexpression on cell growth and autophagy in Drosophila could in principle be indirect, for example through modulation of signaling pathways that regulate autophagy, such as PI3K and TOR. To address this possibility, we examined the effect of Atg1 overexpression on cellular and biochemical markers of PI3K and TOR activity. The intracellular localization of the transcription factor FOXO serves as an in vivo readout of PI3K activity, as it resides in the nucleus under conditions of low PI3K activity, and relocalizes to the cytoplasm in response to PI3K-dependent phosphorylation by Akt [36]. FOXO itself has also been shown to induce autophagy [29]. However, we found that FOXO localization was unchanged by overexpression of Atg1 in fat body cells (Figure 6A), indicating that overexpression of Atg1 does not induce autophagy by affecting TOR / PI3K signaling upstream of Akt.
Figure 6.
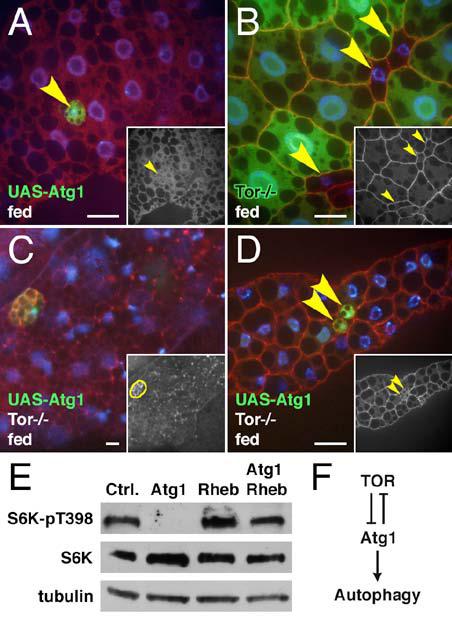
Feedback by Atg1 on TOR.
(A) Atg1 overexpression (GFP positive cell) does not cause FOXO (red) to localize to the nucleus (arrowhead). Inset shows FOXO channel.
(B) Tor null cells (loss of GFP, arrowheads) are 70% smaller than surrounding wild type cells; p < 0.0001. Inset shows phalloidin channel.
(C-D) Overexpression of Atg1 in a Tor mutant background. In Tor null animals, cells overexpressing Atg1 (GFP positive cells) show increased Lysotracker staining (C) and a 58% reduction in size (D); p = 0.0003. DNA channel in (D) shows three representative confocal sections. Inset in (C) shows Lysotracker channel with clonal boundaries outlines in yellow. Inset in (D) shows phalloidin channel; arrowheads indicate Atg1 overexpressing cells.
(E) Western blot showing a decrease in S6K phosphorylation in fat body from larvae overexpressing Atg1, but not from animals overexpressing both Atg1 and Rheb.
(F) Inhibitory feedback by Atg1.
Scale bars represent 10 μm. Nuclei are marked in blue.
Genotypes: (A) hsflp/+; Act>CD2>GAL4 UAS-GFP/UAS-Atg16B. (B) hsflp; TorΔP FRT40A/UAS-2x eGFP FRT40A fb-GAL4. (C) hsflp; TorΔP/TorΔP; Act>CD2>GAL4 UAS-GFP UAS-Atg1GS10797/+. (D) hsflp; TorΔP/TorΔP; Act>CD2>GAL4 UAS-GFP/UAS-Atg16B. (E) Control: Hsp70-GAL4/+. Atg1: Hsp70-GAL4/UAS-Atg16B. Rheb: Hsp70-GAL4/UAS-RhebEP50.084-loxP. Atg1 Rheb: Hsp70-GAL4/UAS-Atg16BUAS-RhebEP50.084-loxP.
As a measure of TOR activity, we examined the effect of Atg1 overexpression on S6K phosphorylation. TOR specifically phosphorylates Drosophila S6K at Thr398, homologous to Thr389 of S6K1 in mammals [12]. Western blot analysis showed that while total S6K levels increased slightly in fat body from larvae overexpressing Atg1, phosphorylation of S6K at Thr398 was strongly reduced (Figure 6E). Rheb overexpression increased the level of S6K phosphorylation as expected, and restored S6K phosphorylation when co-overexpressed with Atg1. These results suggest that Atg1 overexpression leads to a downregulation of TOR activity. While this effect alone could, in theory, account for the effect of Atg1 overexpression on autophagy and cell size, several observations suggest that this is not the case. Tor mutant fat body cells show constitutive autophagy [5] and are reduced in size (Figure 6B). However, we found that overexpression of Atg1 in Tor null mutant animals led to a further increase in autophagy (Figure 6C) and a further decrease in cell size (Figure 6D), indicating that these effects are largely independent of TOR. Moreover, the growth reduction of Atg1 overexpressing cells is significantly more severe than that of Tor null mutant cells (94% vs. 70%; p < 0.0001; compare Figure 2H & 6B), further indicating that the size reduction in Atg1 expressing cells is at least partially TOR-independent. Thus, downregulation of TOR activity by Atg1 overexpression does not fully account for its effects on autophagy and cell size. Rather, these data are best described by a model whereby Atg1 overexpression negatively feeds back on TOR (Figure 6F), leading to a further activation of autophagy and reduced cell growth.
The kinase domain of Atg1 is essential for induction of autophagy
As described above, it is unclear whether the kinase activity of Atg1 is required for proper induction of autophagy in yeast. To address this issue, we generated a kinase-negative mutant of Drosophila Atg1 (Atg1K38Q) through site-directed mutagenesis of lysine 38, in the ATP binding site of the kinase domain. This residue is homologous to lysine 54 of yeast Atg1, which has been shown to be required for normal kinase activity [18].
We found that expression of Atg1K38Q did not lead to increased autophagy in the fat body of normally fed animals (Figure 7A), nor was it able to rescue the autophagy defect in Atg1 null mutants (Supplemental Figure S1D & G). Consistent with these results, clonal expression of Atg1K38Q in the wing imaginal disc did not result in cell elimination, caspase activation, or DNA fragmentation (Figure 7F and data not shown), unlike wild type Atg1. Interestingly, we found that expression of Atg1K38Q was sufficient to inhibit starvation- or rapamycin-induced autophagy when expressed in clones (Figure 7B and Supplemental Figure S1F) or throughout the fat body (compare Figure 7C & 7D; Figure 7E), suggesting that kinase-defective Atg1 interferes with the function of wild type Atg1, acting as a dominant negative mutant. Similarly, expression of Atg1K38Q in the eye partially rescued the lethality and reduced adult eye size caused by Atg1 overexpression, but had no effect on eye morphology when expressed alone (Supplemental Figure S2D, I, & J, respectively).
Figure 7.
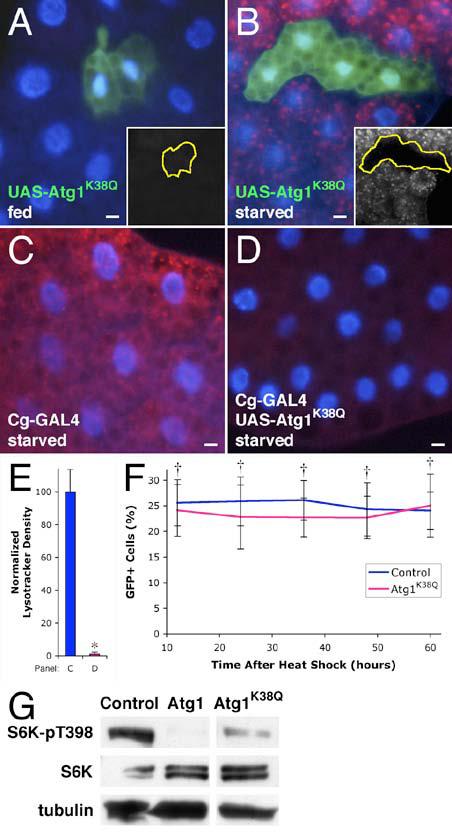
Induction of autophagy requires Atg1 kinase activity.
(A-D) Expression of kinase-defective Atg1 inhibits autophagy. Atg1K38Q expression has no effect on autophagy in fed animals (A), but cell autonomously inhibits induction of autophagy in the fat body of starved animals (B). Tissue-wide induction of autophagy by starvation (C) is inhibited by expression of kinase inactive Atg1 (D). Insets show the Lysotracker channel of the respective images, with clonal boundaries outlined in yellow.
(E) Quantitation of Lysotracker staining. * indicates a significant difference from wild type: p < 0.0001.
(F) Wing disc cells overexpressing kinase-defective Atg1 are not eliminated. Mean numbers of GFP-positive cells are expressed as a percentage of total cells. † indicates no significant difference from the wild type control: p > 0.1.
(G) Kinase-defective Atg1 leads to a modest reduction in TOR signaling. Nonconsecutive lanes are shown from the same Western blot.
Scale bars represent 10 μm. Nuclei are marked in blue. Error bars indicate SD.
Genotypes: (A-B) hsflp/+; Act>CD2>GAL4 UAS-GFP/UAS-Atg1KQ13A. (C) Cg-GAL4/+. (D) Cg-GAL4/+; UAS-Atg1KQ13A/+. (E) As in panels C & D. (F) Control: hsflp/+; Act>CD2>GAL4 UAS-GFP/+. Atg1K38Q: hsflp/+; Act>CD2>GAL4 UAS-GFP/UAS-Atg1KQ13A. (G) Control: Hsp70-GAL4 /+. Atg1: Hsp70-GAL4/UAS-Atg16B. Atg1K38Q: Hsp70-GAL4/UAS-Atg1KQ13A.
Expression of Atg1K38Q was not completely without effect, however, as we observed that it leads to a partial reduction in TOR activity (Figure 7G), as well as a modest decrease in cell size (see Figure 7A & B). These findings imply an as-yet undetermined function of Atg1 that does not rely on its kinase activity. Indeed, the fact that Atg1K38Q was able to rescue a low percentage of Atg1 mutant flies to adulthood (Supplemental Figure S1A) implies that Atg1 has a kinase-independent function outside regulation of autophagy. We therefore conclude that while Atg1 appears to have undetermined kinase-independent function, the kinase activity of Atg1 is essential for its ability to promote autophagy in Drosophila.
Discussion
Regulation of autophagy by Atg1
Delivery of cytoplasmic components to the lysosome through autophagy involves multiple distinct steps including nucleation, expansion and closure of the autophagosome, and its subsequent fusion with the lysosome. These membrane trafficking events require the recruitment and subsequent retrieval of a large number of autophagy-specific Atg proteins, as well as general factors involved in vesicle trafficking. Given this complexity, the finding that overexpression of a single Atg protein is sufficient to accomplish all essential steps in this process is striking. As autophagy occurs constitutively at a basal rate in most eukaryotic cells [6], acceleration of a single rate-limiting step by overexpression of Atg1 may be sufficient to increase the overall rate of autophagy. Alternatively, the interaction of Atg1 with multiple Atg proteins suggests that Atg1 may function at multiple steps in the autophagic process. Identification of the relevant in vivo substrates of Atg1 will help to clarify this issue. A recent yeast proteomic microarray study identified a number of in vitro substrates of Atg1, including Atg8 and Atg18, which function in autophagosomal expansion and retrieval of components of the autophagic machinery, respectively, as well as general factors involved in vesicle transport and vacuolar function [21].
The role of the kinase activity of yeast Atg1 in regulating autophagy is the matter of some debate, as different groups have drawn conflicting conclusions. A consensus view, however, may be that autophagy and the CVT pathway require different levels of Atg1 kinase activity, or that Atg1 has different substrates under differing nutrient conditions. In higher eukaryotes, the role of Atg1 kinase activity may differ from that in yeast, as the CVT pathway has not been observed in metazoan cells. Consistent with the findings of Ohsumi and colleagues [18, 24], however, our results indicate that the kinase domain of Drosophila Atg1 is required for autophagy, as the kinase-inactive Atg1K38Q mutant failed to restore starvation-induced autophagy to Atg1 mutants, and was unable to induce autophagy when overexpressed. However, the partial reduction in size and TOR activity observed upon expression of Atg1K38Q, as well as its partial rescue of Atg1 mutants, indicate that Atg1 may have other, kinase-independent functions beyond regulating autophagy.
The mechanisms by which upstream signaling pathways regulate Atg1 are also likely to differ between yeast and multicellular organisms, as essential components of the TOR-regulated Atg1 complex such as Atg13 and Atg17 are not readily identifiable in animal genomes. Nonetheless, our results are consistent with a similar negative regulation of Atg1 by TOR, as activation of TOR signaling by Rheb overexpression or Tsc2 mutation suppressed the ability of Atg1 to induce autophagy. Increased Atg1 activity in response to loss of TOR signaling is likely to be critical for cell homeostasis and survival, as animals doubly mutant for Atg1 and Tor show a synthetic embryonic lethal phenotype [5]. In addition, our results demonstrate an unexpected mode of signaling from Atg1 to TOR, in which increased Atg1 levels lead to downregulation of TOR kinase activity. It is unclear whether this reflects a direct effect of Atg1 on the activity of TOR or an upstream regulator, or an indirect consequence of the high level of autophagy in these cells, perhaps through increased turnover of TOR signaling components. The finding that a pool of TOR protein resides on intracellular vesicles [32, 37] and that TOR signaling is reduced in endocytic mutants [32] suggests that TOR activity may respond to rates of vesicular trafficking, such as autophagy. Regardless of mechanism, these results suggest the existence of a self-reinforcing feedback loop, whereby increased Atg1 levels lead to downregulation of TOR activity, resulting in further activation of Atg1. In contrast, we have shown previously that induction of autophagy in response to loss of TOR signaling is dampened by the resultant inactivation of S6K, which is required for normal autophagy [5]. Thus TOR-mediated regulation of autophagy involves both positive and negative feedback.
Autophagy as a negative effector of cell growth
Autophagy is a catabolic process that inversely correlates with cell growth, suggesting that increased levels of autophagy observed in growth-restricted cells may contribute to their reduced growth rate. The results presented here provide genetic support for this model. Our data indicate that clones of autophagy-defective cells have a growth advantage over wild type cells under physiological conditions that normally induce autophagy, including starvation and rapamycin treatment. These results are confirmed by the marked size reduction of cells overexpressing Atg1, further supporting the role of autophagy as a negative effector of growth in TOR signaling. Thus, autophagy is partly responsible for the growth restriction resulting from physiological inhibition of TOR signaling, and is capable of inhibiting growth independent of TOR signaling.
In contrast to the growth advantage we observed in autophagy defective cells, previous studies using yeast or cultured mammalian cells reported that inhibition of autophagy results in rapid cell death in response to starvation [2, 17]. This difference is likely due to the mosaic nature of our experiments, in which clones of Atg1 mutant cells are surrounded by autophagy-competent wild type cells, and may in effect parasitize nutrients liberated through the autophagic activity of their neighbors. This is likely to be particularly evident in fat body cells, which are specialized for nutrient storage and mobilization. We note that this genetic mosaicism is similar to the situation facing tumor cells within wild type tissues. Thus, the increased growth capacity resulting from disruption of autophagy may contribute to the tumorigenicity of cells mutant for tumor suppressors such as PTEN, TSC1 & 2, beclin 1/Atg6 [5, 7, 8] and possibly LC3/Atg8 and Atg7 [38].
Whereas autophagy had an inhibitory effect on cell growth under physiological conditions, this was not the case in cells with severely disrupted TOR signaling, such as in cells with null mutations in Pdk1 (this report) or Tor [5], despite the strong correlation of reduced cell growth and increased autophagy in these cells. Disruption of autophagy had no effect on the growth of Pdk1 null cells, and actually led to a further decrease in cell size of Tor mutants. In the complete absence of TOR signaling, nutrient uptake is severely curtailed [32], and under these extreme conditions the metabolic benefits of nutrients liberated by autophagy may outweigh its potential growth-inhibitory catabolic effect. We conclude that autophagy has context-dependent effects on cell growth, providing for a rudimentary level of metabolism and growth under conditions of severe nutrient deprivation, acting as a net inhibitor of growth under conditions of reduced TOR signaling, and strongly inhibiting cell growth when induced to high levels. These findings add autophagy to the growing list of effector pathways and cellular processes through which TOR signaling controls cell growth, including translation, transcription, nutrient import and endocytosis.
Autophagy and cell death
Previous studies in a number of experimental systems indicate that the role of autophagy in cell death is also likely to be context-dependent. For example, autophagy has been found to protect against cell death in cases of growth factor withdrawal, starvation, and neurodegeneration [17, 39, 40], but to be required for some cases of autophagic cell death [14-16, 41]. Thus, observations of autophagic structures in dying cells are equally consistent with a causal, neutral or even inhibitory role of autophagy in cell death. The ability to induce autophagy through Atg1 overexpression has enabled us to directly test the potential role of autophagy in promoting cell death. Our results indicate that induction of autophagy is sufficient to induce cell death. We find that death resulting from Atg1-induced autophagy is suppressed by caspase inhibition and is associated with caspase activation, DNA fragmentation, and cytoskeletal disruption, suggesting that high levels of autophagy result in apoptotic cell death. The connection between apoptosis and autophagy is further supported by the recent demonstration that overexpression of the anti-apoptotic protein Bcl-2 can inhibit autophagy by interacting with the Atg6 homolog Beclin 1 [42]. Mutant versions of Beclin 1 that are unable to bind Bcl-2 stimulate autophagy and promote cell death, similar to the effects of Atg1.
By what mechanisms might autophagy lead to cell death? The observation that starvation-induced autophagy is reversible and does not normally result in cell elimination suggests that starvation conditions may be protective against autophagy-induced death. Induction of autophagy is tolerated or even beneficial in cells with reduced biosynthetic activity, but may be detrimental in cells whose resources are devoted to continued growth. Self-limiting mechanisms also serve to prevent starvation-induced autophagy from proceeding at continuously high levels [5, 42]. During autophagic cell death, alternate activation of the autophagic machinery may circumvent these feedback mechanisms, resulting in high levels of sustained autophagy that are destructive to the cell. In addition, the level of Atg1 gene expression may be critical, as it is not upregulated under starvation conditions [27], but its levels peak at the beginning of the Drosophila pupal stage [43], when autophagic cell death is induced. Autophagic cell death may also result from the selective degradation of specific survival-promoting or death-inhibiting factors. In this regard, it was recently shown that the caspase-inhibitor zVAD results in targeted autophagic degradation of catalase, leading to accumulation of radical oxygen species and death [16].
Concluding remarks
In summary, our results demonstrate that constitutive induction of autophagy inhibits cell growth and leads to cell death, highlighting the importance of physiological mechanisms that restrain this process. In addition, the finding that Atg1 expression is sufficient to induce autophagy provides a new tool for experimental or therapeutic manipulation of autophagy. Compounds that target the kinase activity of Atg1 may lead to novel therapies for the wide range of diseases linked to autophagy.
Experimental Procedures
GFP-marked overexpression clones in the fat body were generated through heat shock-independent induction as described [44] and in the wing disc using 1 hr heat shock at 37°C, 36-48 hr after hatching (elimination studies) or 30-60 min heat shock at 37°C, 24-52 hr after hatching (staining). Mutant clones in the fat body were generated by FLP/FRT mitotic recombination [45] using 2 hr heat shock at 37°C, 0-8 hr after egg laying. Cell elimination was quantitated using 5 images of each genotype; an average of 208 cells were quantitated. Because Ubi-GFP was found to have variable expression in the fat body, UAS-GFP driven by fb-GAL4 or Cg-GAL4 was used as a marker in that tissue. Mutant clones in the wing disc were generated with 2 hr heat shock at 37°C, 24-28 hr after hatching. 72-96 hr after hatching, untreated larvae containing mutant clones were dissected immediately (fed) or starved for 45 hr on PBS (starved). Rapamycin treated larvae were raised on 2 μM rapamycin in fly medium from hatching and were dissected 192-196 hr after hatching. Hsp70-GAL4 driven overexpression of Atg1 was induced using 2 hr (1 hr in Figure 5) heat shock at 37°C, 48-72 hr after hatching, followed by 6 hr recovery at room temperature. Significance was determined in all experiments using two-tailed p values from unpaired t test. See Supplemental Data for additional procedures.
Supplementary Material
Acknowledgements
We thank members of the Neufeld lab for helpful discussions and comments on the manuscript. This work was supported by National Institutes of Health grant RO1 GM62509.
References
- 1.Levine B, Klionsky DJ. Development by self-digestion: molecular mechanisms and biological functions of autophagy. Dev Cell. 2004;6:463–477. doi: 10.1016/s1534-5807(04)00099-1. [DOI] [PubMed] [Google Scholar]
- 2.Tsukada M, Ohsumi Y. Isolation and characterization of autophagy-defective mutants of Saccharomyces cerevisiae. FEBS Lett. 1993;333:169–174. doi: 10.1016/0014-5793(93)80398-e. [DOI] [PubMed] [Google Scholar]
- 3.Thumm M, Egner R, Koch B, Schlumpberger M, Straub M, Veenhuis M, Wolf DH. Isolation of autophagocytosis mutants of Saccharomyces cerevisiae. FEBS Lett. 1994;349:275–280. doi: 10.1016/0014-5793(94)00672-5. [DOI] [PubMed] [Google Scholar]
- 4.Klionsky DJ, Cregg JM, Dunn WA, Jr., Emr SD, Sakai Y, Sandoval IV, Sibirny A, Subramani S, Thumm M, Veenhuis M, Ohsumi Y. A unified nomenclature for yeast autophagy-related genes. Dev Cell. 2003;5:539–545. doi: 10.1016/s1534-5807(03)00296-x. [DOI] [PubMed] [Google Scholar]
- 5.Scott RC, Schuldiner O, Neufeld TP. Role and regulation of starvation-induced autophagy in the Drosophila fat body. Dev Cell. 2004;7:167–178. doi: 10.1016/j.devcel.2004.07.009. [DOI] [PubMed] [Google Scholar]
- 6.Shintani T, Klionsky DJ. Autophagy in health and disease: a double-edged sword. Science. 2004;306:990–995. doi: 10.1126/science.1099993. [DOI] [PMC free article] [PubMed] [Google Scholar]
- 7.Arico S, Petiot A, Bauvy C, Dubbelhuis PF, Meijer AJ, Codogno P, Ogier-Denis E. The tumor suppressor PTEN positively regulates macroautophagy by inhibiting the phosphatidylinositol 3-kinase/protein kinase B pathway. J Biol Chem. 2001;276:35243–35246. doi: 10.1074/jbc.C100319200. [DOI] [PubMed] [Google Scholar]
- 8.Liang XH, Jackson S, Seaman M, Brown K, Kempkes B, Hibshoosh H, Levine B. Induction of autophagy and inhibition of tumorigenesis by beclin 1. Nature. 1999;402:672–676. doi: 10.1038/45257. [DOI] [PubMed] [Google Scholar]
- 9.Petiot A, Ogier-Denis E, Blommaart EF, Meijer AJ, Codogno P. Distinct classes of phosphatidylinositol 3′-kinases are involved in signaling pathways that control macroautophagy in HT-29 cells. J Biol Chem. 2000;275:992–998. doi: 10.1074/jbc.275.2.992. [DOI] [PubMed] [Google Scholar]
- 10.Noda T, Ohsumi Y. Tor, a phosphatidylinositol kinase homologue, controls autophagy in yeast. J Biol Chem. 1998;273:3963–3966. doi: 10.1074/jbc.273.7.3963. [DOI] [PubMed] [Google Scholar]
- 11.Neufeld TP. Role of autophagy in developmental cell growth and death: insights from Drosophila. In: Klionsky DJ, editor. Autophagy. Landes Bioscience; Georgetown: 2004. pp. 224–232. [Google Scholar]
- 12.Wullschleger S, Loewith R, Hall MN. TOR signaling in growth and metabolism. Cell. 2006;124:471–484. doi: 10.1016/j.cell.2006.01.016. [DOI] [PubMed] [Google Scholar]
- 13.Clarke PG. Developmental cell death: morphological diversity and multiple mechanisms. Anat Embryol (Berl) 1990;181:195–213. doi: 10.1007/BF00174615. [DOI] [PubMed] [Google Scholar]
- 14.Shimizu S, Kanaseki T, Mizushima N, Mizuta T, Arakawa-Kobayashi S, Thompson CB, Tsujimoto Y. Role of Bcl-2 family proteins in a non-apoptotic programmed cell death dependent on autophagy genes. Nat Cell Biol. 2004;6:1221–1228. doi: 10.1038/ncb1192. [DOI] [PubMed] [Google Scholar]
- 15.Veneault-Fourrey C, Barooah M, Egan M, Wakley G, Talbot NJ. Autophagic fungal cell death is necessary for infection by the rice blast fungus. Science. 2006;312:580–583. doi: 10.1126/science.1124550. [DOI] [PubMed] [Google Scholar]
- 16.Yu L, Wan F, Dutta S, Welsh S, Liu Z, Freundt E, Baehrecke EH, Lenardo M. Autophagic programmed cell death by selective catalase degradation. Proc Natl Acad Sci U S A. 2006;103:4952–4957. doi: 10.1073/pnas.0511288103. [DOI] [PMC free article] [PubMed] [Google Scholar]
- 17.Lum JJ, Bauer DE, Kong M, Harris MH, Li C, Lindsten T, Thompson CB. Growth factor regulation of autophagy and cell survival in the absence of apoptosis. Cell. 2005;120:237–248. doi: 10.1016/j.cell.2004.11.046. [DOI] [PubMed] [Google Scholar]
- 18.Kamada Y, Funakoshi T, Shintani T, Nagano K, Ohsumi M, Ohsumi Y. Tor-mediated induction of autophagy via an Apg1 protein kinase complex. J Cell Biol. 2000;150:1507–1513. doi: 10.1083/jcb.150.6.1507. [DOI] [PMC free article] [PubMed] [Google Scholar]
- 19.Wang Z, Wilson WA, Fujino MA, Roach PJ. Antagonistic controls of autophagy and glycogen accumulation by Snf1p, the yeast homolog of AMP-activated protein kinase, and the cyclin-dependent kinase Pho85p. Mol Cell Biol. 2001;21:5742–5752. doi: 10.1128/MCB.21.17.5742-5752.2001. [DOI] [PMC free article] [PubMed] [Google Scholar]
- 20.Budovskaya YV, Stephan JS, Deminoff SJ, Herman PK. An evolutionary proteomics approach identifies substrates of the cAMP-dependent protein kinase. Proc Natl Acad Sci U S A. 2005;102:13933–13938. doi: 10.1073/pnas.0501046102. [DOI] [PMC free article] [PubMed] [Google Scholar]
- 21.Ptacek J, Devgan G, Michaud G, Zhu H, Zhu X, Fasolo J, Guo H, Jona G, Breitkreutz A, Sopko R, McCartney RR, Schmidt MC, Rachidi N, Lee SJ, Mah AS, Meng L, Stark MJ, Stern DF, De Virgilio C, Tyers M, Andrews B, Gerstein M, Schweitzer B, Predki PF, Snyder M. Global analysis of protein phosphorylation in yeast. Nature. 2005;438:679–684. doi: 10.1038/nature04187. [DOI] [PubMed] [Google Scholar]
- 22.Reggiori F, Tucker KA, Stromhaug PE, Klionsky DJ. The Atg1-Atg13 complex regulates Atg9 and Atg23 retrieval transport from the pre-autophagosomal structure. Dev Cell. 2004;6:79–90. doi: 10.1016/s1534-5807(03)00402-7. [DOI] [PubMed] [Google Scholar]
- 23.Abeliovich H, Zhang C, Dunn WA, Jr., Shokat KM, Klionsky DJ. Chemical genetic analysis of Apg1 reveals a non-kinase role in the induction of autophagy. Mol Biol Cell. 2003;14:477–490. doi: 10.1091/mbc.E02-07-0413. [DOI] [PMC free article] [PubMed] [Google Scholar]
- 24.Kabeya Y, Kamada Y, Baba M, Takikawa H, Sasaki M, Ohsumi Y. Atg17 functions in cooperation with Atg1 and Atg13 in yeast autophagy. Mol Biol Cell. 2005;16:2544–2553. doi: 10.1091/mbc.E04-08-0669. [DOI] [PMC free article] [PubMed] [Google Scholar]
- 25.Rusten TE, Lindmo K, Juhász G, Sass M, Seglen PO, Brech A, Stenmark H. Programmed autophagy in the Drosophila fat body is induced by ecdysone through regulation of the PI3K pathway. Dev Cell. 2004;7:179–192. doi: 10.1016/j.devcel.2004.07.005. [DOI] [PubMed] [Google Scholar]
- 26.Young AR, Chan EY, Hu XW, Kochl R, Crawshaw SG, High S, Hailey DW, Lippincott-Schwartz J, Tooze SA. Starvation and ULK1-dependent cycling of mammalian Atg9 between the TGN and endosomes. J Cell Sci. 2006 doi: 10.1242/jcs.03172. [DOI] [PubMed] [Google Scholar]
- 27.Kirisako T, Baba M, Ishihara N, Miyazawa K, Ohsumi M, Yoshimori T, Noda T, Ohsumi Y. Formation process of autophagosome is traced with Apg8/Aut7p in yeast. J Cell Biol. 1999;147:435–446. doi: 10.1083/jcb.147.2.435. [DOI] [PMC free article] [PubMed] [Google Scholar]
- 28.Kabeya Y, Mizushima N, Ueno T, Yamamoto A, Kirisako T, Noda T, Kominami E, Ohsumi Y, Yoshimori T. LC3, a mammalian homologue of yeast Apg8p, is localized in autophagosome membranes after processing. Embo J. 2000;19:5720–5728. doi: 10.1093/emboj/19.21.5720. [DOI] [PMC free article] [PubMed] [Google Scholar]
- 29.Juhász G, Puskás LG, Komonyi O, Érdi B, Maróy P, Neufeld TP, Sass M. Gene expression profiling identifies FKBP39 as an inhibitor of autophagy in larval Drosophila fat body. doi: 10.1038/sj.cdd.4402123. submitted. submitted. [DOI] [PMC free article] [PubMed] [Google Scholar]
- 30.Zinke I, Schutz CS, Katzenberger JD, Bauer M, Pankratz MJ. Nutrient control of gene expression in Drosophila: microarray analysis of starvation and sugar-dependent response. Embo J. 2002;21:6162–6173. doi: 10.1093/emboj/cdf600. [DOI] [PMC free article] [PubMed] [Google Scholar]
- 31.Juhász G, Csikós G, Sinka R, Erdélyi M, Sass M. The Drosophila homolog of Aut1 is essential for autophagy and development. FEBS Lett. 2003;543:154–158. doi: 10.1016/s0014-5793(03)00431-9. [DOI] [PubMed] [Google Scholar]
- 32.Hennig KM, Colombani J, Neufeld TP. TOR coordinates bulk and targeted endocytosis in the Drosophila melanogaster fat body to regulate cell growth. J Cell Biol. 2006;173:963–974. doi: 10.1083/jcb.200511140. [DOI] [PMC free article] [PubMed] [Google Scholar]
- 33.Hosokawa N, Hara Y, Mizushima N. Generation of cell lines with tetracycline-regulated autophagy and a role for autophagy in controlling cell size. FEBS Lett. 2006;580:2623–2629. doi: 10.1016/j.febslet.2006.04.008. [DOI] [PubMed] [Google Scholar]
- 34.Debnath J, Mills KR, Collins NL, Reginato MJ, Muthuswamy SK, Brugge JS. The role of apoptosis in creating and maintaining luminal space within normal and oncogene-expressing mammary acini. Cell. 2002;111:29–40. doi: 10.1016/s0092-8674(02)01001-2. [DOI] [PubMed] [Google Scholar]
- 35.Martin DN, Baehrecke EH. Caspases function in autophagic programmed cell death in Drosophila. Development. 2004;131:275–284. doi: 10.1242/dev.00933. [DOI] [PubMed] [Google Scholar]
- 36.Puig O, Marr MT, Ruhf ML, Tjian R. Control of cell number by Drosophila FOXO: downstream and feedback regulation of the insulin receptor pathway. Genes Dev. 2003;17:2006–2020. doi: 10.1101/gad.1098703. [DOI] [PMC free article] [PubMed] [Google Scholar]
- 37.Kunz J, Schneider U, Howald I, Schmidt A, Hall MN. HEAT repeats mediate plasma membrane localization of Tor2p in yeast. J Biol Chem. 2000 doi: 10.1074/jbc.M007296200. [DOI] [PubMed] [Google Scholar]
- 38.Jin S. Autophagy, mitochondrial quality control, and oncogenesis. Autophagy. 2006;2:80–84. doi: 10.4161/auto.2.2.2460. [DOI] [PubMed] [Google Scholar]
- 39.Hara T, Nakamura K, Matsui M, Yamamoto A, Nakahara Y, Suzuki-Migishima R, Yokoyama M, Mishima K, Saito I, Okano H, Mizushima N. Suppression of basal autophagy in neural cells causes neurodegenerative disease in mice. Nature. 2006;441:885–889. doi: 10.1038/nature04724. [DOI] [PubMed] [Google Scholar]
- 40.Komatsu M, Waguri S, Chiba T, Murata S, Iwata J, Tanida I, Ueno T, Koike M, Uchiyama Y, Kominami E, Tanaka K. Loss of autophagy in the central nervous system causes neurodegeneration in mice. Nature. 2006;441:880–884. doi: 10.1038/nature04723. [DOI] [PubMed] [Google Scholar]
- 41.Yu L, Alva A, Su H, Dutt P, Freundt E, Welsh S, Baehrecke EH, Lenardo MJ. Regulation of an ATG7-beclin 1 program of autophagic cell death by caspase-8. Science. 2004;304:1500–1502. doi: 10.1126/science.1096645. [DOI] [PubMed] [Google Scholar]
- 42.Pattingre S, Tassa A, Qu X, Garuti R, Liang XH, Mizushima N, Packer M, Schneider MD, Levine B. Bcl-2 antiapoptotic proteins inhibit Beclin 1-dependent autophagy. Cell. 2005;122:927–939. doi: 10.1016/j.cell.2005.07.002. [DOI] [PubMed] [Google Scholar]
- 43.Arbeitman MN, Furlong EE, Imam F, Johnson E, Null BH, Baker BS, Krasnow MA, Scott MP, Davis RW, White KP. Gene expression during the life cycle of Drosophila melanogaster. Science. 2002;297:2270–2275. doi: 10.1126/science.1072152. [DOI] [PubMed] [Google Scholar]
- 44.Britton JS, Lockwood WK, Li L, Cohen SM, Edgar BA. Drosophila's insulin/PI3-kinase pathway coordinates cellular metabolism with nutritional conditions. Dev Cell. 2002;2:239–249. doi: 10.1016/s1534-5807(02)00117-x. [DOI] [PubMed] [Google Scholar]
- 45.Xu T, Rubin GM. Analysis of genetic mosaics in developing and adult Drosophila tissues. Development. 1993;117:1223–1237. doi: 10.1242/dev.117.4.1223. [DOI] [PubMed] [Google Scholar]
Associated Data
This section collects any data citations, data availability statements, or supplementary materials included in this article.