Abstract
In human ganglia latently infected with varicella-zoster virus (VZV), sequence analysis has revealed that five viral genes (VZV genes 21, 29, 62, 63, and 66) are transcribed. However, their comparative prevalence and abundance are unknown. Here, using real-time PCR, we analyzed 28 trigeminal ganglia from 14 humans for RNA corresponding to the five virus genes known to be transcribed in latently infected human ganglia. The most prevalent transcript found was VZV gene 63 (78%), followed by gene 66 (43%), gene 62 (36%), and gene 29 (21%). No gene 21 transcripts were detected in any of the 28 ganglia. VZV gene 63 RNA was also the most abundant (3,710 ± 6,895 copies per 1 μg of mRNA) transcript detected in latently infected human ganglia, followed by VZV gene 29 (491 ± 594), VZV gene 66 (117 ± 85), and VZV gene 62 (64 ± 38). Thus, the repeated detection and high abundance of VZV gene 63 transcripts in latently infected ganglia suggests that VZV gene 63 may be more important for the maintenance of virus latency than the less abundantly transcribed and randomly detected VZV genes 21, 29, 62, and 66.
Varicella-zoster virus (VZV; human herpesvirus type 3) typically causes childhood chickenpox (varicella) and becomes latent in the cranial nerve, dorsal root, and autonomic ganglia along the entire human neuraxis (13). Various studies to determine the extent of VZV transcription in latently infected human ganglia have yielded different results. In situ hybridization (ISH) using gene-specific oligonucleotide probes detected transcripts from VZV genes 4, 18, 21, 29, 40, 62, and 63 but not genes 28 or 61 (14, 15). However, using sequence analysis, specifically the location of the 3′ terminus and presence of 3′-polyandeylate tracts in cDNA synthesized from RNA extracted from latently infected human ganglia, we detected transcripts mapping only to VZV genes 21, 29, 62, 63, and 66 but not to VZV genes 4, 10, 40, 51, or 61 (4, 9). Developing hypotheses by which VZV genes function to maintain virus latency first requires a determination of their relative prevalence and abundance (7). Here, using real-time PCR, we analyzed 28 trigeminal ganglia from 14 humans for RNA corresponding to the five virus genes shown by sequence analysis to be transcribed in latently infected human ganglia. Quantitative analysis of VZV-specific transcripts in human ganglia was compared to transcript abundance in productively infected cells in tissue culture.
MATERIALS AND METHODS
Cells, virus, and VZV DNA.
VZV with a DNA sequence similar to that of the Dumas strain, accession number NC_001348, was isolated from a zoster patient and propagated by cocultivating virus-infected MeWo melanoma cells with uninfected cells at a ratio of 1:100 (6) in Dulbecco modified Eagle medium supplemented with 9% heat-inactivated fetal bovine serum. Infected cells (4 × 10⁸) were harvested at the height of cytopathology (3 days postinfection), scraped into tissue culture fluid, collected by low-speed centrifugation, and quick-frozen in liquid nitrogen. VZV DNA was extracted from viral nucleocapsids as described previously (12), dissolved in TE (10 mM Tris-HCl, 1 mM EDTA [pH 8.0]), quantitated based on the optical density at 260 nm, digested with EcoRI, and resolved on 0.8% agarose gels to verify DNA purity. VZV DNA was diluted from 10,000 to one copy of virus DNA in 100 ng of herring sperm DNA.
Human tissue.
Both the left and the right trigeminal ganglia (TG) and brain were removed from subjects who were not immunocompromised before death and who, at autopsy, did not exhibit cutaneous signs of recent herpesvirus infection. Table 1 lists the clinical features of the subjects from whom TG or brain (approximately 5 cm3 of frontal lobe containing both gray and white matter) were removed. Nerve roots were cleaned, flash-frozen in liquid nitrogen and stored at −70°C until individually powdered in liquid nitrogen.
TABLE 1.
Clinical features of humans from whom ganglia or brains were removed
| Subject | Age (sex) | Cause of death | Time (h) between death and autopsy | Tissue obtained |
|---|---|---|---|---|
| 1 | 61 (F) | Surgery (hemorrhage) | 23.5 | TG |
| 2 | 36 (F) | Drug/alcohol-induced hepatic failure | 18 | TG |
| 3 | 80 (M) | Pneumonia | 23 | TG |
| 4 | 38 (F) | Congestive heart failure | 13 | TG |
| 5 | 45 (F) | Metastatic breast cancer | 27 | TG |
| 6 | 39 (F) | Subarachnoid hemorrhage | 50 | TG |
| 7 | 71 (M) | Myocardial infarction | 45 | TG |
| 8 | 54 (M) | Myocardial infarction | 15 | TG |
| 9 | 23 (M) | Sepsis | 27 | TG |
| 10 | 55 (F) | Renal failure | 29 | TG |
| 11 | 77 (M) | Myocardial infarction | 24 | TG |
| 12 | 85 (F) | Myocardial infarction | 12 | TG |
| 13 | 90 (F) | Alzheimers/Parkinsons | <24 | TG |
| 14 | 33 (M) | Stevens-Johnson syndrome | 21 | TG |
| 15 | 85 (F) | Myocardial infarction | 12 | Brain |
| 16 | 54 (M) | Myocardial infarction | 15 | Brain |
RNA extraction and cDNA synthesis.
Powdered tissue samples or pellets of VZV-infected cells were thawed in Tri-reagent (Molecular Research Center, Cincinnati, OH) and disrupted on ice by sonication, and total RNA was extracted as described previously (2). Poly(A)+ RNA was extracted by batch-affinity chromatography on oligo(dT) cellulose (NecleoTrap; Clontech, Palo Alto, CA) as described previously (10). Aliquots (1.5 μl) of poly(A)-containing RNA were used for quantitation (Nanodrop Technologies, Wilmington, DE), and 5 μl of total RNA from representative samples was analyzed for RNA integrity by microfiltration on Bioanalyzer chips (Agilent Technologies; Quantum Analytics, Inc., Foster City, CA).
cDNA was synthesized from 100 ng of total or poly(A)-containing RNA. RNA in 12 μl of water was added to 8 μl of 2.5× RT buffer (1× RT buffer is composed of 50 mM Tris-HCl [pH 8.5], 30 mM KCl, 8 mM MgCl2, 20 U of RNase inhibitor, 0.5 mM concentrations of each deoxynucleoside triphosphate, and 10 μM oligo-d[T18]). Each complete cDNA reaction was spiked with either 1 μl of reverse transcriptase (20 U/μl; Transcriptor; Roche Diagnostics, Mannheim, Germany) or 1 μl of sterile water. The 20-μl reaction mixtures in sealed 96-well microtiter plates were vortexed briefly and centrifuged at 1,000 × g for 2 min, followed by incubation at 25°C for 10 min, 50°C for 60 min, 85°C for 5 min, and 4°C for 20 min.
Real-time PCR (fluorescence-based simultaneous amplification and product detection) and data analysis.
Reactions were performed in a 20-μl volume of 1× qPCR Mastermix (VWR, West Chester, PA) containing 900 nM concentrations of each primer, 250 nM probe, and 7 to 20% of each cDNA sample using the 7500-Fast real-time PCR system (Applied Biosystems, Foster City, CA). Amplification conditions consisted of initial denaturation at 95°C for 10 min, followed by 40 two-step cycles of 15 s at 95°C and 1 min at 60°C. Fluorescence resulting from probe degradation was recorded during the 60°C extension cycle and analyzed using the SDS program (Sequence Detection Software; Applied Biosystems). The SDS-determined cycle threshold (CT) is defined as the cycle at which the fluorescence value intersects the threshold value, where the threshold value is set at 10-fold above the background fluorescence and is within the logarithmic phase of PCR amplification. VZV DNA standards were included in each real-time assay and yielded a consistent inverse relationship between the CT value and the amount of input template DNA. Linear regression analysis was performed by using SigmaPlot (Systat, Point Richmond, CA). Table 2 lists the TaqMan primer and probe sequences used (Integrated DNA Technologies, Coralville, IA). Each sample was analyzed in duplicate. Glyceraldehyde-3-phosphate dehydrogenase (GAPDH; accession number BC_013310) was used as a cellular transcriptional control, whereas neurofilament heavy subunit (NFH-200; accession number NM_021076) was used as a neuron-specific transcriptional control (1). Residual cellular or viral DNA present in RNA samples was quantitated by PCR analysis of the RNA. In most samples, no residual DNA was detected, and the CT value was set at the final cycle number. Where residual DNA was detected (CT < 40), a modified two-tailed t test was used to analyze the results. For each sample containing residual DNA, the mean and standard deviation of DNA and cDNA copies were determined. In each assay, the mean copy number was three times greater than the largest standard deviation, assuring the significance of the cDNA copy number.
TABLE 2.
TaqMan primers and probes
| Primer or probe | Accession no. | Sequence (5′-3′) | 5′ location |
|---|---|---|---|
| Gene 21-forward | X04370 | TGTTGGCATTGCCGTTGA | 32816 |
| Gene 21-probe | CTGCTTCCCCAGCACGTCCGTC | 32835 | |
| Gene 21-reverse | ATAGAAGGACGGTCAGGAACCA | 32881 | |
| Gene 29-forward | GGCGGAACTTTCGTAACCAA | 52952 | |
| Gene 29-probe | TCCAACCTGTTTTGCGGCGGC | 52973 | |
| Gene 29-reverse | CCCCATTAAACAGGTCAACAAAA | 53017 | |
| Gene 62-forward | CCTTGGAAACCACATGATCGT | 106985 | |
| Gene 62-probe | TGCAACCCGGGCGTCCG | 107007 | |
| Gene 62-reverse | AGCAGAAGCCTCCTCGACAA | 107063 | |
| Gene 63-forward | GCTTACGCGCTACTTTAATGGAA | 110939 | |
| Gene 63-probe | TGTCCCATCGACCCCCTCGG | 110963 | |
| Gene 63-reverse | GCCTCAATGAACCCGTCTTC | 111005 | |
| Gene 66-forward | CCACGTTACCGAACAGATTTATACTG | 113520 | |
| Gene 66-probe | TGGACATATGGAGTGCCGGGATTGTA | 113550 | |
| Gene 66-reverse | CTAGCTGCAAAGCGCAACCTCCCC | 113602 | |
| GAPDH-forward | BC013310 | CACATGGCCTCCAAGGAGTAA | 1048 |
| GAPDH-probe | CTGGACCACCAGCCCCAGCAAG | 1074 | |
| GAPDH-reverse | TGAGGGTCTCTCTCTTCCTCTTGT | 1122 | |
| NFH200-forward | NM_021076 | CCCCAGGCGATGGACAA | 3303 |
| NFH 200-probe | TATGATAGCTTATGTAGCTGAAT | 3321 | |
| NFH 200-reverse | TGGCATTCGGCATGTATCA | 3363 |
RESULTS
Efficiency of real-time VZV DNA quantitation.
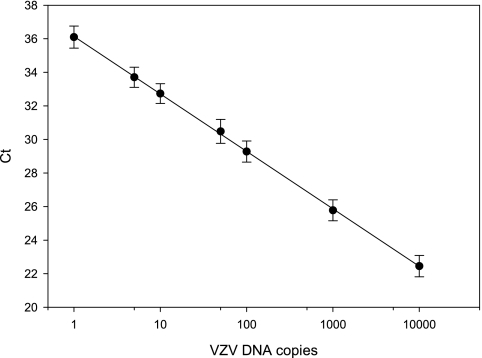
To demonstrate the validity and sensitivity of quantitation, replicate copies of VZV DNA (1 to 10,000 genome equivalents in 100 ng of carrier DNA) were amplified with primer or probe sets corresponding to each VZV gene, and the individual CT values were recorded and pooled to generate a single linear regression line (R2 = 0.95). The dynamic linear range for all primer or probe sets was from 1 to 10,000 copies of VZV DNA. Figure 1 shows that the VZV gene 21, 29, 62, 63, and 66 primer sets are equally sensitive.
FIG. 1.
Efficiency of VZV DNA quantitation. VZV DNA diluted at 1 to 10,000 copies was mixed with 100 ng of herring sperm DNA and amplified in duplicate using TaqMan primers specific for VZV genes 21, 29, 62, 63, and 66. Each primer set amplified 1 to 10,000 copies of VZV DNA with similar efficiency (R2 = 0.95). The data represent average CT values obtained with various VZV DNA copy numbers for all genes.
Quantitation of VZV transcripts in VZV-infected MeWo cells.
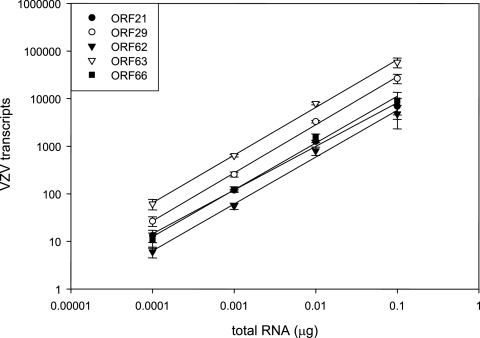
Total RNA (0.1 to 100 ng) extracted from VZV-infected cells was analyzed by quantitative PCR for VZV gene 21, 29, 62, 63, and 66 transcripts and spiked at each dilution with uninfected cell RNA to yield 100 ng before reverse transcription. The similar average slope for each linear regression line (0.97 ± 0.03) (Fig. 2) indicates that reverse transcription and subsequent PCR analysis for each primer or probe set were equally efficient. Moreover, correlation coefficients were identical (R2 = 0.99 ± 0.00), indicating the lack of inhibition of cDNA synthesis or PCR in all samples tested.
FIG. 2.
Quantitative PCR analysis of VZV transcripts in VZV-infected MeWo cells. Duplicate dilutions of total RNA from VZV-infected cells were reverse transcribed, and cDNAs corresponding to VZV genes 21, 29, 62, 63, and 66 were quantitated. The regression line slopes were similar in all cases (0.97 ± 0.03).
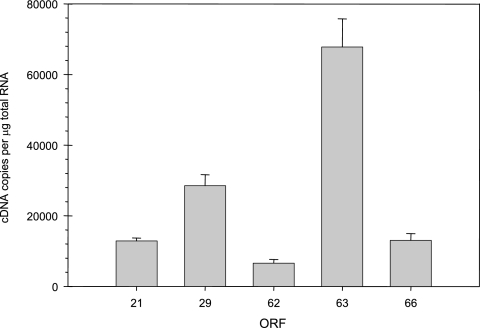
Quantitation of cDNAs for VZV genes 21, 29, 62, 63, and 66 from total RNA extracted from VZV-infected cells (Fig. 3) revealed 12,836 ± 850 (gene 21), 28,486 ± 3141 (gene 29), 6,576 ± 1,036 (gene 62), 67,761 ± 7,995 (gene 63), and 13,035 ± 1,919 (gene 66) transcripts per μg of total VZV-infected cell RNA.
FIG. 3.
Abundance of VZV transcripts in VZV-infected MeWo cells. Total RNA extracted from VZV-infected cells was diluted and reverse transcribed, and the number of cDNAs corresponding to VZV genes 21, 29, 62, 63, and 66 was quantitated and normalized to 1 μg of input RNA.
Integrity of RNA extracted from human TG.
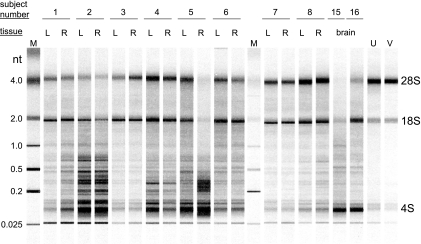
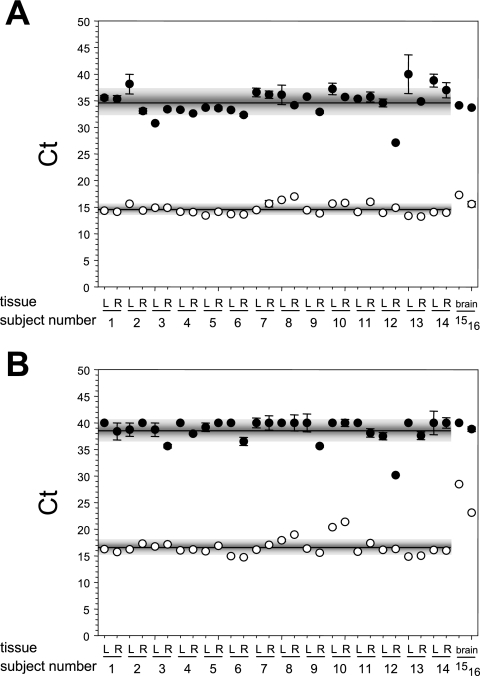
Total RNA from individual TG removed 25.1 ± 10.8 h after the death of subjects showed various degrees of degradation from minimal (subjects 3, 7, and 8) to extensive (subject 5, TG-R) compared to the total RNA extracted from uninfected (U) or VZV-infected (V) MeWo cells; RNA from the brain of subject 15 was extensively degraded (Fig. 4). To reduce the amount of ribosomal and degraded mRNA, poly(A)-containing RNA was selected from total RNA by affinity chromatography on oligo(dT) agarose beads. The average GAPDH-dependent CT values obtained for each TG cDNA sample in the absence or presence of reverse transcriptase during the cDNA synthesis reaction was 34.8 ± 2.5 and 14.6 ± 1.0, respectively (Fig. 5A). The difference in the average CT values indicates the presence of 1.2 × 10⁶-fold more GAPDH mRNA than residual chromosomal GAPDH DNA. Similarly, the average NFH-200-dependent CT values obtained for each TG cDNA sample were 38.7 ± 2.1 and 16.6 ± 1.5 in the absence and presence of reverse transcriptase, respectively (Fig. 5B), indicating 4.5 × 10⁶-fold more NFH-200 mRNA than residual genomic NFH-200 DNA sequences. In the two brain-derived poly(A)+ RNA samples (subjects 15 and 16), the abundance of GAPDH mRNA was similar to the amount of GAPDH transcripts in TG-derived mRNA (Fig. 5A), but the brain samples contained significantly less NFH-200 transcript than TG-derived mRNA (Fig. 5B). Thus, even in samples that did not contain distinct bands of 28S and 18S RNA, the quality of mRNA was sufficient for analysis by real-time cDNA PCR.
FIG. 4.
Integrity of RNA extracted from human ganglia. Total RNA extracted from the left (L) and right (R) TG from subjects 1 to 8, the brains from subjects 15 and 16, and from uninfected (U) and VZV-infected (V) MeWo cells was resolved by microfiltration. Distinct 28S and 18S rRNA bands are seen throughout except in samples from subjects 5 and 15. M, molecular weight markers.
FIG. 5.
Real-time PCR analysis of human ganglia and brain for cell transcripts. mRNA (•) and cDNA (○) from the left and right TG of subjects 1 to 14 and the brains from subjects 15 and 16 were amplified with GAPDH-specific primers DNA (A) or neurofilament heavy 200-kDa protein-specific DNA (B), and the CT values were determined.
VZV transcripts in human TG.
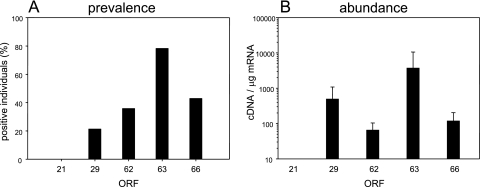
VZV gene 21 transcripts were not detected in any of the 28 TG samples, whereas VZV gene 29 transcripts were detected in 5 TG (range, 100 to 1,600 copies per μg of input mRNA), VZV gene 62 transcripts were detected in 6 TG (range, 25 to 130 copies per μg of input mRNA), VZV gene 63 transcripts were detected in 17 TG (range, 80 to >29,000 copies per μg of input mRNA), and VZV gene 66 transcripts were detected in 6 TG (range, 21 to 280 copies per μg of input mRNA) (Table 3) . Thus, VZV gene 63 transcripts are present in 78% of the 14 subjects, gene 66 transcripts are present in 42.9%, gene 62 transcripts are present in 35.7%, and gene 29 transcripts are present in 21.4% (Fig. 6A). The average abundances of the transcripts were 3,710 ± 6,895, 491 ± 594, 117 ± 85, and 64 ± 38 for genes 63, 29, 66, and 62, respectively (Fig. 6B).
TABLE 3.
VZV cDNA copies per microgram of human TG mRNA
| Subject | Tissuea | Mean VZV cDNA copies per μg of human TG mRNA
|
|||||||||
|---|---|---|---|---|---|---|---|---|---|---|---|
| Gene 21
|
Gene 29
|
Gene 62
|
Gene 63
|
Gene 66
|
|||||||
| Mean | SEM | Mean | SEM | Mean | SEM | Mean | SE | Mean | SEM | ||
| 1 | TG-L | 0.0 | 0.0 | 0.0 | 0.0 | 0.0 | 0.0 | 0.0 | 0.0 | 0.0 | 0.0 |
| TG-R | 0.0 | 0.0 | 0.0 | 0.0 | 54.2 | 44.8 | 192.8 | 181.6 | 57.5 | 12.3 | |
| 2 | TG-L | 0.0 | 0.0 | 0.0 | 0.0 | 0.0 | 0.0 | 755.2 | 85.9 | 21.4 | 9.1 |
| TG-R | 0.0 | 0.0 | 0.0 | 0.0 | 0.0 | 0.0 | 510.3 | 29.7 | 0.0 | 0.0 | |
| 3 | TG-L | 0.0 | 0.0 | 0.0 | 0.0 | 0.0 | 0.0 | 0.0 | 0.0 | 0.0 | 0.0 |
| TG-R | 0.0 | 0.0 | 0.0 | 0.0 | 0.0 | 0.0 | 0.0 | 0.0 | 0.0 | 0.0 | |
| 4 | TG-L | 0.0 | 0.0 | 0.0 | 0.0 | 0.0 | 0.0 | 6,932.3 | 988.0 | 280.8 | 32.4 |
| TG-R | 0.0 | 0.0 | 1,666.3 | 203.3 | 0.0 | 0.0 | 29,172.6 | 3,934.8 | 0.0 | 0.0 | |
| 5 | TG-L | 0.0 | 0.0 | 293.5 | 49.3 | 129.5 | 97.1 | 8,478.5 | 282.3 | 0.0 | 0.0 |
| TG-R | 0.0 | 0.0 | 97.6 | 40.1 | 0.0 | 0.0 | 3,613.5 | 861.3 | 144.3 | 98.7 | |
| 6 | TG-L | 0.0 | 0.0 | 93.6 | 45.9 | 107.0 | 52.8 | 6,513.8 | 891.4 | 0.0 | 0.0 |
| TG-R | 0.0 | 0.0 | 307.8 | 82.8 | 25.2 | 4.3 | 3,579.3 | 384.3 | 141.5 | 24.5 | |
| 7 | TG-L | 0.0 | 0.0 | 0.0 | 0.0 | 0.0 | 0.0 | 0.0 | 0.0 | 0.0 | 0.0 |
| TG-R | 0.0 | 0.0 | 0.0 | 0.0 | 0.0 | 0.0 | 448.3 | 74.4 | 0.0 | 0.0 | |
| 8 | TG-L | 0.0 | 0.0 | 0.0 | 0.0 | 0.0 | 0.0 | 0.0 | 0.0 | 0.0 | 0.0 |
| TG-R | 0.0 | 0.0 | 0.0 | 0.0 | 100.4 | 22.7 | 0.0 | 0.0 | 0.0 | 0.0 | |
| 9 | TG-L | 0.0 | 0.0 | 0.0 | 0.0 | 0.0 | 0.0 | 0.0 | 0.0 | 0.0 | 0.0 |
| TG-R | 0.0 | 0.0 | 0.0 | 0.0 | 0.0 | 0.0 | 0.0 | 0.0 | 0.0 | 0.0 | |
| 10 | TG-L | 0.0 | 0.0 | 0.0 | 0.0 | 0.0 | 0.0 | 135.9 | 112.4 | 0.0 | 0.0 |
| TG-R | 0.0 | 0.0 | 0.0 | 0.0 | 0.0 | 0.0 | 159.1 | 13.1 | 0.0 | 0.0 | |
| 11 | TG-L | 0.0 | 0.0 | 0.0 | 0.0 | 0.0 | 0.0 | 911.6 | 150.4 | 62.2 | 1.7 |
| TG-R | 0.0 | 0.0 | 0.0 | 0.0 | 36.2 | 0.6 | 647.3 | 185.6 | 0.0 | 0.0 | |
| 12 | TG-L | 0.0 | 0.0 | 0.0 | 0.0 | 0.0 | 0.0 | 824.4 | 64.4 | 0.0 | 0.0 |
| TG-R | 0.0 | 0.0 | 0.0 | 0.0 | 0.0 | 0.0 | 0.0 | 0.0 | 0.0 | 0.0 | |
| 13 | TG-L | 0.0 | 0.0 | 0.0 | 0.0 | 0.0 | 0.0 | 80.8 | 3.7 | 0.0 | 0.0 |
| TG-R | 0.0 | 0.0 | 0.0 | 0.0 | 0.0 | 0.0 | 0.0 | 0.0 | 0.0 | 0.0 | |
| 14 | TG-L | 0.0 | 0.0 | 0.0 | 0.0 | 0.0 | 0.0 | 0.0 | 0.0 | 0.0 | 0.0 |
| TG-R | 0.0 | 0.0 | 0.0 | 0.0 | 0.0 | 0.0 | 120.1 | 32.4 | 0.0 | 0.0 | |
| 15 | NHB | 0.0 | 0.0 | 0.0 | 0.0 | 0.0 | 0.0 | 0.0 | 0.0 | 0.0 | 0.0 |
| 16 | NHB | 0.0 | 0.0 | 0.0 | 0.0 | 0.0 | 0.0 | 0.0 | 0.0 | 0.0 | 0.0 |
TG-L, left trigeminal ganglion. TG-R, right trigeminal ganglion.
FIG. 6.
Prevalence (A) and abundance (B) of VZV transcripts in latently infected human TG. The left and right TG of 14 individuals were examined for the presence of transcripts corresponding to VZV genes 21, 29, 62, 63, and 66. For the prevalence data, VZV gene 63 transcripts were the most frequently detected, followed by gene 66, gene 62, and gene 29; no gene 21 transcripts were detected in any of the subjects. The average abundance (panel B) of transcripts in each positive TG normalized to 1 μg of input mRNA was highest for open reading frame (ORF) 63, followed by gene 29, gene 66, and gene 62.
The abundance of VZV gene 21, 29, 62, 63, and 66 transcripts in individual TG is shown in Fig. 7. To compare the extent of transcription of each VZV gene, VZV transcripts were plotted as a percentage of the maximum transcript. For example, for the right TG from subject 1, the number of VZV gene 63 transcripts was set at 100% and the abundances of VZV gene 62 and 66 transcripts compared to VZV gene 63 transcription were 28.1 and 29.8%, respectively. Similarly, for the remaining 16 of 17 individual TG samples in which VZV 63 transcripts were the most abundant (and thus set to 100%), the numbers of VZV gene 29, 62, and 66 transcripts were below 10%. The right TG from subject 8 in which only VZV gene 62 transcripts were detected by quantitative PCR is the single exception to the general finding that VZV gene 63 is the most abundant transcript detected.
FIG. 7.
Relative abundance of VZV gene 21, 29, 62, 63, and 66 transcripts in individual trigeminal ganglion. The 18 TG that were found to contain VZV gene 29, 62, 63, or 66 transcripts were selected for further analysis. For each TG the number of transcripts mapping to each VZV gene was compared to that of the most abundant virus gene. Thus, for 16 of the 17 individual ganglia in which VZV gene 63 transcripts were the most abundant, the number of VZV gene 29, 62, and 66 transcripts is <10% the number of VZV gene 63 transcripts. ORF, open reading frame.
DISCUSSION
The present real-time PCR analysis of human TG demonstrated that VZV gene 63 transcripts were the most frequently detected, followed by transcripts corresponding to gene 66, gene 62, and gene 29. No gene 21 transcripts were detected in any of the 14 subjects. In the only previous report in which both the prevalence and abundance of multiple VZV gene transcripts were determined from the same individual TG samples (5), VZV gene 63 transcripts were detected in either or both TG from all of 11 (100%) subjects, VZV 29 transcripts were detected in 2 of 11 (18%), and VZV gene 21 transcripts were detected in 4 of 11 (36%) subjects. Compared to VZV gene 21 transcripts, VZV gene 63 and 29 transcripts were 22- and 26-fold more abundant. Thus, our present findings, which analyzed VZV gene 62 and 66 transcription in addition to VZV genes 21, 29, and 63, extended the previous quantitative report (5), confirmed that VZV gene 63 is the most prevalent and abundant transcript, and revealed that VZV gene 29 transcripts are detected more often than VZV gene 21 transcripts. Finally, despite the use of PCR primers and probe identical to those used earlier, VZV gene 21 transcripts were not found in the present study (5).
An ISH-based study found transcripts corresponding to three additional VZV genes in latently infected human ganglia. Kennedy et al. (15) reported VZV gene 4 transcripts in ganglia from 3 of 13 (23%) subjects, VZV gene 18 transcripts in 4 of 15 (27%) subjects, and VZV gene 40 transcripts in 1 of 5 (20%) subjects. Although ISH can detect minute amounts of transcript as well as its cellular location, this technique depends on investigator interpretation of a signal produced by grains on cells. Our sequence analysis did not find transcripts corresponding to VZV genes 4 or 40 (5); thus, future studies will continue to search for those transcripts as well as for VZV gene 18 transcripts.
A possible explanation for our lack of detection of VZV gene 21 transcripts is provided by quantitative data for each individual ganglion shown in Fig. 7. In most TG analyzed, the amount of VZV gene 29, 62, and 66 transcripts relative to those of VZV gene 63 was <10%. Also, among the ganglia that contained VZV gene 63 transcripts, the detection of VZV gene 29, 62, and 66 transcripts appeared random. For example, in addition to VZV gene 63 transcripts, three ganglia also contained VZV gene 66 transcripts, two also contained VZV gene 29 and 62 transcripts, one also contained VZV gene 62 and 66 transcripts, one also contained VZV gene 29 and 66 transcripts, one also contained VZV gene 29, 62, and 66 transcripts, one also contained VZV gene 29 transcripts, and one also contained VZV gene 62 transcripts, whereas seven contained only VZV gene 63 transcripts. Thus, there seems to be two sets of latent VZV gene transcripts. The first contains only the abundant VZV gene 63 transcript. The second contains low-abundance VZV gene 29, 62, and 66 transcripts. It is possible that previously detected VZV gene 21 transcripts (3, 4, 5, 15) lie within the class of low abundance latent VZV transcripts. An alternative interpretation is that VZV gene 63 is always transcribed during latency, whereas VZV genes 21, 29, 62, and 66 are transcribed in cells undergoing early stages of virus reactivation. For example, spontaneous reactivation of latent herpes simplex virus type 1 has been reported in the TG of latently infected mice (11), which results in an unexpected pattern of herpes simplex virus type 1 gene expression (17, 18). This hypothesis is consistent with low-frequency spontaneous reactivation of virus, which results in the transcription of VZV genes 62, 66, 29, and/or 21.
The relative abundance (in decreasing order) of VZV genes 63, 29, 21, and 66 transcripts in VZV-infected cells determined by quantitative PCR (Fig. 3) is consistent with results of transcriptional array analysis of VZV (strain Ellen)-infected monkey kidney (BSC-1) cells in culture (8). The lower abundance of VZV gene 62 transcripts determined by quantitative PCR than that found by transcriptional array analysis could reflect a difference in virus strain (Dumas-like versus Ellen) or cell type (MeWo versus BSC-1). Alternatively, the slight discrepancy could be attributed to a 3′ bias observed in cDNA when synthesis is primed with oligo(dT). To test this assertion, poly(A)+ RNA extracted from VZV-infected MeWo cells was primed with either oligo(dT) or a mixture of oligo(dT) and random hexanucleotides, and the VZV gene 62 transcripts were analyzed by transcriptional array analysis or quantitative PCR. Array analysis demonstrated that when cDNA synthesis was primed with oligo(dT), only 17% of VZV gene 62 cDNA extended to the 5′ terminus. However, when cDNA synthesis was primed with a mixture of oligo(dT) and random hexanucleotides, the amount of full-length VZV gene 62 transcripts increased to 44%. Under the same cDNA synthesis conditions, the TaqMan primers or probe used here showed only a modest difference in the amount of VZV gene 62 copies present when the synthesis was primed with oligo(dT) (1.7 ± 0.2 × 10⁸ copies) compared to the number of VZV gene 62 copies present when synthesis was primed with the oligo(dT) and random primers mixture (3.1 ± 0.03 × 10⁸ copies) (data not shown).
Long oligonucleotide-based microarrays were used to determine the transcriptional pattern of VZV (strain Dumas) in virus-infected MeWo cells (16). The relative abundance (in decreasing order) of VZV genes 29, 21, 66, and 62 is consistent with our current quantitative PCR analysis of VZV-infected MeWo cells. The major discrepancy between the long oligonucleotide-based array analysis and the current quantitative PCR analysis is the relative abundance of VZV gene 63 transcripts. While Kennedy et al. (16) found the amount of VZV gene 63 transcripts to be between that of VZV genes 66 and 62, our quantitative analysis found that the number of VZV gene 63 transcripts was higher. As was the case for VZV gene 62 transcripts analyzed by PCR-based arrays (8), the long-oligonucleotide array analysis also showed target gene bias (specifically VZV genes 62 and 63 [16]) with probe made from oligo(dT)-primed cDNA.
Finally, our analysis of the prevalence and abundance of VZV gene transcripts in latently infected human ganglia extends previous studies by analyzing transcripts from all sequence-verified, latently transcribed VZV genes. In addition, our quantitative analysis has identified two classes of latently transcribed VZV genes. The abundant class consists of only VZV gene 63 and the less abundant class consists of VZV genes 21, 29, 62, and 66. The repeated detection and high abundance of VZV gene 63 transcripts in latently infected ganglia suggests that VZV gene 63 may be more important for the maintenance of virus latency than the less abundantly transcribed and randomly detected VZV genes 21, 29, 62, and 66.
Acknowledgments
This study was supported in part by Public Health Service grants NS32623 (R.J.C. and D.H.G.) and AG06127 (D.H.G.) from the National Institutes of Health.
Footnotes
Published ahead of print on 27 December 2006.
REFERENCES
- 1.Cochard, P., and D. Paulin. 1984. Initial expression of neurofilaments and vimentin in the central and peripheral nervous system of the mouse embryo in vivo. J. Neurosci. 4:2080-2094. [DOI] [PMC free article] [PubMed] [Google Scholar]
- 2.Cohrs, R., R. Mahalingam, A. N. Dueland, W. Wolf, M. Wellish, and D. H. Gilden. 1992. Restricted transcription of varicella-zoster virus in latently infected human trigeminal and thoracic ganglia. J. Infect. Dis. 166(Suppl. 1):S24-S29. [DOI] [PubMed] [Google Scholar]
- 3.Cohrs, R. J., M. B. Barbour, R. Mahalingam, M. Wellish, and D. H. Gilden. 1995. Varicella-zoster virus (VZV) transcription during latency in human ganglia: prevalence of VZV gene 21 transcripts in latently infected human ganglia. J. Virol. 69:2674-2678. [DOI] [PMC free article] [PubMed] [Google Scholar]
- 4.Cohrs, R. J., M. Barbour, and D. H. Gilden. 1996. Varicella-zoster virus (VZV) transcription during latency in human ganglia: detection of transcripts mapping to genes 21, 29, 62, and 63 in a cDNA library enriched for VZV RNA. J. Virol. 70:2789-2796. [DOI] [PMC free article] [PubMed] [Google Scholar]
- 5.Cohrs, R. J., J. Randall, J. Smith, D. H. Gilden, C. Dabrowski, K. H. van Der, and R. Tal-Singer. 2000. Analysis of individual human trigeminal ganglia for latent herpes simplex virus type 1 and varicella-zoster virus nucleic acids using real-time PCR. J. Virol. 74:11464-11471. [DOI] [PMC free article] [PubMed] [Google Scholar]
- 6.Cohrs, R. J., J. Wischer, C. Essman, and D. H. Gilden. 2002. Characterization of varicella-zoster virus gene 21 and 29 proteins in infected cells. J. Virol. 76:7228-7238. [DOI] [PMC free article] [PubMed] [Google Scholar]
- 7.Cohrs, R. J., and D. H. Gilden. 2003. Varicella-zoster virus transcription in latently infected human ganglia. Anticancer Res. 23:2063-2069. [PubMed] [Google Scholar]
- 8.Cohrs, R. J., M. P. Hurley, and D. H. Gilden. 2003. Array analysis of viral gene transcription during lytic infection of cells in tissue culture with varicella-zoster virus. J. Virol. 77:11718-11732. [DOI] [PMC free article] [PubMed] [Google Scholar]
- 9.Cohrs, R. J., D. H. Gilden, P. R. Kinchington, E. Grinfeld, and P. G. Kennedy. 2003. Varicella-zoster virus gene 66 transcription and translation in latently infected human ganglia. J. Virol. 77:6660-6665. [DOI] [PMC free article] [PubMed] [Google Scholar]
- 10.Cohrs, R. J., D. H. Gilden, Y. Gomi, K. Yamanishi, and J. I. Cohen. 2006. Comparison of virus transcription during lytic infection of the Oka parental and vaccine strains of varicella-zoster virus. J. Virol. 80:2076-2082. [DOI] [PMC free article] [PubMed] [Google Scholar]
- 11.Feldman, L. T., A. R. Ellison, C. C. Voytek, L. Yang, P. Krause, and T. P. Margolis. 2002. Spontaneous molecular reactivation of herpes simplex virus type 1 latency in mice. Proc. Natl. Acad. Sci. USA 99:978-983. [DOI] [PMC free article] [PubMed] [Google Scholar]
- 12.Gilden, D. H., Y. Shtram, A. Friedmann, M. Wellish, M. Devlin, A. Cohen, N. Fraser, and Y. Becker. 1982. Extraction of cell-associated varicella-zoster virus DNA with Triton X-100-NaCl. J. Virol. Methods 4:263-275. [DOI] [PubMed] [Google Scholar]
- 13.Gilden, D. H., R. J. Cohrs, and R. Mahalingam. 2003. Clinical and molecular pathogenesis of varicella virus infection. Viral Immunol. 16:243-258. [DOI] [PubMed] [Google Scholar]
- 14.Kennedy, P. G., E. Grinfeld, and J. W. Gow. 1999. Latent varicella-zoster virus in human dorsal root ganglia. Virology 258:451-454. [DOI] [PubMed] [Google Scholar]
- 15.Kennedy, P. G., E. Grinfeld, and J. E. Bell. 2000. Varicella-zoster virus gene expression in latently infected and explanted human ganglia. J. Virol. 74:11893-11898. [DOI] [PMC free article] [PubMed] [Google Scholar]
- 16.Kennedy, P. G., E. Grinfeld, M. Craigon, K. Vierlinger, D. Roy, T. Forster, and P. Ghazal. 2005. Transcriptomal analysis of varicella-zoster virus infection using long oligonucleotide-based microarrays. J. Gen. Virol. 86:2673-2684. [DOI] [PubMed] [Google Scholar]
- 17.Kosz-Vnenchak, M., J. Jacobson, D. M. Coen, and D. M. Knipe. 1993. Evidence for a novel regulatory pathway for herpes simplex virus gene expression in trigeminal ganglion neurons. J. Virol. 67:5383-5393. [DOI] [PMC free article] [PubMed] [Google Scholar]
- 18.Tal-Singer, R., T. M. Lasner, W. Podrzucki, A. Skokotas, J. J. Leary, S. L. Berger, and N. W. Fraser. 1997. Gene expression during reactivation of herpes simplex virus type 1 from latency in the peripheral nervous system is different from that during lytic infection of tissue cultures. J. Virol. 71:5268-5276. [DOI] [PMC free article] [PubMed] [Google Scholar]


