

Abstract
Plasmodium falciparum erythrocyte membrane protein 1, which is encoded by the var multigene family, is expressed on the surface of P. falciparum–infected erythrocytes and has been implicated in many of the complications associated with falciparum malaria. Transcriptional switching of var is commonly investigated using in vitro cultured parasites, because parasite material from patients is limited. We investigated the affect of short-term in vitro cultivation on var gene transcription in patient samples. A significant reduction in the overall abundance of var transcripts was observed during the first ~10 days of culture. The rate of down-regulation was not constant among all var genes; genes with an upsA, -D, and -E 5′ flanking region had a significantly faster rate than genes with an upsB or -C flanking region. These results have significant implications for the investigation of associations between var transcription and clinical manifestations usingparasites that have been enriched by in vitro culture.
Malaria kills an estimated 3 million people annually, with most deaths occurring as a result of complications arising from Plasmodium falciparum infections. Cytoadherence of infected erythrocytes to the microvasculature lining of various organs and uninfected erythrocytes is thought to be responsible for some of the severe clinical pathologies [1–5]. This cytoadherence is mediated by P. falciparum erythrocyte membrane protein 1 (PfEMP1).
PfEMP1 is the product of the var multigene family, with each parasite having ~60 var genes [6–9]. Sequence analysis of the var gene repertoire of the 3D7 parasite line has shown that var genes fall into 5 distinct groups based on chromosomal location, gene orientation, and the 5′ flanking sequences, commonly called upsA, -B, -C, -D, and -E [8, 10, 11], with 2 intermediate groups (B/A and B/C) [12]. Although there is minimal overlap in the var gene repertoire between parasite isolates [9, 13], some of the specific structural features used to identify the groups appear to be highly conserved, as is the frequency distribution of the genes within the groups [14].
Several studies have investigated the association between severe malaria and PfEMP1 expression. Although there is a link between placental malaria and chondroitin sulfate A–binding PfEMP1 variants (reviewed in [15]), the association between PfEMP1 and other forms of severe malaria is less clear. There have been associations reported between cerebral malaria and PfEMP1 variants with molecular weights >260 kDa [16], between severe malaria and a particular var gene [17], and between noncerebral severe malaria and transcription of var genes lacking 1–2 cysteine residues [18]. By contrast, Kenyan patients failed to show any association between the transcription of var genes with specific sequence characteristics and disease severity [14].
One of the difficulties with investigating either var gene transcription or PfEMP1 expression in clinical samples is the limited amount of parasite material obtainable from a patient. As a result, it is common practice to culture ex vivo samples in vitro for short durations (<30 days), to increase the amount of parasite material. There has been no investigation reported about the effect that culturing may have on var gene transcription or PfEMP1 expression, although it was reported >20 years ago that in vitro cultivation influenced the binding characteristics of field isolates [19]. In the present study, we examined the composition and dynamics of var gene transcription during short-term in vitro culture initiated from ex vivo samples. Our data indicate a rapid overall decrease in the quantity of var gene transcripts. Importantly, the relative decrease in var gene transcription was not uniform across all genes.
MATERIALS AND METHODS
Samples
In a previous study, 2 volunteers were infected with P. falciparum strain 3D7 by mosquito bites [20]. Blood was collected 12.5 and 13.5 days after infection, when the volunteers were symptomatic and before curative treatment was administered. These samples, referred to as 3D7B1 and 3D7B2, were cryopreserved after white blood cells had been removed and stored. Ethics approval was granted by the Queensland Institute of Medical Research Human Research Ethics Committee for use of these stored samples.
Parasite culture
3D7B1 and 3D7B2 samples were thawed, added to medium that contained fresh uninfected erythrocytes at 3% hematocrit, and cultured. The cultures were maintained until parasitemia reached >0.5% (day 10 for 3D7B1 and day 6 for 3D7B2), after which a portion of the culture was harvested at regular intervals. Harvested material was stored at −80°C for future RNA isolation. In the present study, we analyzed the ex vivo uncultured sample (day 0) and 3 cultured samples (days 6 or 10, 12, and 16) for each volunteer. Parasites were predominantly in the ring stage at the time of harvest, although cultures were not synchronized before harvesting. Previous studies have indicated that both ring- and trophozoite-stage parasites are valid for investigating repertoires of var transcription [21, 22].
Total RNA was extracted directly from frozen samples using the NucleoSpin RNAII kit (Macherey-Nagel) in accordance with the manufacturer’s instructions. All samples were treated with DNase.
Real-time reverse-transcription polymerase chain reaction (RT-PCR) of the var transcripts.
Total RNA was reverse transcribed using SuperScript III RT (Invitrogen) and primed with random hexamer primers in accordance with the manufacturer’s instructions. Because the limited amount of RNA available in the samples prohibited testing of all 63 var genes, a set of 25 previously published and newly designed var-specific primer pairs was selected for testing (table 1) [23, 24]. For the uncultured day 0 samples, which contained the least RNA, a subset of 20 primers was used. The primers were selected on the basis of the profile of transcripts identified in the RT-PCR component of the study (see below). The stably transcribed housekeeping gene seryl-tRNA synthetase (PF07-0073) (s-tRNA syn) was amplified using a primer set reported elsewhere [23] and used as the endogenous control.
Table 1.
Primer and summary structure classifications for var genes analyzed.
| The table is available in its entirety in the online edition of the Journal of Infectious Diseases. |
Absolute quantitation based on standard curves generated from serial dilutions of 3D7 genomic DNA was used to determine the level of each transcript in each sample. Every real-time RT-PCR experiment included the s-tRNA syn primer (standard curve and unknown samples) to control for run to run variation.
Real-time RT-PCR was performed using a MX4000 (Stratagene), and all samples and controls were run in triplicate. The Absolute QPCR SYBR Green Mix (Abgene) was used in accordance with the manufacturer’s instructions under the following cycling conditions: 15 min at 95°C, followed by 40 cycles of 30 s at 94°C, 40 s at 53°C, and 50 s at 68°C. A dissociation curve thermal profile of the products was included after the amplification cycles; replicates showing primer dimer formation or spurious nonspecific peaks were excluded.
Design and testing of a universal real-time primer set
A primer pair (ALLVAR) was designed to amplify all 3D7 var gene transcripts. The commonly used αBR primer [25] was selected as the reverse primer and the forward primer (5′-AATT-AAGAGA[A/T][T/G][A/C]TTGGTGG-3′) was designed to the highly conserved central region of Duffy binding–like (DBL)–1α ~180–240 bp upstream of α BR. To assess the ability of the ALLVAR primer to amplify all var genes, real-time PCR was performed on serial dilutions of 3D7 DNA using the ALLVAR and s-tRNA syn primer sets. Pools of purified PCR fragments of randomly selected specific DBL1α types were also prepared and analyzed; 1 pool contained 10 specific types, and the others contained mixtures of 4 types.
RT-PCR, cloning, and sequencing of the DBL1α region
After total RNA was extracted, a 1-step RT-PCR was performed, and products were cloned into the PCR-Script vector and transformed into Escherichia coli as described elsewhere [21]. For each sample, ~50 inserts were sequenced and identified by alignment with fragments of 3D7 var genes described elsewhere [25].
Anti-PfEMP1 antibodies
Two anti-PfEMP1 antibodies were used to confirm that the parasites expressed the protein: a mouse monoclonal antibody against the conserved cytoplasmic region of PfEMP1 (anti-ATS; Dr. Brian Cooke, Monash University, Victoria, Australia), and a mouse polyclonal antibody directed against a 20-mer peptide from the variable region of DBL1α of PF11_0007 (anti-AFBR16; D.R.K., unpublished data).
Protein extraction and Western-blot analysis
3D7B1 and 3D7B2 were cultured for 21 days, sorbitol synchronized, and harvested at the late trophozoite/early schizont stages. Approximately 2 × 10⁷ infected and uninfected red blood cells were pelleted and protein extracted as described elsewhere [26]. The extracts were separated on a 5% SDS-PAGE and transferred onto nitrocellulose membranes. After blocking with Blotto (5% skim milk in PBS/0.05% Tween 20 [PBST]) for 1 h, the membrane was incubated for 1 h with anti-ATS (1:200) or anti-AFBR16 (1:1000) in Blotto at room temperature. After washing with PBST, the membranes were incubated with 1: 3000 horseradish peroxidase–conjugated goat anti–mouse IgG for 1 h at room temperature. Signals were developed using enhanced chemiluminescence (Amersham Bioscience) and captured on autoradiographic film.
Calculating parasite growth rates
The estimated quantities of s-tRNA syn in the ex vivo sample and the first culture harvest were used to estimate the parasite replication rate in each culture:
where m is the increase in parasite material per replication cycle (48 h) and s(day 0) and s(day i) are the amounts of s-tRNA syn transcript on days 0 and i, respectively.
Statistical analysis
For each gene examined in each sample and at each time point, the relative amount of transcript was normalized against the quantity of s-tRNA syn, and the relative change in transcription between time points was calculated. The relative change for different gene groupings was compared using either the Mann-Whitney U test (for comparing 2 groups) or the Kruskal-Wallis test (for >2 groups). When the Kruskal-Wallis test resulted in significant differences (P < .05), post hoc multiple comparisons were conducted [27].
To compare the rate of change in transcription between individual genes, a power regression model [ln(transcript quantity relative to s-tRNA syn) = b0 + b1 × ln (cycles in culture + 0.1)] was fitted to gene-specific transcript data from 4 time points. This model was determined to be the best fit for the majority of genes. Once all regression models were fitted, the slopes were compared, with multiple comparisons using Tukey’s test performed if significant differences were detected [28]. The association between the slopes of the regression line and the quantity of transcript on day 0 was assessed using Spearman’s rank correlation. All analyses were performed using the SPSS software package (version 13.0; SPSS).
RESULTS
Selection of specific var gene primers.
Preliminary analysis of the var gene transcription profile during in vitro cultivation using RT-PCR, combined with cloning and sequencing, identified 35 variants from a total of 406 sequenced inserts. The frequency of each variant ranged from 1 to 82 (data not shown). Because not all observed transcripts could be included in the real-time analysis, the most prevalent transcripts from each major var sequence group were selected (table 1). The 24 selected var transcripts represented 90.4% (367/406) of the observed sequenced inserts (3D7B1, 93.5% [186/199]; 3D7B2, 87.4% [181/207]). In addition, specific primers for PFL0030c were included because we had not previously observed this transcript when the αAF/αBR primers were used.
Measurement of var transcripts.
The overall level of var gene transcription was estimated using 2 indices. The first was the sum of the individual variant-specific quantities measured. The second index was transcript quantity estimated by amplification with the ALLVAR primer pair. This primer pair gave a 63-fold higher estimate of DNA quantity relative to the single-copy gene, s-tRNA syn, when 3D7 genomic DNA was used as a template. This result was consistent with the expected number of var genes in the 3D7 genome and remained constant over a dilution series. The ALLVAR primer pair was also able to reliably estimate the quantity of DNA in various sample pools consisting of a number of different var transcripts in known ratios (data not shown). The ALLVAR primer was not used on the uncultured day 0 samples because low concentrations of template resulted in primer-dimer interference masking the amplification of the samples.
Parasite growth and var transcription during culture adaptation.
The total transcript quantity detected when the 25 selected var primers were used was up to 94.7% of the transcript quantity detected when ALLVAR was used (table 2). The ratio of quantities gradually decreased over time in both B1 and B2 cultures. All primers tested on all samples returned positive results, with the exception of 6 primers tested on the 3D7B1 (day 0) sample.
Table 2.
Comparison of var gene transcription to the housekeeping gene seryl-tRNA synthetase (s-tRNA syn) during parasite adaptation to in vitro cultivation.
| 3D7B1 culture line
|
3D7B2 culture line
|
|||||||
|---|---|---|---|---|---|---|---|---|
| Days of in vitro culture | 0 | 10 | 12 | 16 | 0 | 6 | 12 | 16 |
| Ratio of the sum of specific var to s-tRNA syn | 29.9 | 1.9 | 0.7 | 1.2 | 33.7 | 4.9 | 2.5 | 2.3 |
| Ratio of ALLVAR to s-tRNA syn | ND | 2.0 | 0.8 | 1.5 | ND | 6.2 | 3.0 | 3.6 |
| Ratio of the sum of specific var to ALLVAR, % | ND | 94.7 | 86.9 | 78.9 | ND | 80.3 | 84.3 | 64.5 |
NOTE. ND, not done.
The quantity of transcript of s-tRNA syn increased during the first 10 days of culture. The estimated parasite multiplication rate, based on changes in the quantity of measured s-tRNA syn transcript, was 7.9/parasite replication cycle over the first 10 days for 3D7B1 and 12.3/parasite replication cycle during the first 6 days for 3D7B2. Relative to s-tRNA syn, the overall quantity of var transcript decreased dramatically in both parasite samples during culture adaptation, irrespective of which measure of total var quantity was used (table 2). The largest decreases in both culture lines occurred between days 0 and the first harvest—that is, day 10 for 3D7B1 and day 6 for 3D7B2.
Individual var transcription during culture adaptation.
In both the 3D7B1 and 3D7B2 lines, the absolute quantity of individual var transcripts decreased between day 0 and the first harvest for all genes examined except one (PFD1005c in 3D7B2) (figure 1); however, the magnitude of the decrease was not constant across all genes (figures 1 and 2). For 3D7B1, the genes classed as group A, D, and E (table 1) had a larger reduction in transcription between days 0 and 10, compared with genes classed as B, B/C, or C (P = .04). No significant difference in the transcriptional changes between gene groups was detected between other time points for this culture line (P >.25). For 3D7B2, significant differences between gene groups were detected between days 0 and 6 and days 6 and 12 (P < .04) but not between days 12 and 16 (P = .8). Between days 0 and 6, the group A, D, and E genes had a larger decrease in transcription than group B/C and C genes, and group A genes also had a significantly larger decrease than group B genes (P < .05). The comparison between days 6 and 12 indicated that group B var genes had the largest decrease, and it was significantly more than either the group A or C genes (P < .05). Combined, these data indicate significant differences in the relative reduction in transcription based on the sequence characteristics, location, and/or orientation of the genes. Identical results were obtained when genes were grouped according to other structural features: genes with a DBL–γ domain had a larger decrease in transcription between days 0 and 10 in the 3D7B1 culture and between days 0 and 6 and 6 and 12 in the 3D7B2 culture than genes without a DBL-γ domain (P < .05), and genes with 2 or 3 cysteine residues in the cysteine-rich, C-terminal region of DBL1α had significantly larger decreases in transcription between days 0 and 10 (3D7B1) or days 0 and 6 (3D7B2) than genes with 4 cysteine residues (P < .04).
Figure 1.
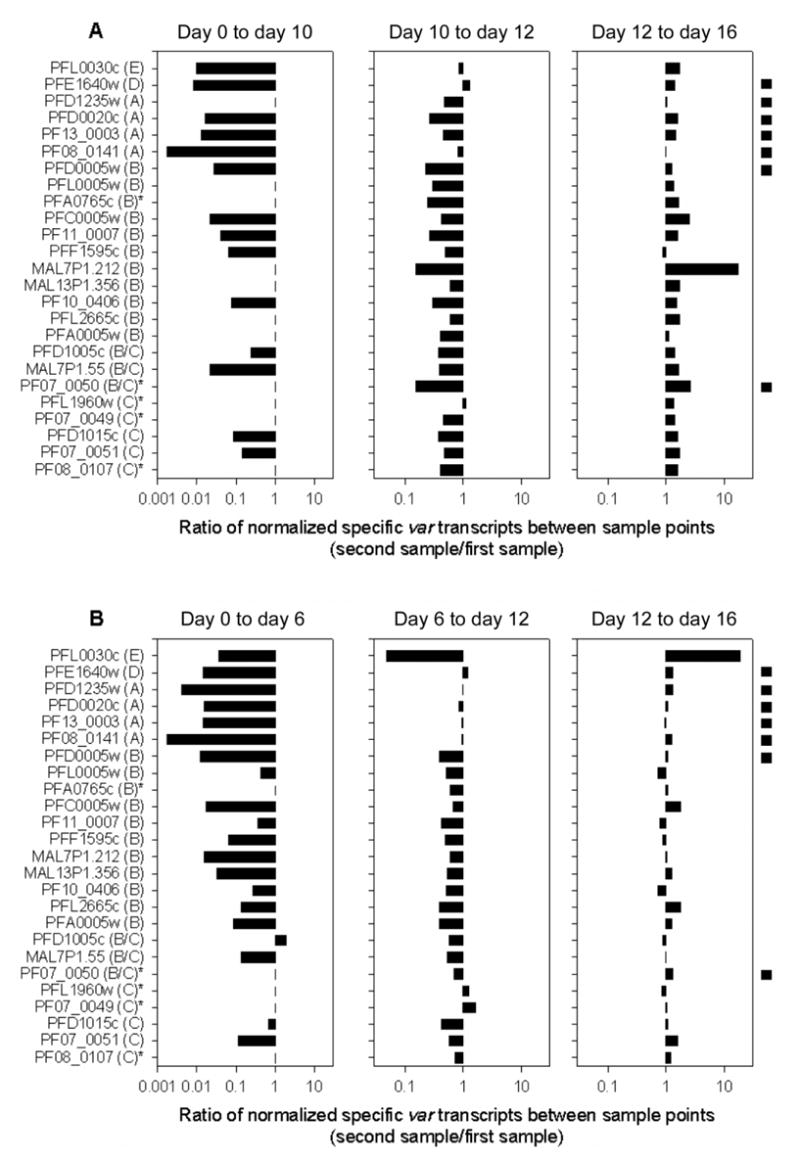
Change in transcript abundance of individual var genes between sample points for 3D7B1 (A) and 3D7B2 (B). Transcript quantities were normalized against the quantity of seryl-tRNA synthetase transcript before ratios were calculated. Transcripts are identified by the gene name with the var group included in parentheses after the name. An asterisk next to the gene name indicates genes not analyzed in the day 0 samples. The black box on the right of the graph indicates genes containing a Duffy binding–like–γ domain. The absence of a bar indicates genes that were either not analyzed (indicated by asterisks) or had no detectable transcript. Note that the scale on the horizontal axis varies between plots.
Figure 2.
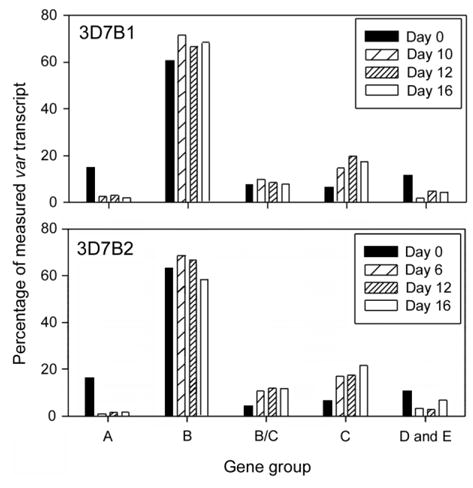
In vitro transcription patterns for the different var groups
The rate of decrease in transcription was determined independently for each gene in each culture line. The power regression model did not produce a good fit for the PFD1005c transcript in the 3D7B1 culture or the PFD1005c, PFD1015c, and PFL0030c transcripts in the 3D7B2 culture: these were excluded from further analysis. Comparison of the slopes of the regression lines indicated significant differences between transcripts within a culture line (P < .02). In 3D7B1, the PF08_0141 (group A) transcript had a significantly faster decline than the PF07_0051, PFD1015c, and PF10_0406 transcripts (group B or C) (P < .05). The same differences were observed in 3D7B2, along with differences between the rate of decrease in transcription between PF08_0141 (group A) and PFL0005w, PF11_0007, PFL2665c, MAL7P1.55, PFA0005w, and PFF1595c (group B or C) (P < .05). The regression analysis indicated that similarly structured genes had a similar rate of decrease, with transcription of some group A genes and genes with a DBL-γ domain declining faster than others (figure 3). When the slopes of the regression lines for each transcript were compared between 3D7B1 and 3D7B2, no significant differences were detected (P > .07), indicating that the rate of decrease in transcription of specific genes was not related to the source of the sample. No association was found between the slope of the regression lines and quantity of transcript before culture (day 0) for either parasite line (r < 0.13; P > .66).
Figure 3.
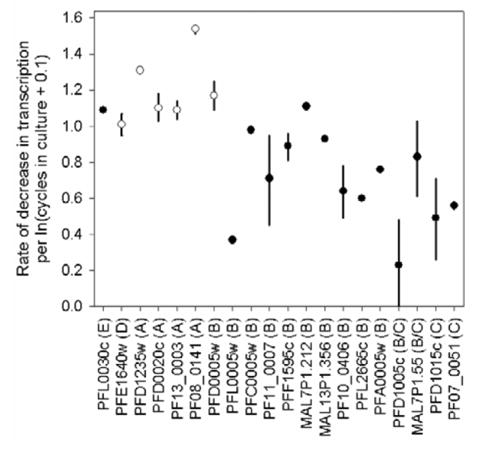
Rate of decrease in transcription estimated from the fitted power regression model for each transcript. The location of the symbol indicates the mean rate of decrease; bars indicate range of rates estimated from the 2 culture lines. Where the bar is missing, only 1 estimate of the rate was obtained, and this is displayed by the symbol. Transcripts are identified by the gene name with the var group included in parentheses after the name. The color of the symbols represents the presence (black) or absence (white) of a Duffy binding–like–γ domain in the gene sequence.
Expression of multiple PfEMP1 types
Proteins extracted from 3D7B1 and 3D7B2 after 21 days of culture reacted with the anti-ATS and anti-AFBR16 antibodies (figure 4). The anti-ATS antibody detected multiple bands at the expected molecular weight.
Figure 4.
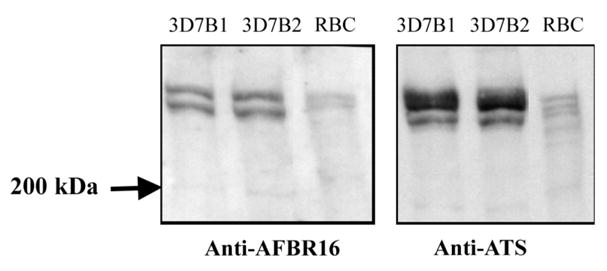
Western blot of 3D7B1 and 3D7B2 day 21 samples with anti-AFBR16 antibody (left) and anti-ATS antibody (right). Uninfected red blood cells (RBCs) were used as a negative control for Plasmodium falciparum erythrocyte membrane protein 1 expression.
DISCUSSION
It is common practice to culture ex vivo parasites to obtain adequate parasite material to investigate var gene transcription or PfEMP1 expression in field isolates. However, phenotypic changes—for example, reduced or changed binding or a loss of knobs—can occur as parasites adapt to in vitro cultivation [19, 29–31] in <28 days [19, 31]. Similar changes have been observed in P. knowlesi and P. falciparum infections, where the expression or pattern of expression of variant antigens is related to the presence of a spleen in an infected monkey [32, 33]. The present study was designed to determine the suitability of using cultured parasites as surrogates when investigating and analyzing in vivo transcriptional activity.
We observed a large reduction in the relative quantity of var gene transcripts in 3D7 parasites from 2 volunteers during the first ~10 days of in vitro culture. This is consistent with an observation of overexpression of genes encoding surface antigens in field samples, compared with the cultured 3D7 parasite line [34], and our results suggest that these differences may, in part, be a result of in vitro cultivation. Although it could be speculated that freeze-thawing of the 3D7B1 and 3D7B2 culture lines may affect the characteristics of the parasite population, cryopreservation has little impact on the results of agglutination assays [35]. Additionally, the estimated in vitro parasite replication rates were only marginally lower than those calculated from blood-induced infections in volunteers using the same cryopreserved and thawed parasites [20] and were higher than that usually achieved in in vitro culture.
One of the most interesting findings is the apparent difference in transcription down-regulation between the var groups. Three criteria previously associated with parasite phenotype or disease characteristics were used to group var genes: (1) gene sequence, location, and orientation; (2) the presence of a DBL-γ domain in the gene sequence; and (3) the number of cysteine residues in the cysteine-rich, C-terminal region of DBL1α described by Kirchgatter et al. [18]. Irrespective of the criterion used, significant differences between the groups were observed. However, the overlapping and dependent nature of the classifications makes it impossible to dissect which of these factors are most important.
It is attractive to speculate that the observed down-regulation of var transcription is caused by parasites switching the expressed PfEMP1 variant. Although it is evident from the decreasing proportion of transcripts detected using selected primers that switching of var genes is occurring to increase diversity or change transcript composition, our results do not support parasite switching as the reason for the decrease in overall transcription. Rather, the observed overall decrease in var transcription, as indicated by a decrease in the ratio of var to s-tRNA syn, could occur if there were a generic process whereby parasites reduce, or a subset stop, transcription.
The observed differences in down-regulation between the var groups may occur if the factor/s causing the generic decrease in transcription affect the genes differently. This would occur if different regulatory processes control the activation or silencing of var genes, as reported elsewhere [36]. Alternatively, down-regulation may be a 2-tiered process: a uniform decrease in transcription across all var genes with specific gene changes superimposed. Our data would support this hypothesis if the group A var genes had a faster switch rate than the other groups. However, if the switch rate is constant between var groups, the results suggest a group A–specific repression combined with a general down-regulation of var transcription.
The sample size of 2 used in the present study is not ideal; however, the results from both volunteers showed similar patterns in var gene transcription during culture adaptation. In selecting the samples, we took into consideration the benefits of using the 3D7 parasite line, such as the genome being available and the parasites already being culture adapted. The fact that the parasites were able to successfully infect mosquitoes, and, in turn, volunteers, indicates that although the parasite line was culture adapted, it still retained the biological features essential for infection and survival in the human host. The study aim of assessing var transcription in ex vivo parasites and those having undergone limited in vitro cultivation meant that only 30%–40% of the var genes were able to be analyzed because of the limited parasite material available. To overcome this problem, we developed a primer set that amplified all var gene transcripts, thereby providing reassurance that the dominant transcripts in the cultured samples were selected for analysis.
We were able to show that although there was significant transcriptional down-regulation, PfEMP1 was still produced by the parasites. We assume that the observed transcriptional changes were mirrored by changes in the amount of protein; however, this could not be tested because of limited parasite numbers in the uncultured samples.
Our results may help explain some of the discrepancies between var gene transcription patterns and severe disease. It has been reported that parasites from patients in Brazil with severe malaria tended to transcribe var genes lacking 1–2 cysteines, compared with parasites from patients with mild malaria [18], whereas no such association was found in isolates from Kenya [14]. However, parasites obtained from the Brazilian patients with mild malaria were cultured for up to 3 cycles, whereas parasites from the patients with severe malaria were not [18]. If our results apply to non-3D7 parasite isolates, parasites causing mild malaria may have preferentially down-regulated genes with a reduced number of cysteines (the majority are group A genes) in response to in vitro cultivation, which would explain the observed difference in transcription patterns between the cultured and uncultured parasites and between the Brazilian and African study in which the parasites were not cultured.
The results of the present study suggest that in vitro culture to enhance parasite material can dramatically change the transcription profile of var genes. Further investigation is required to confirm these results with a larger sample size and, if confirmed, to determine the feedback mechanism and factors influencing the transcriptional changes.
Supplementary Material
Acknowledgments
We thank the Australian Red Cross Blood Services, Brisbane, for providing human red cells and serum used in the cultivation of parasites; and Dr. Brian Cooke (Department of Microbiology, Monash University, Victoria, Australia) for supplying the anti-ATS antibody.
Footnotes
Potential conflicts of interest: none reported.
The opinions expressed herein are those of the author/s and do not necessarily reflect those of the Defence Health Services or any extent Defence policy of Australia.
Financial support: National Institutes of Health (grant AI-47500-05); University of Queensland (Postdoctoral Research Fellowship to M.L.G.)
References
- 1.Beeson JG, Brown GV. Pathogenesis of Plasmodium falciparum malaria: the roles of parasite adhesion and antigenic variation. Cell Mol Life Sci. 2002;59:258–71. doi: 10.1007/s00018-002-8421-y. [DOI] [PMC free article] [PubMed] [Google Scholar]
- 2.Smith JD, Chitnis CE, Craig AG, et al. Switches in expression of Plasmodium falciparum var genes correlate with changes in antigenic and cytoadherent phenotypes of infected erythrocytes. Cell. 1995;82:101–10. doi: 10.1016/0092-8674(95)90056-x. [DOI] [PMC free article] [PubMed] [Google Scholar]
- 3.Fried M, Duffy PE. Adherence of Plasmodium falciparum to chondroitin sulfate A in the human placenta. Science. 1996;272:1502–4. doi: 10.1126/science.272.5267.1502. [DOI] [PubMed] [Google Scholar]
- 4.Chen Q, Fernandez V, Sundstrom A, et al. Developmental selection of var gene expression in Plasmodium falciparum. Nature. 1998;394:392–5. doi: 10.1038/28660. [DOI] [PubMed] [Google Scholar]
- 5.Rowe JA, Moulds JM, Newbold CI, Miller LH. P.falciparum rosetting mediated by a parasite-variant erythrocyte membrane protein and complement-receptor 1. Nature. 1997;388:292–5. doi: 10.1038/40888. [DOI] [PubMed] [Google Scholar]
- 6.Su XZ, Heatwole VM, Wertheimer SP, et al. The large diverse gene family var encodes proteins involved in cytoadherence and antigenic variation of Plasmodium falciparum-infected erythrocytes. Cell. 1995;82:89–100. doi: 10.1016/0092-8674(95)90055-1. [DOI] [PubMed] [Google Scholar]
- 7.Baruch DI, Pasloske BL, Singh HB, et al. Cloning the P.falciparum gene encoding PfEMP1, a malarial variant antigen and adherence receptor on the surface of parasitized human erythrocytes. Cell. 1995;82:77–87. doi: 10.1016/0092-8674(95)90054-3. [DOI] [PubMed] [Google Scholar]
- 8.Gardner MJ, Hall N, Fung E, et al. Genome sequence of the human malaria parasite Plasmodium falciparum. Nature. 2002;419:498–511. doi: 10.1038/nature01097. [DOI] [PMC free article] [PubMed] [Google Scholar]
- 9.Fowler EV, Peters JM, Gatton ML, Chen N, Cheng Q. Genetic diversity of the DBLα region in Plasmodium falciparum var genes among Asia-Pacific isolates. Mol Biochem Parasitol. 2002;120:117–26. doi: 10.1016/s0166-6851(01)00443-1. [DOI] [PubMed] [Google Scholar]
- 10.Voss TS, Thompson JK, Waterkeyn J, et al. Genomic distribution and functional characterisation of two distinct and conserved Plasmodium falciparum var gene 5′ flanking sequences. Mol Biochem Parasitol. 2000;107:103–15. doi: 10.1016/s0166-6851(00)00176-6. [DOI] [PubMed] [Google Scholar]
- 11.Kraemer SM, Smith JD. Evidence for the importance of genetic structuring to the structural and functional specialization of the Plasmodium falciparum var gene family. Mol Microbiol. 2003;50:1527–38. doi: 10.1046/j.1365-2958.2003.03814.x. [DOI] [PubMed] [Google Scholar]
- 12.Lavstsen T, Salanti A, Jensen AT, Arnot DE, Theander TG. Sub-grouping of Plasmodium falciparum 3D7 var genes based on sequence analysis of coding and non-coding regions. Malar J. 2003;2:27. doi: 10.1186/1475-2875-2-27. [DOI] [PMC free article] [PubMed] [Google Scholar]
- 13.Tami A, Ord R, Targett GA, Sutherland CJ. Sympatric Plasmodium falciparum isolates from Venezuela have structured var gene repertoires. Malar J. 2003;2:7. doi: 10.1186/1475-2875-2-7. [DOI] [PMC free article] [PubMed] [Google Scholar]
- 14.Bull PC, Berriman M, Kyes S, et al. Plasmodium falciparum variant surface antigen expression patterns during malaria. PLoS Pathog. 2005;1:e26. doi: 10.1371/journal.ppat.0010026. [DOI] [PMC free article] [PubMed] [Google Scholar]
- 15.Rowe JA, Kyes SA. The role of Plasmodium falciparum var genes in malaria in pregnancy. Mol Microbiol. 2004;53:1011–9. doi: 10.1111/j.1365-2958.2004.04256.x. [DOI] [PMC free article] [PubMed] [Google Scholar]
- 16.Bian Z, Wang G. Antigenic variation and cytoadherence of PfEMP1 of Plasmodium falciparum-infected erythrocyte from malaria patients. Chin Med J (Engl) 2000;113:981–4. [PubMed] [Google Scholar]
- 17.Ariey F, Hommel D, Le Scanf C, et al. Association of severe malaria with a specific Plasmodium falciparum genotype in French Guiana. J Infect Dis. 2001;184:237–41. doi: 10.1086/322012. [DOI] [PubMed] [Google Scholar]
- 18.Kirchgatter K, del Portillo HA. Association of severe noncerebral Plasmodium falciparum malaria in Brazil with expressed PfEMP1 DBL1α sequences lacking cysteine residues. Mol Med. 2002;8:16–23. [PMC free article] [PubMed] [Google Scholar]
- 19.Udeinya IJ, Graves PM, Carter R, Aikawa M, Miller LH. Plasmodium falciparum: effect of time in continuous culture on binding to human endothelial cells and amelanotic melanoma cells. Exp Parasitol. 1983;56:207–14. doi: 10.1016/0014-4894(83)90064-4. [DOI] [PubMed] [Google Scholar]
- 20.Cheng Q, Lawrence G, Reed C, et al. Measurement of Plasmodium falciparum growth rates in vivo: a test of malaria vaccines. Am J Trop Med Hyg. 1997;57:495–500. doi: 10.4269/ajtmh.1997.57.495. [DOI] [PubMed] [Google Scholar]
- 21.Peters J, Fowler E, Gatton M, Chen N, Saul A, Cheng Q. High diversity and rapid changeover of expressed var genes during acute phase of Plasmodium falciparum infections in human volunteers. Proc Natl Acad Sci USA. 2002;99:10689–94. doi: 10.1073/pnas.162349899. [DOI] [PMC free article] [PubMed] [Google Scholar]
- 22.Kyes SA, Christodoulou Z, Raza A, et al. A well-conserved Plasmodium falciparum var gene shows an unusual stage-specific transcript pattern. Mol Microbiol. 2003;48:1339–48. doi: 10.1046/j.1365-2958.2003.03505.x. [DOI] [PMC free article] [PubMed] [Google Scholar]
- 23.Salanti A, Staalsoe T, Lavstsen T, et al. Selective upregulation of a single distinctly structured var gene in chondroitin sulphate A-adhering Plasmodium falciparum involved in pregnancy-associated malaria. Mol Microbiol. 2003;49:179–91. doi: 10.1046/j.1365-2958.2003.03570.x. [DOI] [PubMed] [Google Scholar]
- 24.Gatton ML, Peters JM, Gresty K, Fowler EV, Chen N, Cheng Q. Detection sensitivity and quantitation of Plasmodium falciparum var gene transcripts by real-time RT-PCR in comparison with conventional RT-PCR. Am J Trop Med Hyg. 2006;75:212–8. [PMC free article] [PubMed] [Google Scholar]
- 25.Taylor HM, Kyes SA, Harris D, Kriek N, Newbold CI. A study of var gene transcription in vitro using universal var gene primers. Mol Biochem Parasitol. 2000;105:13–23. doi: 10.1016/s0166-6851(99)00159-0. [DOI] [PubMed] [Google Scholar]
- 26.Stowers A, Taylor D, Prescott N, Cheng Q, Cooper J, Saul A. Assessment of the humoral immune response against Plasmodium falciparum rhoptry-associated proteins 1 and 2. Infect Immun. 1997;65:2329–38. doi: 10.1128/iai.65.6.2329-2338.1997. [DOI] [PMC free article] [PubMed] [Google Scholar]
- 27.Conover WJ. Practical nonparametric statistics. 2. New York: John Wiley & Sons, ; 1980. [Google Scholar]
- 28.Zar JH. Biostatistical analysis. 2. New Jersey: Prentice-Hall; 1984. [Google Scholar]
- 29.Biggs BA, Kemp DJ, Brown GV. Subtelomeric chromosome deletions in field isolates of Plasmodium falciparum and their relationship to loss of cytoadherence in vitro. Proc Natl Acad Sci USA. 1989;86:2428–32. doi: 10.1073/pnas.86.7.2428. [DOI] [PMC free article] [PubMed] [Google Scholar]
- 30.Gysin J, Pouvelle B, Fievet N, Scherf A, Lepolard C. Ex vivo dese-questration of Plasmodium falciparum-infected erythrocytes from human placenta by chondroitin sulfate A. Infect Immun. 1999;67:6596–602. doi: 10.1128/iai.67.12.6596-6602.1999. [DOI] [PMC free article] [PubMed] [Google Scholar]
- 31.Beeson JG, Brown GV, Molyneux ME, Mhango C, Dzinjalamala F, Rogerson SJ. Plasmodium falciparum isolates from infected pregnant women and children are associated with distinct adhesive and antigenic properties. J Infect Dis. 1999;180:464–72. doi: 10.1086/314899. [DOI] [PMC free article] [PubMed] [Google Scholar]
- 32.Barnwell JW, Howard RJ, Coon HG, Miller LH. Splenic requirement for antigenic variation and expression of the variant antigen on the erythrocyte membrane in cloned Plasmodium knowlesi malaria. Infect Immun. 1983;40:985–94. doi: 10.1128/iai.40.3.985-994.1983. [DOI] [PMC free article] [PubMed] [Google Scholar]
- 33.Hommel M, David PH, Oligino LD. Surface alterations of erythrocytes in Plasmodium falciparum malaria: antigenic variation, antigenic diversity, and the role of the spleen. J Exp Med. 1983;157:1137–48. doi: 10.1084/jem.157.4.1137. [DOI] [PMC free article] [PubMed] [Google Scholar]
- 34.Daily JP, Le Roch KG, Sarr O, et al. In vivo transcriptome of Plasmodium falciparum reveals overexpression of transcripts that encode surface proteins. J Infect Dis. 2005;191:1196–203. doi: 10.1086/428289. [DOI] [PMC free article] [PubMed] [Google Scholar]
- 35.Reeder JC, Rogerson SJ, Al-Yaman F, et al. Diversity of agglutinating phenotype, cytoadherence, and rosette-forming characteristics of Plasmodium falciparum isolates from Papua New Guinean children. Am J Trop Med Hyg. 1994;51:45–55. doi: 10.4269/ajtmh.1994.51.45. [DOI] [PubMed] [Google Scholar]
- 36.Voss TS, Kaestli M, Vogel D, Bopp S, Beck HP. Identification of nuclear proteins that interact differentially with Plasmodium falciparum var gene promoters. Mol Microbiol. 2003;48:1593–607. doi: 10.1046/j.1365-2958.2003.03528.x. [DOI] [PubMed] [Google Scholar]
- 37.Kissinger JC, Brunk BP, Crabtree J, et al. The Plasmodium genome database. Nature. 2002;419:490–2. doi: 10.1038/419490a. [DOI] [PubMed] [Google Scholar]
Associated Data
This section collects any data citations, data availability statements, or supplementary materials included in this article.