Abstract
Current theories suggest that bone modeling and remodeling are controlled at the cellular level through signals mediated by osteocytes. However, the specific signals to which bone cells respond are still unknown. Two primary theories are: (1) osteocytes are stimulated via the mechanical deformation of the perilacunar bone matrix and (2) osteocytes are stimulated via fluid flow generated shear stresses acting on osteocyte cell processes within canaliculi. Recently, much focus has been placed on fluid flow theories since in vitro experiments have shown that bone cells are more responsive to analytically estimated levels of fluid shear stress than to direct mechanical stretching using macroscopic strain levels measured on bone in vivo. However, due to the complex microstructural organization of bone, local perilacunar bone tissue strains potentially acting on osteocytes cannot be reliably estimated from macroscopic bone strain measurements. Thus, the objective of this study was to quantify local perilacunar bone matrix strains due to macroscopically applied bone strains similar in magnitude to those that occur in vivo. Using a digital image correlation strain measurement technique, experimentally measured bone matrix strains around osteocyte lacunae resulting from macroscopic strains of approximately 2000 microstrain are significantly greater than macroscopic strain on average and can reach peak levels of over 30,000 microstrain locally. Average strain concentration factors ranged from 1.1 to 3.8, which is consistent with analytical and numerical estimates. This information should lead to a better understanding of how bone cells are affected by whole bone functional loading.
Keywords: Bone, Osteocyte lacuna, Micromechanics, Tissue strain
1. Introduction
Bone mechanotransduction, the mechanism whereby bone senses mechanical stimuli, is not well understood. It is believed that the coordinated actions of osteoclasts and osteoblasts are responsible for bone modeling and remodeling at the cellular level in response to mechanical and biochemical signals mediated by osteocytes. This phenomenon implies that bone cells can detect and respond to their mechanical environment by altering their biological and biochemical activities (mechanotransduction). Candidate theories suggest that it is the response of the osteocyte to either direct mechanical stimulus (Ehrlich and Lanyon, 2002; Kimmel, 1993; Mullender and Huiskes, 1995, 1997), fluid flow induced shear stress that may mediate the activities of osteoblasts and osteoclasts (Pienkowski and Pollack, 1983; Weinbaum et al., 1994, 2003), or bone microdamage (Mori and Burr, 1993; Taylor et al., 2003). Theories based on fluid flow induced shear stress stimulation of osteocyte dendritic cell processes within canaliculi have gained the most prominence (You et al., 2001) since it has been shown that direct mechanical strain applied to cells at levels measured to occur in humans in vivo do not stimulate bone cells in vitro (Owan et al., 1997; You et al., 2000). In one experiment, osteoblastic cells were found to increase their production of osteopontin (OPN) mRNA, prostaglandin (PGE2), and nitric oxide (NO) in response to fluid flow in contrast to cells deformed to mechanical strain levels similar to those measured in vivo (Owan et al., 1997). However, when osteoblastic cells are subjected to substrate strains levels many times greater than those measured in vivo, increased biological activity is observed (You et al., 2000). Additionally, it has been shown that fluid flow induced shear stress and substrate stretch have different effects on primary human bone cells’ biological activity (Mullender et al., 2004). In this experiment, fluid flow shear stress was shown to stimulate the production of PGE2 and NO, as reported previously, while substrate stretching stimulated NO production, but not PGE2. Furthermore, substrate stretching also enhanced the production of collagen, whereas fluid flow shear stress did not.
In vitro cell culture experiments apply mechanical stimulation at magnitudes and rates thought to occur in vivo. In the case of fluid flow shear stress experiments, the magnitude of the fluid flow derived shear stress is based on analytically derived estimates of fluid shear stress thought to occur in vivo (Weinbaum et al., 1994), although the actual fluid flow rates have not been measured in vivo. In contrast, in vivo bone strains have been directly measured in humans to be approximately 1200 με (principal compressive strain) to approximately 1900 με (maximum shear strain) (Burr et al., 1996) during vigorous physical activities. However, the bone strains were measured using foil type strain gages that record strain over a finite surface area, typically on the order of several square millimeters, which is several orders of magnitude greater than an osteocyte lacuna. Thus, the strain reported from strain gage based studies represents average strain acting on thousands of osteocytes and yields no information regarding variations in the local strain field that necessarily must result from naturally occurring microstructural inhomogeneities in the bone matrix.
In bone, structural features such as osteons, canaliculi, and osteocyte lacunae, are all potential stress concentrators (Currey, 1962, 2003), and the tissue strains associated with these features are likely to be significantly different from average macroscopic strains. Thus, we hypothesize that in response to macroscopic levels of strain, local microstructural tissue strain is expected to localize around natural stress concentrators, such as lacunae, in bone and therefore, perilacunar tissue strain levels at many lacunae will exceed the global applied strain. The purpose of this paper is to investigate this hypothesis as it relates to cortical bone.
2. Methods
Seven cortical bone test specimens were prepared from two fresh bovine tibias by cutting flat, rectangular blank sections from the tibia mid-diaphysis such that the long axis of each specimen blank was oriented longitudinally, the width of the specimen was oriented radially (defining the surface that was imaged and used for subsequent strain analysis), and the thickness of the specimen was oriented circumferentially. Each specimen was selected randomly from all quadrants within the cross section of each tibia. The specimens were machined to a final flat ‘‘dog-bone’’ shape with a gage section that was nominally 2 mm wide and 15 mm long, grip regions were nominally 15 mm long and 15 mm wide, and specimen thickness varied from 2–5 mm. Specimens were machined using a miniature milling machine and were continuously irrigated during the machining process. After machining, the surface of each specimen was polished with successively finer grit paper beginning with 500 grit, using a 30 N normal force for 15 s; 1200 grit, using a 30 N normal force for 30 s; and 4000 grit, using a 30 N normal force for 15 s. Next, specimens were polished twice with 3 μm diamond paste on a polishing cloth for 30 s with a 30 N normal force. The finished samples were wrapped in gauze, stored in calcium-buffered saline, and frozen at approximately −21 °C until tested.
Immediately prior to testing, a single strain gage (EA-06-062AQ-350, Measurements Group Inc., Raleigh, NC) was applied to one surface of the specimen on the centerline and oriented longitudinally; this strain gage was used to measure the global, macroscopic strain applied to the specimen. The gage area of the strain gage was approximately 1.5-mm by 1.5-mm and therefore the reported strain is an average over an area of 2.25 mm2.
Each specimen was loaded in tension using a custom microscopy loading frame (Fig. 1) (Kammrath and Weiss, Dortmund, Germany) under displacement control to increasing levels of macroscopic strain as measured using the specimen strain gage. The loading direction corresponded to the anatomical longitudinal direction. During loading, the specimen surface opposite the gage was imaged at either 500 × (2 specimens) or 200 × (5 specimens) total magnification using an optical microscope (Zeiss Universal Model 24, Carl Zeiss Inc, Thornwood, NY); images were acquired using a digital camera (Kodak MegaPlus 4i, Eastman Kodak Company, Rochester, NY) at 1312 × 1032 pixel resolution resulting in an image resolution of 7.37 pixels/μm (or 1 pixel = 0.137 μm) for 500 × magnification and 2.95 pixels/μm (or 1 pixel = 0.339 μm) for 200 × magnification. An initial nominally unloaded specimen image was acquired at a specimen pre-load of 5 N to remove any slack in the loading stage. Each image was acquired such that the specimen loading direction was the horizontal (x-axis) of the image. Subsequent digital images were acquired at nominal global specimen strain increments of 250 με as measured by the specimen strain gage to a maximum macroscopic specimen strain of at least 1500 με. Load applied to each specimen was recorded from a load cell incorporated into the microscopy loading frame.
Fig. 1.
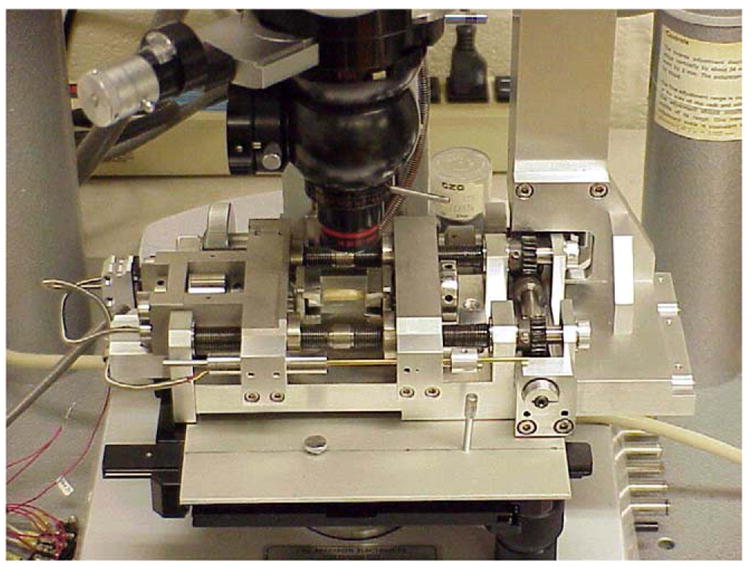
An in situ microscopy specimen loading stage was used to apply a controlled macroscopic displacement to each cortical bone specimen while imaging the specimen surface under an optical microscope. The load frame is designed to apply displacements or loads to the specimen in equal and opposite directions allowing the center of the specimen to remain centered under the microscope objective. A strain gage attached to the underside of the specimen was used to monitor the global specimen strain and a load cell incorporated into the load frame was used to monitor the load applied to the specimen.
The captured unloaded vs. loaded image pairs were analyzed using a digital stereoimaging technique (Franke et al., 1991; Nicolella et al., 2001; Williams et al., 1980), which quantified the local surface deformation and strain fields. Digital stereoimaging is an analysis method based on image correlation techniques that allows the measurement of material surface displacements by comparing images of a specimen taken at two different stress states. Briefly, an array of measurement points is digitally superimposed on a micrograph taken of the specimen in the reference state, thereby defining where displacement measurements are to be made. The user defines the measurement grid density by indicating the number of grid columns and rows. The image processing system ‘‘trains’’ on (stores in memory) a small area (the model or template) based on the unique surface texture surrounding each measurement point in the reference image (Fig. 2a). A local search is then performed to find the best matching area in the second (deformed) image. To improve processing speed, the search area is constrained to a region surrounding the measurement point (Fig. 2a). The sizes of the user-defined train and search regions generally depend upon available surface detail and material displacement magnitude. The displacement search procedure is controlled by a normalized image correlation algorithm
Fig. 2.
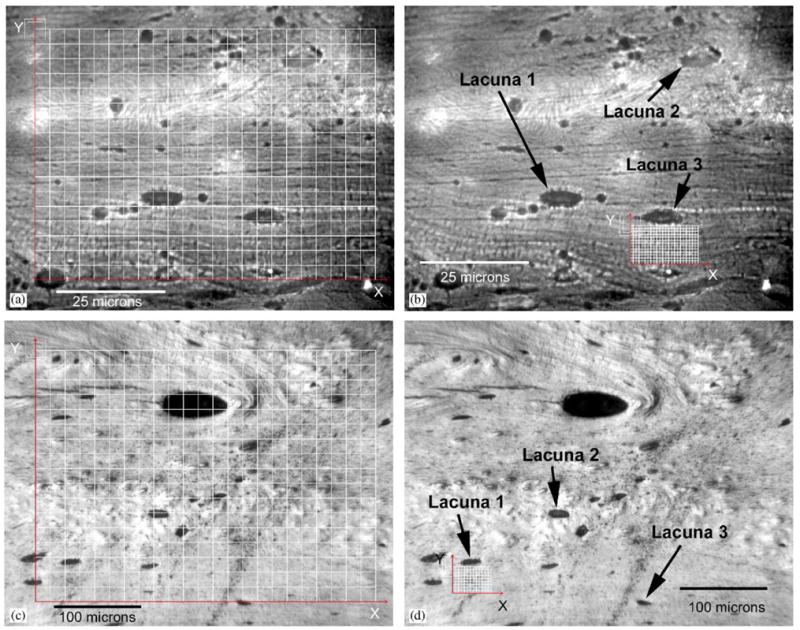
(a) Optical digital micrographs of the surface of a typical cortical bone specimen imaged at a total magnification of 500 ×. Superimposed on the image is the grid at which displacement and strain measurements were made to determine the average microstructural strain. Shown at the top left corner of the displacement grid are graphical representations of the correlation train and search parameters. The inner square represents the sub-image train size and the outer square represents the search size. The 24 × 18 grid spacing is 50 pixels both vertically and horizontally. (b) Typical 24 × 18 measurement grid spaced at 10 pixels used to quantify the local perilacunar bone matrix strains using images acquired at 500 ×. Indicated are three osteocyte lacunae where perilacunar strain measurements were made. (c) Digital micrograph of a cortical bone specimen taken at 200 × magnification. As with the 500 × magnification micrograph, a 24 × 18 grid spaced at 50 pixels is used to quantify the average microstructural strain over the imaged area. (d) A local perilacunar 14 × 10 measurement grid spaced at 10 pixels was used to quantify strains adjacent to osteocyte lacuna. Indicated are three osteocyte lacunae where perilacunar strain measurements were made.
where r(u,v) defines the degree of correlation between the image areas, I is the target (stressed) image region, M is the model (reference) image region, Mi is the model pixel location (xi, yi), Ii, is the target pixel location (u + xi, v + yi), N is the number of pixels in the model image where i ranges from 1 to N. The trained image area is a square array of pixels (with sides N) around each measurement grid point. A correlation value of r = 1 indicates a perfect match, r = 0 no correlation, and r = −1 is a perfect mismatch (Franke et al., 1991). This algorithm determines the position of the deformed material points with respect to the undeformed image.
A preliminary analysis was performed to select the digital stereoimaging parameters that maximized the accuracy of the technique for the current set of experiments (Nicolella et al., 2001). Two successive images were acquired of the specimen surface without applying a load to the specimen. A displacement mapping and strain analysis was performed on the captured image pair using successively greater image subset template training sizes. A 24 × 18 measurement grid with a 50 pixel grid spacing that covered the entire imaged region was used for this analysis and material displacements were measured and strains computed for each grid point. The mean and standard deviation of all points within the measurement grid (432 grid points) were computed for each successive correlation parameter selection. Since no load is applied to the specimen between image acquisitions, this set of images represents, at best, a rigid body translation and therefore the expected strains measured using digital stereoimaging are zero. Thus, any strains measured using this image pair represent the nominal accuracy of the system. A threshold of 5% change in strain calculation was used to determine the optimal stereoimaging parameters.
For each specimen, the overall displacement and strain distributions were determined over the entire digital micrograph using a 24 × 18 measurement grid with a 50 pixel grid spacing (Fig. 2a and c) (microstructural strain) at each successive globally applied specimen strain. In addition, three local perilacunar microstructure regions for each of the specimens imaged at 500 × and five regions for the specimens imaged at 200 × were selected for analysis that consisted of bone matrix adjacent to osteocyte lacunae (Fig. 2b and d), resulting in 31 perilacunar strain measurements at each level of applied macroscopic strain (perilacunar strain). For these regions, a 24 × 18 measurement grid with a 10 pixel spacing was used for the 500 × images (31.5 μm × 23.3 μm) and 14 × 10 measurement grid with a 10 pixel spacing was used for the 200 × images (44.1 μm × 30.5 μm). These data were pooled for each global strain level by calculating the mean over all measurement grid points for each local microstructural and perilacunar region. Strain concentration factors were calculated by computing the ratio of the mean perilacunar strain to the mean microstructural strain. In addition, several larger microstructural regions on the 500 × digital micrographs were examined to determine the patterns of strain distribution around osteocyte lacunae. In these analyses, the grid points located within the lacunae were excluded from the strain calculations. For each specimen, the two-dimensional plane strain tensor (εxx, εyy, and εxy) was computed for the entire digital micrograph and at each local perilacunar region. Principal strain components were computed from the two-dimensional strain tensor.
3. Results
The measured displacement accuracy resulting from the image correlation analysis performed on images (both 500 × and 200 × image sets) taken in succession without an applied load converged to approximately 0.104 ± 0.020 pixel displacement in the x-direction and 0.064 ± 0.014 pixel displacement in the y-direction when a sub-image correlation training template size of 51 × 51 pixels was used (Fig. 3a). This represents a measurement accuracy of 14.2 ± 2.74 and 8.77 ± 1.92 nm in the x- and y-directions respectively at 500 × magnification and 35.26 ± 6.78 and 21.70 ± 4.75 nm in the x- and y-directions respectively at 200 × magnification. A sub-image correlation training template size of 11 × 11 resulted in large variability in measured displacements that was subsequently reduced as the sub-image training template size increased. Beyond a training template size of 51 × 51 pixels, the displacement measurement accuracy did not improve with increasing template size.
Fig. 3.
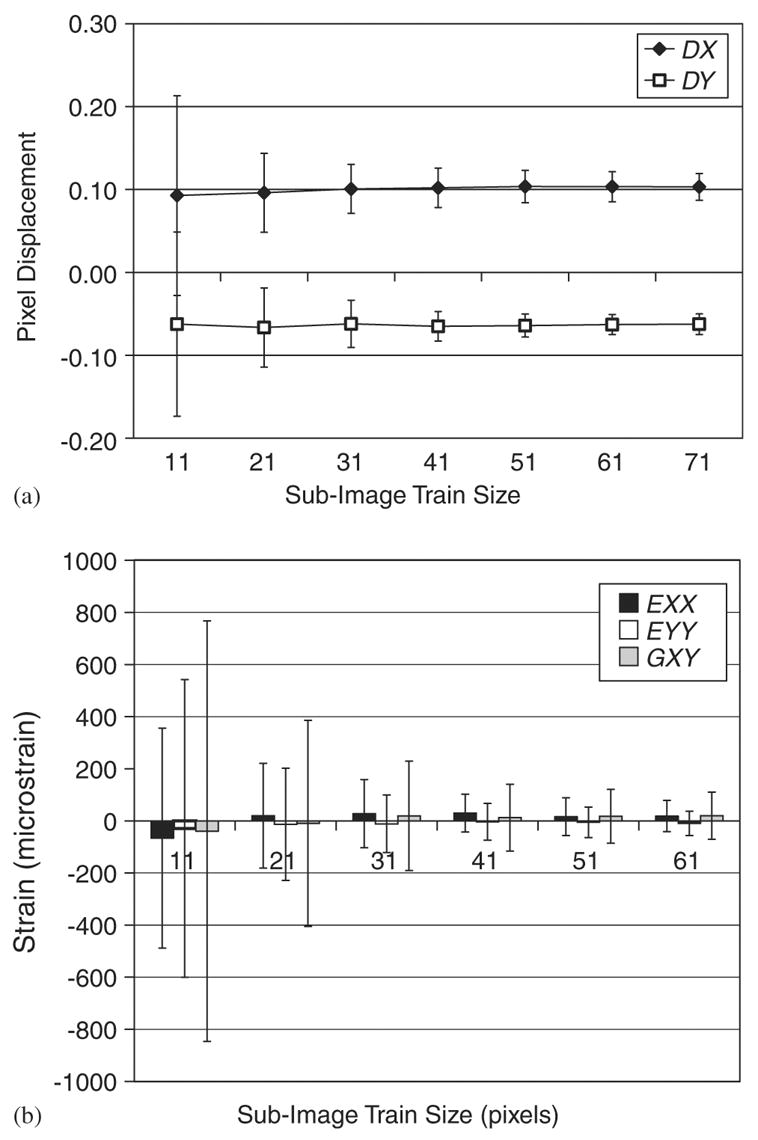
An image correlation parameter convergence analysis was performed using a measurement grid of 24 × 18 on two successive images of an unloaded specimen. The mean and standard deviation of the measured displacements in the x direction (DX) and y direction (DY) and the two-dimensional strain tensor (EXX, EYY GXY) for all measurements points on the image (432 grid points) were calculated for each successively increasing sub-image train size. The sub-image train template size converged to 61 × 61 pixels for both the in-plane displacements (3a) and the two-dimensional strain tensor (3b). Data plotted are mean values ± standard deviation.
Strains computed from the above non-loaded displacement mapping accuracy analysis showed similar results (Fig. 3b). Strain tensor components decreased from—66.22 ± 422.27 με for εxx, −28.87 ± 571.44 με for εyy, and −39.59 ± 807.08 με for γxy when a sub-image training template size of 11 × 11 pixels was used to 16.26 ± 72.36 με for εxx, −5.44 ± 58.73 με for εyy, and 17.36 ± 103.72 με for γxy when a sub-image training template size of 51 × 51 pixels was used. No improvement in strain accuracy was gained by using correlation training template sizes greater than 51 × 51 pixels. Therefore, in all subsequent analyses, a sub-image training template size of 51 × 51 pixels was used.
The average microstructural strain measured over the entire imaged area using the digital stereoimaging method correlated with the average applied specimen strain as measured using the specimen strain gage (r2 = 0.94). In contrast, the average measured perilacunar strain was significantly greater than both the average microstructural strain and the applied macroscopic strain as determined by analysis of covariance (p < 0.05) (Fig. 4a). These data include strain averages from both the specimens imaged at 500 × and at 200 ×. The average perilacunar strain magnification factor decreased from a high of 3.8 at a global specimen strain of 250 microstrain to between 1.1 and 1.8 for global strains of between 2000 and 4500 microstrain (Fig. 4b). The wide distribution of microstructural strains at each global strain level indicates a highly variable local strain field (Fig. 5a). Similar to the strain computed over the entire imaged area, the perilacunar strain exhibited large variations, with peak strains over 20,000 microstrain compared to global specimen strains of 1500 microstrain (Fig. 5b).
Fig. 4.
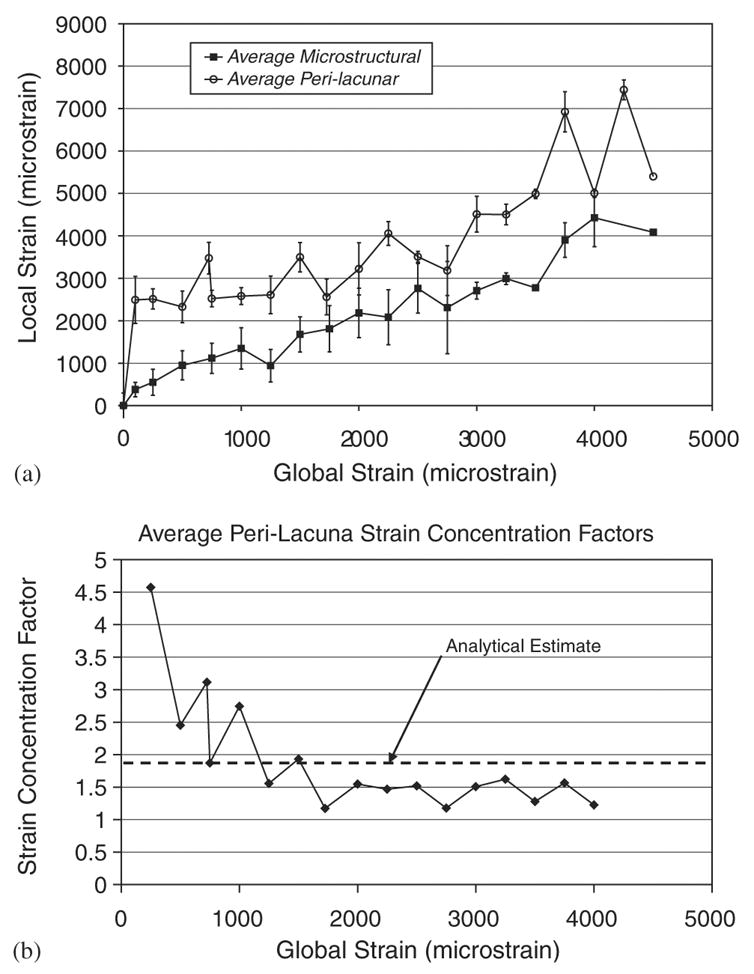
(a) The mean microstructural strain (x-component) measured over the entire imaged area correlated well with the macroscopic strain measured using a strain gage. The average perilacunar strain was significantly greater than both the average microstructural strain and the macroscopic strain as determined by an analysis of covariance (p < 0.05). The data were pooled for each global strain level by calculating the mean over all measurement grid points for each microstructural (entire image area) and perilacunar region. Data plotted is mean ± SEM. (b) The average strain concentration factor ranges from 3.6 to 1.1 at varying levels of global strain. The experimentally derived concentration factors are in agreement with analytical estimates based on ellipsoidal holes in a continuum.
Fig. 5.
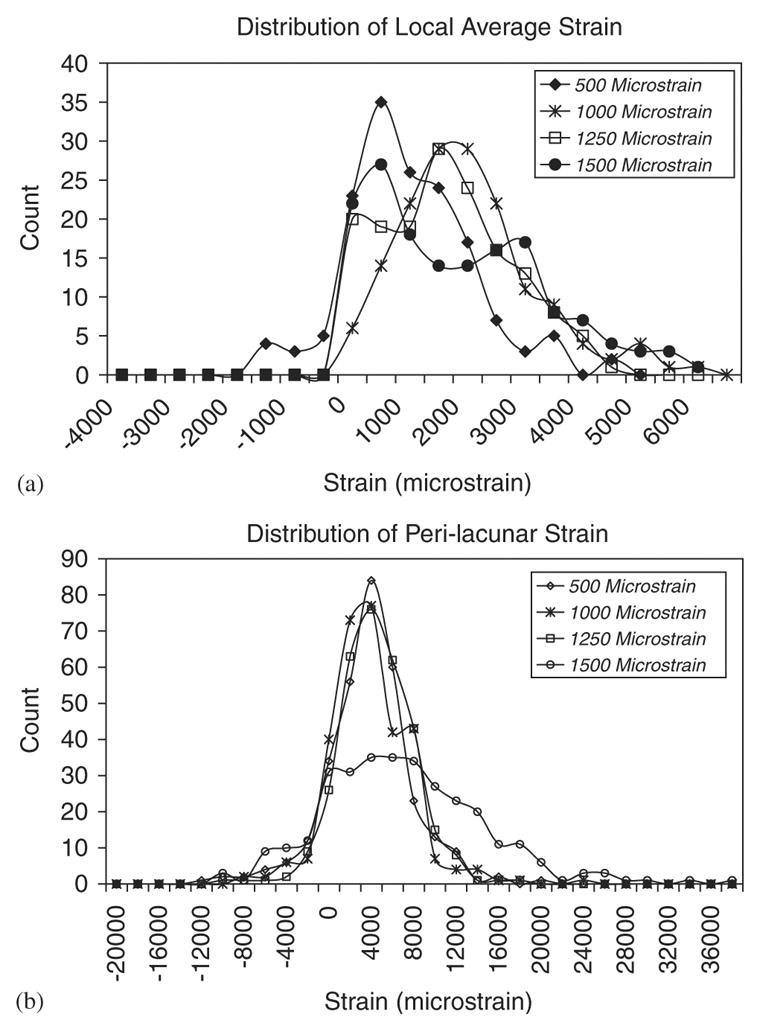
(a) The distribution of microstructural tissue strains for a typical specimen indicates large variability. This distribution is typical of all seven specimens tested. As the global strain increases, the variability of the microstructural strain increases and shifts toward larger local strain values. (b) Similar variability in tissue strains is found for the perilacunar regions. As the global strain is increased, perilacunar tissue strain variability increases with at least one peak measurement grid value of over 20,000 microstrain at each global strain value. Count refers to the number of grid points in the measurement grid whose measured strain falls within each bin.
In several bone specimens (e.g. the specimen shown in Fig. 2a and b), the local perilacunar strain did not monotonically increase as a function of globally applied stress, although the average strain measured over the imaged region did increase monotonically up to the last loading step. Average perilacunar strain was seen to significantly increase locally adjacent to one lacuna while decreasing in an adjacent region within the same imaged area (Fig. 6). For example, when the applied macroscopic strain level is increased from 500 microstrain to 750 microstrain, lacuna 1 and lacuna 2 average perilacunar strains increase from 2780 and 1900 microstrain respectively to 5500 and 4910 microstrain respectively while the lacuna 3 average perilacunar strain decreases from 3320 to 2240 microstrain. This non-monotonic behavior occurs several times as the macroscopic strain level is increased to a maximum of 1500 microstrain.
Fig. 6.
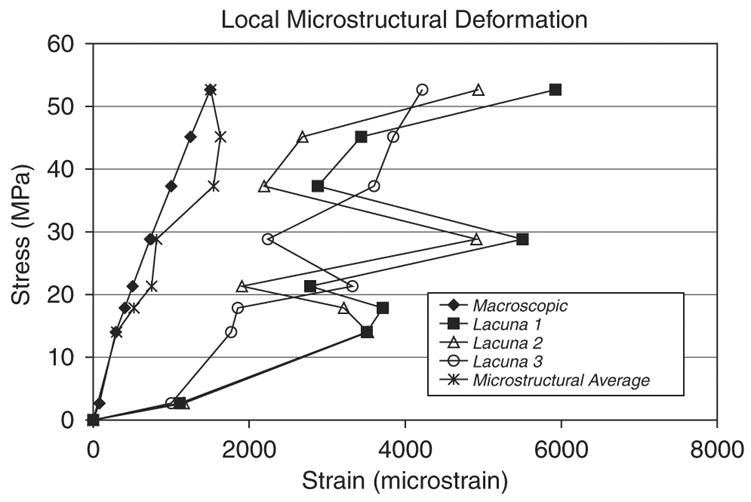
Perilacunar strain for individual osteocyte lacunae shows non-monotonic behavior compared to the applied macroscopic strain that may indicate local redistribution of bone matrix strain due to microdamage.
Patterns of microstructural strain indicate increased strain at the poles of the lacuna minor diameter, which is perpendicular to the loading direction, and decreased strain at the poles of the major diameter of the lacuna, which is parallel to the loading direction, when the specimen is loaded to a macroscopic strain of 1500 με (Fig. 7). Also apparent are regions of high strain that link two or more lacuna. Tissue strain magnitudes adjacent to lacunae vary between 7000 με to 15,000 με. Increased strain also occurs in regions where lacunae appear to be just below the surface. Tissue strains are less than 2000 με at the majority of the microstructure not associated with lacunae, although in some regions not associated with lacunae, strain concentrations nevertheless occur.
Fig. 7.
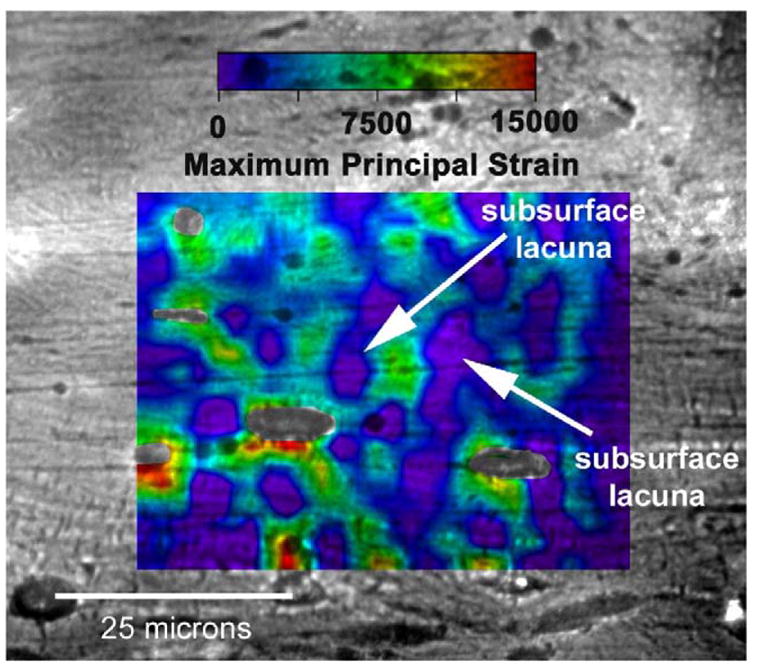
Microstructural strain field overlaid on a digital micrograph of a cortical bone specimen that was loaded to a macroscopic strain of 1500 με in the horizontal direction. Each color represents a specific level of maximum principal strain as indicated by the legend. The local microstructural strain field is highly heterogeneous and strain is found to localize around osteocyte lacunae as well as between lacunae. Local perilacunar strain reaches peaks of over 15,000 με in this specimen. Subsurface lacunae affect the local strain fields in a similar manner as lacunae on the surface. The arrows indicate osteocyte lacunae below the machine surface of the specimen. Original magnification: 500 ×.
4. Discussion
In this investigation, we hypothesized that macroscopic bone strains measured in vivo with strain gages are not representative of local microstructural bone tissue strains associated with osteocyte lacuna. Using a digital image correlation based system, we have shown that the local perilacunar strains are greater on average than the macroscopically applied strains, that they do not increase monotonically compared to the macroscopically applied strains, and that peak perilacunar strains can be more than an order of magnitude greater than the macroscopically measured bone tissue strains.
The basis used for studying the stimulatory effects of mechanical strain on bone cell biological responses in vitro has been the direct measurement of bone strain in humans during various physical activities. The limitation of applying this strain magnitude data to cells in vitro, however, is that the in vivo strain gage measurements represent continuum measures of bone deformation. Clearly, at the spatial level of bone cells, cortical bone is not a continuum and microstructural inhomogeneities will result in inhomogeneous microstructural strain fields; local tissue strains will be magnified in association with microstructural features. A major source of the inhomogeneity in bone is osteocyte lacunae. Thus, it is important to quantify the local tissue deformation state related to the osteocyte lacuna since it is this deformation that is most likely acting on the osteocyte located within the lacuna.
There are several limitations to the current study that warrant discussion. One limitation is that a relatively small number of specimens (7) from two bovine tibias were used in this analysis. Another limitation is that measurements were performed on cortical bone specimens that were machined and polished flat; two-dimensional image correlation measurements were performed on the polished bone surface, which is in contrast to the in vivo environment where osteocytes reside in three-dimensional lacunae. However, the optical technique used in this investigation is analogous to a strain gage applied to the surface of bone in that surface strains are measured using either technique, although the gage length of the current optical system is on the microscopic scale of the osteocyte lacuna and the strains thus measured are more representative of the local tissue strains that are likely to influence osteocytes.
It also may be argued that the presence of sectioned osteocyte lacuna on the prepared surface of the bone specimens affects the measured perilacunar tissue strain. However, in several analyses, the presence of a lacuna below the surface of the specimen is directly observable (e.g. Fig. 6) and examination of the measured strain field at the subsurface lacuna site indicates that the lacuna below the surface is affecting the local strain in a similar manner as lacuna sectioned on the surface itself.
The current analysis utilized young bovine bone and the quantitative results may not be specifically applicable to human tissue. However, the overall observation that tissue strains associated with osteocyte lacunae would on average be greater than macroscopic strains measured with strain gages is still relevant. Microstructural heterogeneities clearly exist in human bone and will result in strain concentrations similar to those quantified in this investigation, particularly around osteocyte lacunae. The specific magnitude of the strain concentration will depend on a number of factors including the specific local microstructure (Bousson et al., 2001), variations in local tissue properties (Hoffler et al., 2000), and the presence of microdamage (Nicolella et al., 2001).
The measured strain concentration factors associated with osteocyte lacuna are consistent with analytical estimates of stress concentration factors for elliptical defects assuming the stress remains below the material yield stress. Currey (1962) first estimated the stress concentration factors due to osteocyte lacunae to be in the range of approximately 2.0 to 7.0 using analytical relationships and assuming isotropic bone material. The strain concentration factor for an elliptical hole in an infinite plate is given by (Peterson, 1974):
where εL is the local strain, εG is the globally applied strain, a is the minor axis of the ellipse, and b is the major axis of the ellipse. Using an average minor axis dimension of 3.86 μm and an average major axis dimension of 8.86 μm, the strain concentration factor is 1.88. This is comparable to the average measured strain concentration factor of between 1.1 and 3.8 over the range of applied macroscopic strain values. The variability in size, shape, and orientation of each osteocyte lacuna will contribute to the variability in the measured strain magnification (Currey, 1962). The presence of canaliculi radiating from the lacuna also will alter the apparent local strain (and therefore the strain concentration factor) as compared to the analytical estimate since the analytical estimate assumes the material is a continuum. If the local tissue stress exceeds the local material yield strength, the analytically predicted strain concentration factor will no longer be valid; actual tissue strains may be much higher depending upon the local tissue post-yield behavior. It has been postulated that the local microstructural organization of collagen fibrils around osteocyte lacunae may act to minimize the stress concentrating effects of the lacunae (Currey, 2003). However, in the present analysis, we make no assumptions regarding the bone matrix constitutive behavior as strains are measured directly.
The patterns of strain concentrations between adjacent lacunae observed in the present investigation (Fig. 6) supports numerical calculations that predict the formation of stress bands between adjacent lacunae (Prendergast and Huiskes, 1996). The bands of strain concentration are also similar to microdamage observed in association with osteocyte lacunae (Reilly, 2000). However, it is not clear whether the observed strain concentration results in microdamage or the presence of microdamage causes the strain concentration.
The observed non-monotonic behavior of the perilacunar strain indicates the redistribution of local tissue stresses as the macroscopic stress is monotonically increased. Stress redistribution could be the result of microdamage formation in the vicinity of the lacuna (Reilly, 2000) resulting in an increase in the local structural compliance associated with opening of local microcracks. This would cause unloading of lacunae adjacent to microcrack faces resulting in a decrease in the local lacunar tissue strain even as the macroscopic strain is increased. This observed local stress redistribution is consistent with numerical predictions of lacunar unloading adjacent to the face of a microcrack (Prendergast and Huiskes, 1996).
The peak tissue strains that were measured in association with lacunae were so large (> 35,000 με) that they demand consideration as to their actual physical meaning. That is, these may not be true continuum tissue strains, but rather a strain-representation of discrete displacements generated by sub-microscopic microstructural deformation. These deformations could be the result of structural deformation (e.g. changes in diameter) of individual or groups of canaliculi. It is conceivable that, due to the abundance of canaliculi, a significant amount of apparent tissue deformation, even at the spatial level investigated here, is the result of microstructural deformation of the canals, which is not optically detectable with our current microscopy system. This structural deformation would result in physical deformation of the osteocyte cell processes located within the canaliculi and thus may provide a stimulus to the osteocyte. These peak strains may also be the result of arrays of sub-micron sized microdamage (Zioupos and Currey, 1994), resulting in a localized increase in apparent tissue compliance.
It has been hypothesized that fluid flow generated stresses and not bone tissue strains are the primary bone cell stimulatory factors in vivo (Cowin et al., 1995; Kufahl and Saha, 1990; Weinbaum et al., 1994). This hypothesis has been supported by results from in vitro cell culture experiments in which bone cells are subjected to either fluid flow generated shear stresses or substrate stretching (Owan et al., 1997; Smalt et al., 1997; You et al., 2000). In these experiments, bone cells do not respond to substrate strain levels equivalent to strains measured in vivo using strain gages. However, these studies and others (Brand et al., 2001; Buckley et al., 1988; Harter et al., 1995) do report increased cell response to much higher substrate strain levels and indicate that there may be a threshold of between 5% and 10% strain to produce a response.
In the present investigation, we have measured peak strains associated with osteocyte lacunae to be over an order of magnitude greater than the maximum in vivo measured continuum strains in bone tissue (Fig. 5b and Fig. 7), consistent with substrate strain levels required to produce bone cell response in in vitro cell culture experiments. However, it is likely that the osteocyte is attached to the lacuna wall via integrins (Aarden et al., 1996), which are much less stiff than the bone matrix and thus the strain signal would be attenuated prior to reaching the cell. Nevertheless, knowledge of bone matrix strain at the spatial resolution of the osteocyte is a more accurate representation of the strain that is potentially transmitted to the cell. While fluid flow generated shear stress may provide more stimulation to bone cells in vitro (and possibly in vivo), it may be incorrect to conclude that mechanical strain (substrate stretching in vitro and tissue deformation in vivo) is not as stimulating to bone cells. Strains applied in vitro in the so-called ‘‘supra-physiological’’ range may not in fact be ‘‘supra physiological’’ based on our current data. The strains applied to cells in vitro should reflect these local tissue strains rather than the global average continuum strains in bone.
Acknowledgments
This work was supported by NIH (NIAMS) Grants AR43785 and AR46798.
References
- Aarden EM, Nijweide PJ, van der Plas A, Alblas MJ, Mackie EJ, Horton MA, Helfrich MH. Adhesive properties of isolated chick osteocytes in vitro. Bone. 1996;18:305–313. doi: 10.1016/8756-3282(96)00010-5. [DOI] [PubMed] [Google Scholar]
- Bousson V, Meunier A, Bergot C, Vicaut E, Rocha MA, Morais MH, Laval-Jeantet AM, Laredo JD. Distribution of intracortical porosity in human midfemoral cortex by age and gender. Journal of Bone and Mineral Research. 2001;16:1308–1317. doi: 10.1359/jbmr.2001.16.7.1308. [DOI] [PubMed] [Google Scholar]
- Brand RA, Stanford CM, Nicolella DP. Primary adult human bone cells do not respond to tissue (continuum) level strains. Journal of Orthopaedic Science. 2001;6:295–301. doi: 10.1007/s007760100051. [DOI] [PubMed] [Google Scholar]
- Buckley MJ, Banes AJ, Levin LG, Sumpio BE, Sato M, Jordan R, Gilbert J, Link GW, Tran ST. Osteoblasts increase their rate of division and align in response to cyclic, mechanical tension in vitro. Bone & Mineral. 1988;4:225–236. [PubMed] [Google Scholar]
- Burr DB, Milgrom C, Fyhrie D, Forwood M, Nyska M, Finestone A, Hoshaw S, Saiag E, Simkin A. In vivo measurement of human tibial strains during vigorous activity. Bone. 1996;18:405–410. doi: 10.1016/8756-3282(96)00028-2. [DOI] [PubMed] [Google Scholar]
- Cowin SC, Weinbaum S, Zeng Y. A case for bone canaliculi as the anatomical site of strain generated potentials. Journal of Biomechanics. 1995;28:1281–1297. doi: 10.1016/0021-9290(95)00058-p. [DOI] [PubMed] [Google Scholar]
- Currey JD. Stress concentrations in bone. Quarterly Journal of Microscopical Science. 1962;103:111–133. [Google Scholar]
- Currey JD. The many adaptations of bone. Journal of Biomechanics. 2003;36:1487–1495. doi: 10.1016/s0021-9290(03)00124-6. [DOI] [PubMed] [Google Scholar]
- Ehrlich PJ, Lanyon LE. Mechanical strain and bone cell function: a review. Osteoporosis International. 2002;13:688–700. doi: 10.1007/s001980200095. [DOI] [PubMed] [Google Scholar]
- Franke EA, Wenzel DL, Davidson DL. Measurement of microdisplacements by machine vision photogrammetry (DISMAP) Review of Scientific Instruments. 1991;62:1270–1279. [Google Scholar]
- Harter LV, Hruska KA, Duncan RL. Human osteoblast-like cells respond to mechanical strain with increased bone matrix protein production independent of hormonal regulation. Endocrinology. 1995;136:528–535. doi: 10.1210/endo.136.2.7530647. [DOI] [PubMed] [Google Scholar]
- Hoffler CE, Moore KE, Kozloff K, Zysset PK, Brown MB, Goldstein SA. Heterogeneity of bone lamellar-level elastic moduli. Bone. 2000;26:603–609. doi: 10.1016/s8756-3282(00)00268-4. [DOI] [PubMed] [Google Scholar]
- Kimmel DB. A paradigm for skeletal strength homeostasis. Journal of Bone and Mineral Research. 1993;8(Suppl2):S515–S522. doi: 10.1002/jbmr.5650081317. [DOI] [PubMed] [Google Scholar]
- Kufahl RH, Saha S. A theoretical model for stress-generated fluid flow in the canaliculi-lacunae network in bone tissue. Journal of Biomechanics. 1990;23:171–180. doi: 10.1016/0021-9290(90)90350-c. [DOI] [PubMed] [Google Scholar]
- Mori S, Burr DB. Increased intracortical remodeling following fatigue damage. Bone. 1993;14:103–109. doi: 10.1016/8756-3282(93)90235-3. [DOI] [PubMed] [Google Scholar]
- Mullender MG, Huiskes R. Proposal for the regulatory mechanism of Wolff’s law. Journal of Orthopaedic Research. 1995;13:503–512. doi: 10.1002/jor.1100130405. [DOI] [PubMed] [Google Scholar]
- Mullender MG, Huiskes R. Osteocytes and bone lining cells: which are the best candidates for mechano-sensors in cancellous bone? Bone. 1997;20:527–532. doi: 10.1016/s8756-3282(97)00036-7. [DOI] [PubMed] [Google Scholar]
- Mullender M, el Haj AJ, Yang Y, van Duin MA, Burger EH, Klein-Nulend J. Mechanotransduction of bone cells in vitro: mechanobiology of bone tissue. Medical and Biological Engineering and Computing. 2004;42:14–21. doi: 10.1007/BF02351006. [DOI] [PubMed] [Google Scholar]
- Nicolella DP, Nicholls AE, Lankford J, Davy DT. Machine vision photogrammetry: a technique for measurement of microstructural strain in cortical bone. Journal of Biomechanics. 2001;34:135–139. doi: 10.1016/s0021-9290(00)00163-9. [DOI] [PubMed] [Google Scholar]
- Owan I, Burr DB, Turner CH, Qiu J, Tu Y, Onyia JE, Duncan RL. Mechanotransduction in bone: osteoblasts are more responsive to fluid forces than mechanical strain. American Journal of Physiology. 1997;273:C810–C815. doi: 10.1152/ajpcell.1997.273.3.C810. [DOI] [PubMed] [Google Scholar]
- Peterson RE. Stress Concentration Factors; Charts and Relations useful in Making Strength Calculations for Machine Parts and Structural Elements. Wiley; New York: 1974. [Google Scholar]
- Pienkowski D, Pollack SR. The origin of stress-generated potentials in fluid-saturated bone. Journal of Orthopaedic Research. 1983;1:30–41. doi: 10.1002/jor.1100010105. [DOI] [PubMed] [Google Scholar]
- Prendergast PJ, Huiskes R. Microdamage and osteocyte-lacuna strain in bone: a microstructural finite element analysis. Journal of Biomechanical Engineering. 1996;118:240–246. doi: 10.1115/1.2795966. [DOI] [PubMed] [Google Scholar]
- Reilly GC. Observations of microdamage around osteocyte lacunae in bone. Journal of Biomechanics. 2000;33:1131–1134. doi: 10.1016/s0021-9290(00)00090-7. [DOI] [PubMed] [Google Scholar]
- Smalt R, Mitchell FT, Howard RL, Chambers TJ. Induction of NO and prostaglandin E2 in osteoblasts by wall-shear stress but not mechanical strain. American Journal of Physiology. 1997;273:E751–E758. doi: 10.1152/ajpendo.1997.273.4.E751. [DOI] [PubMed] [Google Scholar]
- Taylor D, Hazenberg JG, Lee TC. The cellular transducer in damage-stimulated bone remodelling: a theoretical investigation using fracture mechanics. Journal of Theoretical Biology. 2003;225:65–75. doi: 10.1016/s0022-5193(03)00222-4. [DOI] [PubMed] [Google Scholar]
- Weinbaum S, Cowin SC, Zeng Y. A model for the excitation of osteocytes by mechanical loading-induced bone fluid shear stresses. Journal of Biomechanics. 1994;27:339–360. doi: 10.1016/0021-9290(94)90010-8. [DOI] [PubMed] [Google Scholar]
- Weinbaum S, Zhang X, Han Y, Vink H, Cowin SC. Mechanotransduction and flow across the endothelial glycocalyx. Proceedings of the National Academy of Sciences. 2003;100:7988–7995. doi: 10.1073/pnas.1332808100. [DOI] [PMC free article] [PubMed] [Google Scholar]
- Williams DR, Davidson DL, Lankford J. Fatigue-crack-tip plastic strains by the stereoimaging technique. Experimental Mechanics. 1980;20:134–139. [Google Scholar]
- You J, Yellowley CE, Donahue HJ, Zhang Y, Chen Q, Jacobs CR. Substrate deformation levels associated with routine physical activity are less stimulatory to bone cells relative to loading-induced oscillatory fluid flow. Journal of Biomechanical Engineering. 2000;122:387–393. doi: 10.1115/1.1287161. [DOI] [PubMed] [Google Scholar]
- You L, Cowin SC, Schaffler MB, Weinbaum S. A model for strain amplification in the actin cytoskeleton of osteocytes due to fluid drag on pericellular matrix. Journal of Biomechanics. 2001;34:1375–1386. doi: 10.1016/s0021-9290(01)00107-5. [DOI] [PubMed] [Google Scholar]
- Zioupos P, Currey JD. Extent of microcracking and the morphology of microcracks in damaged bone. Journal of Materials Science. 1994;29:978–986. [Google Scholar]


