

Abstract
Aldehyde dehydrogenases catalyze the oxidation of aldehyde substrates to the corresponding carboxylic acids. Lactaldehyde dehydrogenase from E. coli (aldA gene product, P25553) is an NAD+-dependent enzyme implicated in the metabolism of L-fucose and L-rhamnose. During the heterologous expression and purification of taxadiene synthase from the Pacific yew, lactaldehyde dehydrogenase from E. coli was identified as a minor (≤ 5%) side product subsequent to its unexpected crystallization. Accordingly, we now report the serendipitous crystal structure determination of unliganded lactaldehyde dehydrogenase from E. coli determined by the technique of multiple isomorphous replacement using anomalous scattering at 2.2 Å... resolution. Additionally, we report the crystal structure of the ternary enzyme complex with products lactate and NADH at 2.1 Å... resolution, and the crystal structure of the enzyme complex with NADPH at 2.7 Å... resolution. The structure of the ternary complex reveals that the nicotinamide ring of the cofactor is disordered between two conformations: one with the ring positioned in the active site in the so-called “hydrolysis” conformation, and another with the ring extended out of the active site into the solvent region, designated the “out” conformation. This represents the first crystal structure of an aldehyde dehydrogenase-product complex. The active site pocket in which lactate binds is more constricted than that of medium-chain dehydrogenases such as the YdcW gene product of E. coli. The structure of the binary complex with NADPH reveals the first view of the structural basis of specificity for NADH: the negatively charged carboxylate group of E179 sterically and electrostatically destabilizes the binding of the 2′-phosphate group of NADPH, thereby accounting for the lack of enzyme activity with this cofactor.
Keywords: protein crystallography, oxidoreductase, enzyme mechanism, cofactor, carbohydrate metabolism
Introduction
The aldehyde dehydrogenases (ALDH) represent a superfamily of NAD+- or NADP+-dependent enzymes that catalyze the oxidation of aldehydes to the corresponding carboxylic acids.1-4 These enzymes are ancient and widespread in all living systems, from archea to eukaryotes, where they metabolize endogenous and exogenous aldehydes.1 In E. coli, 17 aldehyde dehydrogenases have been identified and categorized to date based on their substrate specificity or sequence similarity.2,3 Two isozymes sharing 33% sequence identity have been identified as products of the genes aldA (P25553)5 and aldB (P37685)6. In particular, the aldA gene encodes an aldehyde dehydrogenase that was first identified as lactaldehyde dehydrogenase by Sridhara and Wu in 1969.7
L-Lactaldehyde (henceforth simply “lactaldehyde”) is generated as an intermediate in the metabolism of L-fucose and L-rhamnose in bacteria that utilize these carbohydrates as a carbon source (Figure 1).8-10 Each of these carbohydrates is metabolized through a similar sequence of permease, isomerase, kinase, and aldolase enzyme-catalyzed reactions.8,9 The 6-deoxyhexoses generated in the last step of each pathway, L-fuculose and L-rhamnulose-1-phosphate, are cleaved to yield identical products, dihydroxyacetone phosphate and lactaldehyde.11 Lactaldehyde is then oxidized to pyruvate in two consecutive steps. First, lactaldehyde dehydrogenase oxidizes lactaldehyde to lactate using NAD+ as cofactor. Lactate dehydrogenase then catalyzes the oxidation of lactate to form pyruvate, which subsequently undergoes decarboxylation and conversion to acetyl CoA for entry into the Krebs cycle in a series of reactions catalyzed by the pyruvate dehydrogenase complex. Alternatively, under anaerobic conditions lactaldehyde is reduced by NADH and L-1,2-propanediol oxidoreductase.8,9,12
Figure 1.

Pathways of L-fucose and L-rhamnose metabolism in E. coli. Lactaldehyde dehydrogenase generates L-lactate, which is subsequently converted to pyruvate for entry into the central metabolic processes of the cell.
In E. coli mutants that utilize lyxose as a carbon source, lactaldehyde dehydrogenase catalyzes the oxidation of the metabolic intermediate glycolaldehyde to glycolate.13-15 Additional evidence suggests that lactaldehyde dehydrogenase may function in multiple metabolic pathways due to its ability to oxidize a variety of small α-hydroxyaldehyde substrates.14 Accordingly, lactaldehyde dehydrogenase is generally classified as an aldehyde dehydrogenase to reflect its apparently broad substrate specificity. Very recently, lactate generated by lactaldehyde dehydrogenase in Methanocaldococcus jannaschii (which shares 33% sequence identity with lactaldehyde dehydrogenase from E. coli) has been implicated in the biosynthesis of coenzyme F420.16
To date, the crystal structures of numerous NAD(P)+-dependent ALDH enzymes have been reported. These include the structures of several mammalian enzymes (rat liver aldehyde dehydrogenase4, bovine mitochondrial aldehyde dehydrogenase17, human mitochondrial aldehyde dehydrogenase18,19, sheep liver aldehyde dehydrogenase20, and rat retinal aldehyde dehydrogenase21) as well as the structure of betaine aldehyde dehydrogenase from cod liver.22 Additionally available are the structures of bacterial enzymes: the NADP+-dependent aldehyde dehydrogenases from Streptococcus mutans23,24 and Vibrio harveyi25, the NAD+/NADP+-dependent aldehyde dehydrogenase from Thermoproteus tenax26, and the NAD+-dependent YdcW gene product of E. coli presumed to be a medium-chain aldehyde dehydrogenase.27 These enzymes exhibit a wide array of differences with regard to substrate and cofactor specificity, and these enzymes are related to lactaldehyde dehydrogenase from E. coli with amino acid sequence identities ranging from 25% to 38%.
Crystal structures of ALDH enzymes are generally consistent with the mechanism proposed for NAD+-dependent aldehyde oxidation.28 For lactaldehyde dehydrogenase, this mechanism involves the nucleophilic attack of an active site cysteine thiolate (C285) at the aldehyde carbonyl of the substrate, followed by collapse of the resulting tetrahedral intermediate with hydride transfer to NAD+; subsequent hydrolysis of the thioester intermediate assisted by a general base (E251) yields product lactate (Figure 2). Interestingly, the thioester intermediate with E268A nonphosphorylating glyceraldehyde-3-phosphate dehydrogenase from S. mutans has been observed in an X-ray crystallographic study.29 In E. coli, lactaldehyde dehydrogenase is produced as a 479-residue protein with a molecular mass of 52.2 kDa. Early reports suggested a dimeric quaternary structure7, whereas more recent data demonstrate that enzyme subunits assemble to form an active tetramer.14,30 Here, we report the X-ray crystal structure of the unliganded lactaldehyde dehydrogenase tetramer at 2.2 Å... resolution. In order to advance our understanding of structure-function relationships, we also report the crystal structures of the ternary complex with products lactate and NADH at 2.1 Å... resolution, and the binary complex with NADPH at 2.7 Å... resolution. Interestingly, the structure of the ternary complex reveals that the nicotinamide ring of NADH occupies two distinct conformations: one with the ring positioned in the active site in the so-called “hydrolysis” conformation defined by Hurley and colleagues31, and another with the ring extended out of the active site into the solvent region (here designated the “out” conformation).
Figure 2.
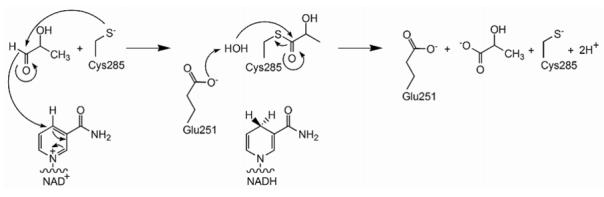
The NAD+-dependent oxidation of lactaldehyde to lactate catalyzed by lactaldehyde dehydrogenase.
Results
Structure of unliganded lactaldehyde dehydrogenase
The asymmetric unit of the unit cell contains one monomer and the symmetry operations corresponding to space group P6422 result in the assembly of an isologous homotetramer in which the four monomers are related by 222 point group symmetry (D2 symmetry) (Figure 3). Tetrameric quaternary structure is consistent with the results of gel filtration chromatography14 and recent ultracentrifugation experiments.30 Each monomer is composed of a catalytic domain (residues from G254 - Q438), a cofactor binding domain (D21 - K96, F442 - E468, and residues in the Rossmann fold, G144 - G253), and an oligomerization domain (residues from Y122 - A142 and Y469 - S479). The Rossmann fold domain4, 17, 32 comprises part of the N-terminal region and creates one wall of the active site (Figure 3a). As expected by Weiner and colleagues based on a homology model of lactaldehyde dehydrogenase30, large patches of hydrophobic surface in addition to the oligomerization domain comprise the subunit interface (Figure 3b).
Figure 3.

(a) Stereoview of the monomer of lactaldehyde dehydrogenase from E. coli. The active site loop containing the presumed catalytic nucleophile, C285, is magenta. The “Rossmann fold” (yellow), oligomerization domain (red), and cofactor binding domain (blue) are indicated. (b) Four monomers of lactaldehyde dehydrogenase assemble to form a tetramer with 222 point group symmetry. Figure generated with Pymol.49
Given the modest sequence identities of 34% and 38% between lactaldehyde dehydrogenase and the aldehyde dehydrogenase from Streptococcus mutans23,24 and the YdcW gene product27, respectively, it is notable that the overall tertiary and quaternary structures of these enzymes are quite similar. The root-mean-square (r.m.s.) deviations of the overall structure (362 monomer Cα atoms, excluding the oligomerization domain, Y122 - A142 and Y469 - S479) between lactaldehyde dehydrogenase and the aldehyde dehydrogenase from S. mutans (PDB accession code 1euh) and the YdcW gene product (PDB accession code 1wnd) are 1.24 Å... and 1.18 Å..., respectively, and the greatest structural differences are observed for segments corresponding to lactaldehyde dehydrogenase residues Y341 - Y365 and Q419 - K431. The Y341 - Y365 segment is a solvent-exposed loop, and the Q419 - K431 segment makes several intersubunit interactions. The oligomerization domain (residues Y122 - A142 and Y469 - S479) is highly divergent (as in other ALDH structures) and exhibits r.m.s. deviations of 2.36 Å... and 3.68 Å..., respectively, between lactaldehyde dehydrogenase and the bacterial dehydrogenases.
Structure of the lactaldehyde dehydrogenase-NADH-lactate complex
The crystal structure of lactaldehyde dehydrogenase in the ternary complex with NADH and lactate is very similar to the structure of the unliganded enzyme. This is the first reported structure of an ALDH enzyme-products complex. The r.m.s. deviation of the overall structure between the ternary complex and the unliganded structure (excluding Y122 - A142 and Y469 - S479 of the oligomerization domain) is 0.32 Å... for 362 monomer Cα atoms, and the greatest structural difference is observed for the A272 - A288 segment. This segment corresponds to the active site loop of lactaldehyde dehydrogenase and its alternative conformation is the result of either product binding or moderate disorder.
The active site of lactaldehyde dehydrogenase resides in a tunnel that is in the approximate shape of an hourglass, or two opposing and connected funnels, approximately ∼6 Å... wide at the narrowest section (Figure 4). The catalytic nucleophile C285 is located in this narrow section, suggesting that the substrate approaches the active site through one funnel and the cofactor approaches the active site through the opposite funnel. The side chain of C285 donates a hydrogen bond to the catalytic general base, E251. Lactate binds in the narrowest part of the “substrate funnel”; that the substrate funnel is somewhat constricted may contribute to the specificity for smaller aliphatic and α-hydroxyaldehyde substrates.14,30 The NADH cofactor binds in the wider midsection of the “cofactor funnel” (Figures 4 and 5), which contains two well-defined pockets: one pocket accommodates the adenosine and the first ribose group, and the other pocket accommodates the nicotinamide ring in the “hydrolysis” conformation (Figure 5b). The nicotinamide ring of NADH in the “out” conformation is more solvent exposed (Figure 5a). Electron density corresponding to the nicotinamide ring is rather weak and discontinuous in both conformations, which suggests significant disorder (Figure 6a). The “hydride transfer” conformation of the nicotinamide ring required for catalysis is modeled by comparison with the structure of the human mitochondrial aldehyde dehydrogenase-NAD+ complex (Figure 5c).18
Figure 4.

Cross-section of the active site of lactaldehyde dehydrogenase in the ternary complex with NADH and lactate, color-coded as follows: carbon (yellow), oxygen (red), nitrogen (blue), phosphorus (lime). The active site tunnel is shaped approximately like an hourglass, or two opposing funnels connected at their narrow ends. The catalytic nucleophile (C285) and general base (E251) are located at the narrowest part of the active site tunnel. The product L-lactate binds in the “substrate funnel” and NADH binds in the “cofactor funnel”.
Figure 5.

View looking into the “cofactor funnel” in the active site of lactaldehyde dehydrogenase in the ternary complex with NADH (stick figure) and lactate (ball-and-stick figure), color-coded as follows: carbon (yellow), oxygen (red), nitrogen (blue), phosphorus (lime). Substrate binding and product dissociation is presumed to occur through a distinct “substrate funnel” (not visible in the current view; see Figure 4). The nicotinamide ring of NADH is observed in the “out” conformation (50% occupancy) (a) and the “hydrolysis” conformation (50% occupancy) (b). The nicotinamide ring of NADH is modeled in the catalytically productive “hydride transfer” conformation (c) based on analysis and comparison with the structure of the human mitochondrial aldehyde dehydrogenase-NAD+ complex (PDB accession code 1cw3).18
Figure 6.

Lactaldehyde dehydrogenase-NADH-lactate complex, showing that the nicotinamide ring of the cofactor is disordered between “hydrolysis” and “out” conformations. (a) Simulated annealing omit maps of NADH (blue) and lactate (red) contoured at 3.0 σ and 2.3 σ, respectively. Atoms are color-coded as follows: carbon (yellow), oxygen (red), nitrogen (blue), phosphorus (lime). NADH and lactate are color-coded as follows: carbon (yellow), oxygen (red), nitrogen (blue), phosphorus (lime). (b) Hydrogen bond interactions in the lactate dehydrogenase-NADH-lactate complex are indicated by green dotted lines.
The NADH cofactor participates in several hydrogen bond interactions (Figure 6b). The adenine A6N amino group donates a hydrogen bond to water molecule #135, and adenine A1N accepts a hydrogen bond from the side chain of Q214. Ribose hydroxyl groups AO2 and AO3 accept hydrogen bonds from the side chain of K176; additionally, hydroxyl group AO3 donates a hydrogen bond to the backbone carbonyl of L150, and hydroxyl group AO2 donates a hydrogen bond to E179. The diphosphate AO5 phosphoester oxygen accepts a hydrogen bond from water molecule #128, which in turn hydrogen bonds to S178. The diphosphate AO1 oxygen accepts a hydrogen bond from S230 and the diphosphate O3 oxygen accepts a hydrogen bond from the backbone NH group of S230. The diphosphate NO1 and NO2 oxygen atoms accept hydrogen bonds from the backbone NH group of W152 and water molecule #128 when the cofactor is in the “out” and “hydrolysis” conformations, respectively. With the nicotinamide ring in the “out” conformation, ribose hydroxyl groups NO2 and NO3 accept hydrogen bonds from R336; in the “hydrolysis” conformation, hydroxyl group NO2 can donate a poorly-oriented hydrogen bond to E383. The NN7 moiety of the carboxamide group in the “hydrolysis” conformation donates a hydrogen bond to the backbone carbonyl of G254. In the “out” conformation, NN7 hydrogen bonds with E179 and water molecule #205, and carboxamide oxygen NO7 accepts a hydrogen bond from water molecule #118.
Although product inhibition has not been reported for lactaldehyde dehydrogenase30, it is not unexpected that soaking enzyme crystals with excess concentrations of lactate and NADH results in the observation of a crystalline enzyme-product complex in which the lactate occupancy refines to 0.52. The hydroxyl group of lactate donates a hydrogen bond to E251, and the lactate carboxylate group accepts hydrogen bonds from R161, H449, N286, and E443 (presumably protonated) as shown in Figure 6b. The position and conformation of lactate that best fits the electron density orients its carboxylate group away from the disordered side chain of C285 (Figure 6a), but this orientation is not that expected to immediately result from the deacylation step shown in Figure 2. Instead, this orientation may correspond to that of a product release step, in which the negatively-charged carboxylate is oriented toward bulk solvent. Reorientation of lactate such that its carboxylate group is adjacent to C285 results in a poorer fit to the electron density map - the tetrahedral CH(CH3)OH group is sufficiently larger than the planar CO2- group that either the methyl group or the hydroxyl group would protrude from the “CO2- end” of the electron density envelope of lactate. Even so, given the 2.1 Å... resolution of the structure determination and the partial occupancy of lactate binding, it cannot be ruled out that the observed electron density envelope reflects some mixture of both orientations of lactate.
The nicotinamide ring of the NAD+/NADH cofactor typically occupies the “hydrolysis” or “hydride transfer” conformations in the active sites of other ALDH enzymes as discussed by Hurley and colleagues19,33; the “hydride transfer” conformation is required for the first step of catalysis.19,29,33 However, prior to the current work, the “out” conformation of the nicotinamide ring of NADH has been observed only in monomer C of the YdcW gene product (PDB accession code: 1wnb).27 The “out” conformation, with an estimated occupancy of ∼50%, may represent a product release conformation (as well as an initial binding conformation) for the enzyme-cofactor complex. As noted above, the ∼50% occupancy of bound lactate oriented as shown in Figure 6 may similarly correspond to a product release step. It is intriguing to speculate that the release conformation of the cofactor could be triggered by the release conformation of the product, or vice versa.
Parenthetically, we note that our attempts to determine the crystal structure of the lactaldehyde dehydrogenase-NAD+ complex were unsuccessful. Electron density maps of this complex revealed only partial density for the cofactor. In other systems, the addition of Mg2+ or Sm3+ can improve the electron density for a bound cofactor.19 However, this approach did not improve the electron density of NAD+ bound to lactaldehyde dehydrogenase so we did not proceed further with this study.
Structure of the lactaldehyde dehydrogenase-NADPH complex
The crystal structure of lactaldehyde dehydrogenase in the binary complex with NADPH is very similar to that of the enzyme in the ternary complex with NADH and lactate. The r.m.s. deviation of 471 monomer Cα atoms between the binary and ternary complexes (including the oligomerization domain) is 0.34 Å..., and the greatest structural difference is observed for the active site loop segment A272 - A288. The nicotinamide ring of the NADPH cofactor is characterized by weak electron density but clearly adopts the “out” conformation (Figure 7a). A notable difference in comparison with the structure of the ternary complex is that the E179 carboxylate group moves ∼3 Å... to avoid the negatively charged 2′-phosphate group of NADPH (Figure 7b). Interestingly, the total number of enzyme-NADPH hydrogen bond interactions is less than that observed for the binding of NADH. The NADPH cofactor participates in hydrogen bond interactions involving K176, E179, L150, W152, G209, N330 and water molecule #4, as depicted in Figure 7. The 2′-phosphate group appears to force the ribose to rotate slightly in comparison to that of NADH, such that ribose hydroxyl groups NO2 and NO3 do not donate hydrogen bonds to R336. The AOP1 and AOP2 oxygen atoms of the 2′-phosphate group accept hydrogen bonds from the backbone NH groups of E179 and G209, respectively, and the 2′-phosphoester oxygen AO2 accepts a hydrogen bond from K176. The ribose AO3 hydroxyl group accepts hydrogen bonds from K176 and the backbone carbonyl of L150, and the ribose NO2 hydroxyl group accepts a hydrogen bond from N330. Diphosphate oxygen atoms AO1 accepts a hydrogen bond from the side chain of S230, and the side chain NH group of W152 is a bifurcated hydrogen bond donor to diphosphate oxygens NO1 and NO5. Adenine A1N accepts a hydrogen bond from the side chain of Q214.
Figure 7.

Lactaldehyde dehydrogenase-NADPH complex. (a) Simulated annealing omit map of NADPH contoured at 2.6 σ. Atoms are color-coded as follows: carbon (yellow), oxygen (red), nitrogen (blue), phosphorus (lime). (b) Hydrogen bond interactions in the lactate dehydrogenase-NADPH complex are indicated by green dotted lines. The side chain of E179 is also shown in its conformation observed in the ternary complex with NADH and lactate (magenta) to illustrate the E179 movement caused by the 2′-phosphate group of NADPH.
The current structure provides the first view of the contribution of E179 to the structural basis of specificity for NADH over NADPH in lactaldehyde dehydrogenase. Electrostatic repulsion between E179 and the 2′-phosphate group of NADPH, as well as the conformational change of E179 (Figure 7), likely account for the 50-fold lower affinity of NADP+ (Kd = 6.25 mM) compared with NAD+ (Kd = 0.12 mM) for binding to lactaldehyde dehydrogenase.14 Additionally, the loss of hydrogen bond interactions and the slight reorientation of the cofactor in the NADPH complex (Figure 7) compared with the NADH complex (Figure 6) likely account for the recent observation that lactaldehyde dehydrogenase is completely inactive with NADP+ as a cofactor.30
Discussion
The crystal structures of unliganded lactaldehyde dehydrogenase, its ternary complex with NADH and lactate, and its binary complex with NADPH reveal that cofactor flexibility in the constricted active site must play a significant role in the mechanism of oxidation of lactaldehyde to lactate, in accord with recently reported studies of cofactor binding to human mitochondrial aldehyde dehydrogenase by Perez-Miller and Hurley.19 In binding to lactaldehyde dehydrogenase, the nicotinamide ring of NADH occupies the “hydrolysis” and the “out” conformations, while that of NADPH is found exclusively in the “out” conformation. Sequential equilibria between these conformations, “hydride transfer” ⇔ “hydrolysis” ⇔ “out”, are required for catalysis.19,33 The superposition of NAD(H)/NADP(H) cofactor conformations bound to different dehydrogenase structures illustrates these three conformations (Figure 8).
Figure 8.

Stereoviews of NAD(P)/NAD(P)H conformations bound to ALDH enzymes. Molecules are color-coded and labeled with PDB accession codes corresponding to the coordinates of each enzyme-cofactor complex. For clarity, only one cofactor is shown from structures containing more than one enzyme complex in the asymmetric unit. (a) Superposition of NAD(P)(H) cofactors in “hydride transfer” conformations from aldehyde dehydrogenase structures contained in the PDB. (b) “Hydrolysis” conformation of NADH bound to lactaldehyde dehydrogenase (red) superimposed on “hydrolysis” conformations of NAD(P)H cofactors from aldehyde dehydrogenase structures contained in the PDB. The “hydrolysis” conformation of NADH bound to lactaldehyde dehydrogenase is more extended, possibly due to the binding of product lactate in the active site. (c) “Out” conformations of NADH (yellow) and NAPDH (blue) bound to lactaldehyde dehydrogenase superimposed on the “out” conformation of NADH bound to monomer C of the YdcW gene product (green).
During hydride transfer, the nicotinamide ring of the cofactor must be close to the substrate and the nucleophilic cysteine residue; therefore, the nicotinamide ring orientation is generally quite similar among eight different aldehyde dehydrogenase structures (Figure 8a). Following hydride transfer from lactaldehyde to NAD+, the nicotinamide ring must move for E251 to function as a general base to hydrolyze the covalent thioester intermediate. Interestingly, due to the presence of the L-lactate in the active site, the “hydrolysis” conformation of NADH observed in the ternary complex with lactaldehyde dehydrogenase (Figures 5 and 6) differs from the “hydrolysis” conformations of NADH observed in other ALDH structures (Figure 8b). Although the NADH cofactor could adopt a “hydrolysis” conformation comparable to that observed in other dehydrogenases in the absence of substrate/product binding, the product molecule in the active site of lactaldehyde dehydrogenase appears to force the nicotinamide ring of NADH to adopt a more extended “hydrolysis” conformation. Possibly, the “hydrolysis” conformations of NADH observed in other aldehyde dehydrogenase structures might be similarly altered by product binding.
In the final step of the catalytic cycle, the nicotinamide ring must move ∼19 Å... from the “hydrolysis” conformation to the “out” conformation as it is released from the enzyme active site. Comparable “out” conformations to those adopted by the nicotinamide rings of NADH and NADPH in their complexes with lactaldehyde dehydrogenase (Figures 6 and 7) are observed in only one other system, monomer C of the YdcW-NADH complex27 (Figure 8c).
Comparison of the crystal structures of the lactaldehyde dehydrogenase-NADH and -NADPH complexes confirms that the carboxylate side chain of E179 is an important specificity determinant for NADH in this enzyme.6,30 The structures reported herein provide the first view of E179 serving this function in complexes with both cofactors. The negatively charged carboxylate side chain of E179 accepts a hydrogen bond from the 2′-hydroxyl group of NADH (Figure 6b) but repels the negatively charged 2′-phosphate group of NADPH and undergoes a conformational change to minimize this repulsion (Figure 7b). Consequently, fewer enzyme-cofactor hydrogen bond interactions are observed in the enzyme-NADPH complex than in the enzyme-NADH complex (Figures 6b and 7b). In NAD+-dependent oxidoreductases having a Rossmann fold, a glutamate or aspartate residue equivalent to E179 of lactaldehyde dehydrogenase is often a hallmark of specificity for NAD+.6,30,34-36 This acidic residue typically hydrogen bonds with the 2′ and/or 3′-hydroxyl groups of the adenine ribose moiety, as observed in the lactaldehyde dehydrogenase-NADH complex (Figure 6b), and is expected to repel the negatively charged 2′-phosphate group of NADPH. The NADPH-dependent oxidoreductases usually contain the smaller and neutral side chain of threonine (or sometimes serine) at the corresponding position, which better accommodates the bulky 2′-phosphate group of NADPH (e.g., as observed in the S. mutans aldehyde dehydrogenase-NADPH complex23,24).
Interestingly, a similar cofactor swapping experiment has been performed with glyderaldehyde-3-phosphate dehydrogenase from T. tenax, but the structural consequences of cofactor swapping in this system are more subtle than those observed with lactaldehyde dehydrogenase from E. coli. Despite its catalytic specificity for NAD+ (NADP+ is an inhibitor)26, glyceraldehyde-3-phosphate dehydrogenase does not contain a residue corresponding to E179 of lactaldehyde dehydrogenase. Instead, this enzyme contains an isoleucine, I194, that appears to sterically destabilize the 2′-phosphate group of NADPH. Otherwise, the crystal structures of T. tenax glyceraldehyde-3-phosphate dehydrogenase complexed with NAD+ and NADPH reveal an identical number of enzyme-cofactor hydrogen bond interactions in each complex (excluding additional interactions of the 2′-phosphate group of NADPH).26 This contrasts with enzyme-cofactor hydrogen bond differences observed in lactaldehyde dehydrogenase (Figures 6 and 7). Thus, it is important not to oversimplify the structural basis of cofactor specificity in the greater family of aldehyde dehydrogenases: a particular active site residue, even if conserved between two enzymes, may contribute differently to cofactor binding due to other subtle structural differences between the two enzymes, and multiple active site residues may contribute to cofactor specificity when comparisons are made across the enzyme family.30
Considering the broader impact of lactaldehyde dehydrogenase on overall metabolic function, it is interesting to note that biological systems have evolved predominantly to utilize D-carbohydrates for energy metabolism. However, certain bacteria can utilize L-fucose and L-rhamnose as a primary carbon source under conditions of nutrient depletion. The metabolic pathways of these two L-carbohydrates converge with lactate generation catalyzed by lactaldehyde dehydrogenase, and lactate is subsequently converted to pyruvate for entry into the central metabolic processes of the cell (Figure 1).
In humans, L-fucose and L-rhamnose are involved in glycoprotein and glycolipid biosynthesis.38 Additionally, intravenous administration of L-fucose results in nearly complete oxidation to carbon dioxide in humans.39,40 It is striking that, while the pathway of L-fucose catabolism is well understood in microorganisms, it is not fully determined in mammals.39,40 Hypothetically, the ability to degrade L-carbohydrates would require a human homologue of lactaldehyde dehydrogenase to detoxify excessive aldehyde levels.
A search of the human genome (http://ncbi.nih.gov/BLAST) for amino acid sequences similar to that of lactaldehyde dehydrogenase from E. coli yields 86 aldehyde dehydrogenases exhibiting BLAST bit scores ranging from 30-286. By limiting the search to gene products with the same domain structure as lactaldehyde dehydrogenase, 56 enzymes are found with sequence identity ranging 27% - 37%. Among these enzymes, only human liver mitochondrial aldehyde dehydrogenase has been structurally characterized (33% sequence identity with lactaldehyde dehydrogenase)18, but the substrate specificities of other enzymes have been determined, e.g.: succinic semialdehyde dehydrogenase (36% sequence identity), formyltetrahydrofolate dehydrogenase (33% sequence identity), retinal dehydrogenase 2 (32% sequence identity), γ-aminobutyraldehyde dehydrogenase (29% sequence identity), methylmalonate semialdehyde dehydrogenase (37% sequence identity), and pyrroline-5-carboxylate aldehyde dehydrogenase (27% sequence identity). It is intriguing to speculate that perhaps one or more of these homologues of E. coli lactaldehyde dehydrogenase could be involved in L-fucose metabolism in humans.
Materials and methods
Purification of lactaldehyde dehydrogenase
The preparation and purification of E. coli lactaldehyde dehydrogenase was serendipitous. During the heterologous expression in E. coli and purification of taxadiene synthase from the Pacific yew, lactaldehyde dehydrogenase was identified as a ∼5% side product. Lactaldehyde dehydrogenase was co-expressed and co-purified with taxadiene synthase using the method described by Williams and colleagues.41 Briefly, the pBSET vector containing the gene sequence of taxadiene synthase was transformed in E. coli using BL21(DE3) competent cells (Novagen). Following the transformation, single colonies were inoculated in 5 mL Luria-Bertani (LB) media containing 50 μg/mL of kanamycin and allowed to grow overnight. Subsequently, cultures were added to 1 L of LB media containing 50 μg/mL of kanamycin and allowed to grow at 37 °C with shaking (250 rpm) until the optical density reached A600 = 0.5-0.6. The cultures were rapidly cooled to 20 °C, induced with 1 mM isopropyl-1-thio-β-D-galactopyranoside (IPTG), and allowed to grow at 20 °C overnight. Cells were harvested and lysed by sonication in buffer A (25 mM 3-(N- morpholino)-2-hydroxypropanesulfonic acid-HCl (pH 6.8), 10 % glycerol, 2 mM dithiothreitol) supplemented with phenylmethylsulfonyl fluoride. The soluble portion of the lysate was loaded onto a DE52 column equilibrated in buffer A, and eluted with 300 mM NaCl using a linear gradient. Pooled fractions containing lactaldehyde dehydrogenase and taxadiene synthase were directly added to a hydroxyapatite column equilibrated in Buffer A and eluted with 60 mM potassium phosphate (pH 6.8). Pooled fractions containing lactaldehyde dehydrogenase and taxadiene synthase were subsequently added to a BioRad High Q column equilibrated in buffer A and eluted with 500 mM NaCl using a linear gradient. Using SDS-PAGE analysis, a single impurity corresponding to the molecular weight of lactaldehyde dehydrogenase (∼50 kDa) was detected as approximately 5% of the total protein concentration.
Crystallization of lactaldehyde dehydrogenase
The 5% lactaldehyde dehydrogenase impurity in taxadiene synthase protein preparations was crystallized by the hanging drop vapor diffusion method. Briefly, 18 mg/mL protein mixture in buffer A was equilibrated against a precipitant solution of 0.1 M bis-Tris-HCl or Tris-HCl (pH 6.8-7.2) and 2.0 M ammonium sulfate. After 2-3 months, crystals of lactaldehyde dehydrogenase appeared and grew to a maximal size of 70 x 50 x 50 μm3. Crystals of taxadiene synthase did not form using these conditions. Crystals of lactaldehyde dehydrogenase diffracted X-ray to 2.2 Å... resolution at the Advanced Light Source, beamline 8.2.1 (Berkeley, CA), and belonged to space group P6422 with unit cell parameters a = 144 Å..., c = 108 Å...; with one monomer in the asymmetric unit, the Matthew’s coefficient VM = 3.1 Å...3/Da, corresponding to a solvent content of 60%. Due to the small size of the crystals of lactaldehyde dehydrogenase and the high flux of the synchrotron beam, crystal damage affected data collection and likely contributed to the relatively high Rmerge value of 0.118 (Table 2). However, because of the high symmetry of the crystals it was possible to collect a complete data set before crystal decay thwarted data collection. We also considered the possibility that these crystals belonged to space group P64 with one tetramer in the asymmetric unit. However, Rmerge = 0.119 for data reduction in the lower symmetry space group, so we judged that the P6422 space group assignment was correct.
Table 2.
Data collection and refinement statistics
| Lactaldehyde dehydrogenase | Unliganded | NADH-lactate complex | NADPH complex |
|---|---|---|---|
| Resolution, Å | 50 - 2.2 | 50 - 2.1 | 50 - 2.7 |
| Total/unique reflections, > 0 σ(I) | 63,439/32,461 | 67,837/34,320 | 30,815/15,617 |
| Completeness, % (overall/outer shell) | 99.0/99.1 | 93.7/92.8 | 89.6/100 |
| Rmerge (overall/outer shell)a | 0.117/0.529 | 0.122/0.542 | 0.139/0.416 |
| I/σ(I) (overall/outer shell) | 33.6/6.3 | 17.1/3.6 | 22.6/6.9 |
| No. of reflections, work/test | 30,866/1,595 | 31,908/2,412 | 14,526/1,091 |
| R/Rfreeb | 0.222/0.252 | 0.200/0.234 | 0.212/0.253 |
| Protein atomsc | 3,663 | 3,666 | 3,666 |
| Water moleculesc | 109 | 221 | 32 |
| Ligand atomsc | 0 | 92 | 47 |
| Sulfate ionsc | 2 | 2 | 2 |
| R.m.s. deviations | |||
| Bond lengths, Å | 0.006 | 0.006 | 0.007 |
| Bond angles, ° | 1.2 | 1.4 | 1.3 |
| Dihedral angles, ° | 22.7 | 22.6 | 22.0 |
| Improper dihedral angles, ° | 0.81 | 0.94 | 0.97 |
| Mean B values, Å2 | |||
| Protein main chain atoms | 31 | 25 | 30 |
| Protein side chain atoms | 34 | 28 | 32 |
| Solvent | 30 | 27 | 18 |
| Sulfate ions | 68 | 61 | 94 |
| NAD(P)H | --- | 34 | 46 |
| Lactated | --- | 43 | --- |
| Ramachandran plot:e number/percentage of residues with backbone conformations | |||
| Allowed | 376/91.3 | 374/90.7 | 355/86.1 |
| Additionally allowed | 33/ 8.0 | 34/ 8.3 | 49/12.0 |
| Generously allowed | 1/ 0.2 | 1/ 0.2 | 5/ 1.2 |
| Disallowed | 2/ 0.5 | 3/ 0.7 | 3/ 0.7 |
, where I is the observed intensity and is the average intensity calculated for replicate data.
Crystallographic R factor, , for reflections contained in the working set. Free R factor, , for reflections contained in the test set excluded from refinement (8% of total). and are the observed and calculated structure factor amplitudes, respectively.
Per monomer in the asymmetric unit.
Refined lactate occupancy = 0.52.
Ramachandran plot statistics calculated for nonproline and nonglycine residues using PROCHECK.48
Isomorphous heavy atom derivatives were prepared with thimerosal and di-μ-iodobis(ethylenediamine)diplatinum(II) nitrate (PIP) by soaking crystals in precipitant buffer solution supplemented with 3-5 mM heavy metal complexes for 3 days. X-ray fluorescence scans measured from derivatized crystals indicated the presence of the heavy atoms. Diffraction data were collected at the anomalous absorption edges of platinum and mercury on beamline 8.2.1 at the Advanced Light Source. Data reduction was achieved with Denzo and Scalepack.42
Anomalous difference Patterson maps generated with data collected from heavy atom-soaked crystals revealed large peaks corresponding to mercury or platinum. The initial electron density map was phased by multiple isomorphous replacement with the anomalous scattering (MIRAS) of platinum and mercury using software implemented in the program SOLVE.43 Briefly, the platinum derivative collected at a wavelength of 1.053 Å... was designated as the “native” data set (Table 1). Then, 2 data sets were collected from the thimerosal derivative using wavelengths of 1.0093 Å... and 0.9853 Å... (Table 1). The positions of Hg and Pt were determined using data to 3.2 Å... resolution with a phasing figure of merit <m> = 0.49. Following density modification and phase extension to 2.2 Å... resolution, approximately 70% of lactaldehyde dehydrogenase residues were automatically built in to the electron density map using RESOLVE.44 The fold was immediately identified as that of an aldehyde dehydrogenase, and the amino acid sequence read from the electron density map unambiguously corresponded to that of lactaldehyde dehydrogenase from the expression host, E. coli. Since the most closely related E. coli protein, succinate semialdehyde dehydrogenase, is related to lactaldehyde dehydrogenase by only 38% amino acid sequence identity, and since the sequence of succinate semialdehyde dehydrogenase was inconsistent with that read from the electron density map, we concluded that our crystal structure was indeed that of E. coli lactaldehyde dehydrogenase.
Table 1.
Phasing Statistics
| Data set | Thimerosal (Hg) | PIP (Pt) | Figure of merit, <m>a |
|---|---|---|---|
| Resolution (Å) | 50.0 - 2.3 | 50.0 - 2.2 | |
| Reflections measured/unique | 55206/29611 | 74021/39448 | |
| Completeness (%) overall/outer shell | 100/100 | 100/100 | |
| Rmergeb overall/outer shell | 0.125/0.507 | 0.127/0.528 | |
| Number of sites | 1 | 1 | |
| Metal site occupancy | 1.0 | 0.5 | |
| SOLVEc | 0.490 | ||
| RESOLVEd | 0.770 |
Phkl(α) is the total probability of the phase angle (α).47 The figure of merit <m> represents the magnitude of the integral of a two-dimensional vector of unit length, integrated over all phase angles and weighted by the phase probabilities.
, where Ii is the intensity measurement for reflection i, and <Ii> is the mean intensity calculated for reflection i from replicate data.
Calculated with 3.0 Å resolution data.
Calculated with 2.2 Å resolution data.
At this point, the molecular model of lactaldehyde dehydrogenase was refined against data collected from an unliganded enzyme crystal instead of the “native” platinum derivative (Table 2). Iterative cycles of refinement and manual model building using CNS45 and O46, respectively, allowed for the assembly of the complete protein model. Individual atomic B-factors were utilized during refinement. Buffer molecules, ions, and water molecules were included in later cycles of refinement. Data reduction and refinement statistics are recorded in Table 2. A total of 477 of 479 residues per monomer are included in the final model. The V274 - R290 loop containing the presumed catalytic nucleophile, C285, was modeled into weak electron density, indicating a high degree of conformational mobility. The quality of the final model was assessed by using WHAT_CHECK and SFCHECK (http://nihserver.mbi.ucla.edu/SAVS/).
Complexes of lactaldehyde dehydrogenase-NADH-lactate and lactaldehyde dehydrogenase-NADPH
Crystals formed as described above were soaked in a precipitant buffer solution augmented with 30 mM NADH for one day, and then soaked in a precipitant buffer solution containing 30 mM L-lactate and 30 mM NADH for 3 more days (with buffer replenished daily). Crystals were transferred to a 20% sucrose solution and cryo-cooled. Crystals of the lactaldehyde dehydrogenase-NADH-lactate ternary complex yielded diffraction data to 2.1 Å... resolution at Cornell High Energy Synchrotron Source (CHESS, Ithaca, NY), beamline F1. A similar crystal soaking experiment was performed using a precipitation buffer augmented with 30 mM NADPH, and crystals of the lactaldehyde dehydrogenase-NADPH complex diffracted to 2.7 Å... resolution at CHESS, beamline F1. Data reduction was achieved with Denzo and Scalepack.42 The structures of the ternary and binary complexes were solved by difference Fourier methods using the structure of native lactaldehyde dehydrogenase as starting point. Iterative cycles of refinement and model building using CNS45 and O46, respectively, improved each protein structure as monitored by Rfree. Individual atomic B-factors were utilized during refinement. Simulated annealing omit electron density maps calculated in the later stages of refinement clearly revealed cofactor binding: the adenosine rings of NADH or NADPH were well ordered in a single position. However, weak electron density indicated that the nicotinamide ring of NADH was disordered between the “hydrolysis” and “out” conformations, and weak electron density indicated that the nicotinamide ring of NADPH was partially disordered and partially bound in the out conformation.
For the ternary complex, the “hydrolysis” and “out” conformations of the nicotinamide ring were each refined with an occupancy of 0.5. In the final stages of refinement, electron density corresponding to a bound lactate molecule was clearly visible. After fitting lactate into the electron density, alternating cycles of occupancy and restrained individual B factor refinement as implemented in CNS converged to lactate occupancy = 0.52 and B = 43 Å...2 as reported in Table 2. We note that lactate occupancy refined to 0.52 regardless of whether the initial occupancy value was set to 1.0 or 0.5 with initial B = 22 Å...2; if lactate occupancy was held fixed at 0.50, B factor refinement converged to lactate B = 42 Å...2. While it is not quantitatively reliable to refine atomic occupancy and B factors using only 2.1 Å... resolution data, it is clear that lactate binds with partial occupancy. A total of 477 of 479 residues are included in the final model. The V274 - R290 loop containing the presumed catalytic nucleophile, C285, was modeled into weak electron density, indicating a high degree of conformational mobility. Data reduction and refinement statistics are recorded in Table 2.
For the binary complex, the adenosine ring, phosphoribose, and diphosphate moieties of NADPH were visible in electron density maps, but the nicotinamide ring of the cofactor was characterized by weak electron density. A total of 477 of 479 residues per monomer are included in the final model. Data reduction and refinement statistics are recorded in Table 2.
Protein Data Bank accession codes
Coordinates and observed structure factor amplitudes for unliganded lactaldehyde dehydrogenase, its ternary complex with NADH and L-lactate, and its complex with NADPH have been deposited in the Protein Data Bank with accession codes 2HG2, 2IMP, and 2ILU, respectively.
Acknowledgments
We thank the NIH for grant GM56838 in support of this work. Additionally, we thank Profs. Guy Branlant, Thomas Hurley, and Henry Weiner for their insightful comments on the manuscript prior to publication. We also thank the Advanced Light Source (Berkeley, CA) and beamline scientist Dr. Banumathi Sankaran for assistance with data collection, and we thank the Cornell Light Energy Synchrotron (Ithaca, NY) for beamline access. Finally, we thank Heather Gennadios for helpful advice.
Glossary
Abbreviations used:
- NAD+
nicotinamide adenine dinucleotide
- NADP+
nicotinamide adenine dinucleotide phosphate
- ALDH
aldehyde dehydrogenase
- PIP
di-μ-iodobis(ethylenediamine)diplatinum(II) nitrate.
Footnotes
Publisher's Disclaimer: This is a PDF file of an unedited manuscript that has been accepted for publication. As a service to our customers we are providing this early version of the manuscript. The manuscript will undergo copyediting, typesetting, and review of the resulting proof before it is published in its final citable form. Please note that during the production process errorsmaybe discovered which could affect the content, and all legal disclaimers that apply to the journal pertain.
References
- 1.Hempel J, Nicholas H, Lindahl R. Aldehyde dehydrogenases: widespread structural and functional diversity within a shared framework. Protein Sci. 1993;2:1890–1900. doi: 10.1002/pro.5560021111. [DOI] [PMC free article] [PubMed] [Google Scholar]
- 2.Sophos NA, Vasiliou V. Aldehyde dehydrogenase gene superfamily: the 2002 update. Chem. Biol. Interact. 2003;143-144:5–22. doi: 10.1016/s0009-2797(02)00163-1. [DOI] [PubMed] [Google Scholar]
- 3.Perozich J, Nicholas HB, Jr., Wang BC, Lindahl R, Hempel J. The big book of aldehyde dehydrogenase sequences: an overview of the extended family. In: Weiner H, Maser E, Crabb DW, Lindahl R, editors. Advances in Experimental Medicine and Biology. Vol. 463. 1999. pp. 1–8. [DOI] [PubMed] [Google Scholar]
- 4.Liu ZJ, Sun YJ, Rose J, Chung YJ, Hsiao CD, Chang WR, Kuo I, Perozich J, Lindahl R, Hempel J, Wang BC. The first structure of an aldehyde dehydrogenase reveals novel interactions between NAD and the Rossmann fold. Nature Struct. Biol. 1997;4:317–326. doi: 10.1038/nsb0497-317. [DOI] [PubMed] [Google Scholar]
- 5.Hidalgo E, Chen Y-M, Lin EC, Aguilar J. Molecular cloning and DNA sequencing of the Escherichia coli K-12 ald gene encoding aldehyde dehydrogenase. J. Bacteriol. 1991;173:6118–6123. doi: 10.1128/jb.173.19.6118-6123.1991. [DOI] [PMC free article] [PubMed] [Google Scholar]
- 6.Ho KK, Weiner H. Isolation and characterization of an aldehyde dehydrogenase encoded by the aldB gene of Escherichia coli. J. Bacteriol. 2005;187:1067–1073. doi: 10.1128/JB.187.3.1067-1073.2005. [DOI] [PMC free article] [PubMed] [Google Scholar]
- 7.Sridhara S, Wu TT. Purification and properties of lactaldehyde dehydrogenase from Escherichia coli. J. Biol. Chem. 1969;244:5233–5238. [PubMed] [Google Scholar]
- 8.Hacking AJ, Lin EC. Disruption of the fucose pathway as a consequence of genetic adaptation to propanediol as a carbon source in Escherichia coli. J. Bacteriol. 1976;126:1166–1172. doi: 10.1128/jb.126.3.1166-1172.1976. [DOI] [PMC free article] [PubMed] [Google Scholar]
- 9.Hacking AJ, Aguilar J, Lin EC. Evolution of propanediol utilization in Escherichia coli: mutant with improved substrate-scavenging power. J. Bacteriol. 1978;136:522–530. doi: 10.1128/jb.136.2.522-530.1978. [DOI] [PMC free article] [PubMed] [Google Scholar]
- 10.BaldomÅ L, Aguilar J. Metabolism of L-fucose and L-rhamnose in Escherichia coli: aerobic-anaerobic regulation of L-lactaldehyde dissimilation. J. Bacteriol. 1988;170:416–421. doi: 10.1128/jb.170.1.416-421.1988. [DOI] [PMC free article] [PubMed] [Google Scholar]
- 11.Ghalambor MA, Heath EC. The metabolism of L-fucose. II. The enzymatic cleavage of L-fuculose-1-phosphate. J. Biol. Chem. 1962;237:2427–2433. [PubMed] [Google Scholar]
- 12.Montella C, Bellsolell L, Pérez-Luque R, Badía J, Baldomá L, Coll M, Aguilar J. Crystal structure of an iron-dependent group III dehydrogenase that interconverts L-lactaldehyde dehydrogenase and L-1,2-propanediol in Escherichia coli. J. Bacteriol. 2005;187:4957–4966. doi: 10.1128/JB.187.14.4957-4966.2005. [DOI] [PMC free article] [PubMed] [Google Scholar]
- 13.Badía J, Gimenez R, Baldomá L, Barnes E, Fessner W-D, Aguilar J. L-lyxose metabolism employs the L-rhamnose pathway in mutant cells of Escherichia coli adapted to grow on L-lyxose. J. Bacteriol. 1991;173:5144–5150. doi: 10.1128/jb.173.16.5144-5150.1991. [DOI] [PMC free article] [PubMed] [Google Scholar]
- 14.Baldomá L, Aguilar J. Involvement of lactaldehyde dehydrogenase in several metabolic pathways of Escherichia coli K12. J. Biol. Chem. 1987;262:13991–13996. [PubMed] [Google Scholar]
- 15.Caballero E, Baldomá L, Ros J, Boronat A, Aguilar J. Identification of lactaldehyde dehydrogenase and glycolaldehyde dehydrogenase as functions of the same protein in Escherichia coli. J. Biol. Chem. 1983;258:7788–7792. [PubMed] [Google Scholar]
- 16.Grochowski LL, Xu H, White RH. Identification of lactaldehyde dehydrogenase in Methanocaldococcus jannaschii and its involvement in production of lactate for F420 biosynthesis. J. Bacteriol. 2006;188:2836–2844. doi: 10.1128/JB.188.8.2836-2844.2006. [DOI] [PMC free article] [PubMed] [Google Scholar]
- 17.Steinmetz CG, Xie P, Weiner H, Hurley TD. Structure of mitochondrial aldehyde dehydrogenase: the genetic component of ethanol aversion. Structure. 1997;5:701–711. doi: 10.1016/s0969-2126(97)00224-4. [DOI] [PubMed] [Google Scholar]
- 18.Ni L, Zhou J, Hurley TD, Weiner H. Human liver mitochondrial aldehyde dehydrogenase: three-dimensional structure and the restoration of solubility and activity of chimeric forms. Protein Sci. 1999;8:2784–2790. doi: 10.1110/ps.8.12.2784. [DOI] [PMC free article] [PubMed] [Google Scholar]
- 19.Perez-Miller SJ, Hurley TD. Coenzyme isomerization is integral to catalysis in aldehyde dehydrogenase. Biochemistry. 2003;42:7100–7109. doi: 10.1021/bi034182w. [DOI] [PubMed] [Google Scholar]
- 20.Moore SA, Baker HM, Blythe TJ, Kitson KE, Kitson TM, Baker EN. Sheep liver cytosolic aldehyde dehydrogenase: the structure reveals the basis for the retinal specificity of class 1 aldehyde dehydrogenases. Structure. 1998;6:1541–1551. doi: 10.1016/s0969-2126(98)00152-x. [DOI] [PubMed] [Google Scholar]
- 21.Lamb AL, Newcomer ME. The structure of retinal dehydrogenase type II at 2.7 Å... resolution: implications for retinal specificity. Biochemistry. 1999;38:6003–6011. doi: 10.1021/bi9900471. [DOI] [PubMed] [Google Scholar]
- 22.Johansson K, El-Ahmad M, Ramaswamy S, Hjelmqvist L, Jornvall H, Eklund H. Structure of betaine aldehyde dehydrogenase at 2.1 Å... resolution. Protein Sci. 1998;7:2106–2117. doi: 10.1002/pro.5560071007. [DOI] [PMC free article] [PubMed] [Google Scholar]
- 23.Cobessi D, Tete-Favier F, Marchal S, Azza S, Branlant G, Aubry A. Apo and holo crystal structure of an NADP-dependent aldehyde dehydrogenase from Streptococcus mutans. J. Mol. Biol. 1999;290:161–173. doi: 10.1006/jmbi.1999.2853. [DOI] [PubMed] [Google Scholar]
- 24.Cobessi D, Tete-Favier F, Marchal S, Branlant G, Aubry A. Structural and biochemical investigations of the catalytic mechanism of an NADP dependent aldehyde dehydrogenase from Streptococcus mutans. J. Mol. Biol. 2000;300:141–152. doi: 10.1006/jmbi.2000.3824. [DOI] [PubMed] [Google Scholar]
- 25.Ahvazi B, Coulombe R, Delarge M, Vedadi M, Zhang L, Meighen E, Vrielink A. Crystal structure of the NADP+-dependent aldehyde dehydrogenase from Vibrio harveyi: structural implications for cofactor specificity and affinity. Biochem. J. 2000;349:853–861. [PMC free article] [PubMed] [Google Scholar]
- 26.Lorentzen E, Hensel R, Knura T, Ahmed H, Pohl E. Structural basis of allosteric regulation and substrate specificity of the non-phosphorylating glyceraldehyde 3-phosphate dehydrogenase from Thermoproteus tenax. J. Mol. Biol. 2004;341:815–828. doi: 10.1016/j.jmb.2004.05.032. [DOI] [PubMed] [Google Scholar]
- 27.Gruez A, Roig-Zamboni V, Grisel S, Salomoni A, Valencia C, Campanacci V, Tegoni M, Cambillau C. Crystal structure and kinetics identity Escherichia coli YdcW gene product as a medium-chain aldehyde dehydrogenase. J. Mol. Biol. 2004;343:29–41. doi: 10.1016/j.jmb.2004.08.030. [DOI] [PubMed] [Google Scholar]
- 28.Racher E. Mechanism of action and properties of pyridine nucleotide-linked enzymes. Phys. Rev. 1955;35:1–56. doi: 10.1152/physrev.1955.35.1.1. [DOI] [PubMed] [Google Scholar]
- 29.D’Ambrosio K, Pailot A, Talfournier F, Didierjean C, Benedetti E, Aubry A, Branlant G, Corbier C. The first crystal structure of a thioacylenzyme intermediate in the ALDH family: new coenzyme conformation and relevance to catalysis. Biochemistry. 2006;45:2978–2986. doi: 10.1021/bi0515117. [DOI] [PubMed] [Google Scholar]
- 30.Rodrí-guez-Zavala JS, Allali-Hassani A, Weiner H. Characterization of E. coli tetrameric aldehyde dehydrogenases with atypical properties compared to other aldehyde dehydrogenases. Protein Sci. 2006;15:1387–1396. doi: 10.1110/ps.052039606. [DOI] [PMC free article] [PubMed] [Google Scholar]
- 31.Hurley TD, Perez-Miller S, Breen H. Order and disorder in mitochondrial aldehyde dehydrogenase. Chem. Biol. Interact. 2001;130-132:3–14. doi: 10.1016/s0009-2797(00)00217-9. [DOI] [PubMed] [Google Scholar]
- 32.Rossmann MG, Moras D, Olsen KW. Chemical and biological evolution of nucleotide-binding protein. Nature. 1974;250:194–199. doi: 10.1038/250194a0. [DOI] [PubMed] [Google Scholar]
- 33.Hammen PK, Allali-Hassani A, Hallenga K, Hurley TD, Weiner H. Multiple conformations of NAD and NADH when bound to human cytosolic and mitochondrial aldehyde dehydrogenase. Biochemistry. 2002;41:7156–7168. doi: 10.1021/bi012197t. [DOI] [PubMed] [Google Scholar]
- 34.Perozich J, Kuo I, Wang BC, Boesch JS, Lindahl R, Hempel J. Shifting the NAD/NADP preference in class 3 aldehyde dehydrogenase. Eur. J. Biochem. 2000;267:6197–6203. doi: 10.1046/j.1432-1327.2000.01697.x. [DOI] [PubMed] [Google Scholar]
- 35.Didierjean C, Rahuel-Clermont S, Vitoux B, Dideberg O, Branlant G, Aubry A. A crystallographic comparison between mutated glyceraldehyde-3-phosphate dehydrogenases from Bacillus stearothermophilus complexed with either NAD+ or NADP+ J. Mol. Biol. 1997;268:739–759. doi: 10.1006/jmbi.1997.0998. [DOI] [PubMed] [Google Scholar]
- 36.Carugo O, Argos P. NADP-dependent enzymes. I: Conserved stereochemistry of cofactor binding. Proteins: Struct. Funct. Genet. 1997;28:10–28. doi: 10.1002/(sici)1097-0134(199705)28:1<10::aid-prot2>3.0.co;2-n. [DOI] [PubMed] [Google Scholar]
- 37.Hempel J, Kuo I, Perozich J, Wang B-C, Lindahl R, Nicholas H. Aldehyde dehydrogenase. Maintaining critical active site geometry at motif 8 in the class 3 enzyme. Eur. J. Biochem. 2001;268:722–726. doi: 10.1046/j.1432-1327.2001.01926.x. [DOI] [PubMed] [Google Scholar]
- 38.Becker DJ, Lowe JB. Fucose: biosynthesis and biological function in mammals. Glycobiology. 2003;13:41R–53R. doi: 10.1093/glycob/cwg054. [DOI] [PubMed] [Google Scholar]
- 39.Segal S, Topper YJ. On the biosynthesis of L-fucose and L-fucose metabolism in man. Biochem. Biophys. Acta. 1960;42:147–151. doi: 10.1016/0006-3002(60)90761-7. [DOI] [PubMed] [Google Scholar]
- 40.Chan JY, Nwokoro NA, Schachter H. L-fucose metabolism in mammals. The conversion of L-fucose to two moles of L-lactate, of L-galactose to L-lactate and glycerate, and of D-arabinose to L-lactate and glycollate. J. Biol. Chem. 1979;254:7060–7068. [PubMed] [Google Scholar]
- 41.Williams DC, Wildung MR, Jin AQ, Dalal D, Oliver JS, Coates RM, Croteau R. Heterologous expression and characterization of a “pseudomature” form of taxadiene synthase involved in paclitaxel (Taxol) biosynthesis and evaluation of a potential intermediate and inhibitors of the multistep diterpene cyclization reaction. Arch. Biochem. Biophys. 2000;379:137–146. doi: 10.1006/abbi.2000.1865. [DOI] [PubMed] [Google Scholar]
- 42.Otwinowski Z, Minor M. Processing of X-ray diffraction data collected in oscillation mode. Methods Enzymol. 1997;276:307–326. doi: 10.1016/S0076-6879(97)76066-X. [DOI] [PubMed] [Google Scholar]
- 43.Terwilliger TC, Berendzen J. Automated MAD and MIR structure solution. Acta Crystallog. sect. D. 1999;55:849–861. doi: 10.1107/S0907444999000839. [DOI] [PMC free article] [PubMed] [Google Scholar]
- 44.Terwilliger TC. Maximum-likelihood density modification. Acta Crystallog. sect. D. 2000;56:965–972. doi: 10.1107/S0907444900005072. [DOI] [PMC free article] [PubMed] [Google Scholar]
- 45.Brünger AT, Adams PD, Clore GM, DeLano WL, Gros P, Grosse-Kunstleve RW, Jiang JS, Kuszewski J, Nilges M, Pannu NS, Read RJ, Rice LM, Simonson T, Warren GL. Crystallography & NMR System: A new software suite for macromolecular structure determination. Acta Crystallog. sect. D. 1998;54:905–921. doi: 10.1107/s0907444998003254. [DOI] [PubMed] [Google Scholar]
- 46.Jones TA, Zou J-Y, Cowan SW, Kjeldgaard M. Improved methods for building protein models in electron density maps and the location of errors in these models. Acta Crystallog. sect. A. 1991;47:110–119. doi: 10.1107/s0108767390010224. [DOI] [PubMed] [Google Scholar]
- 47.Blundell TL, Johnson LN. Protein Crystallography. Academic Press Inc.; London: 1976. pp. 364–371. [Google Scholar]
- 48.Laskowski RA, MacArthur MW, Moss DS, Thornton JM. PROCHECK: a program to check the stereochemical quality of protein structures. J. Appl. Cryst. 1993;26:283–291. [Google Scholar]
- 49.DeLano WL. 2002 The PyMOL Molecular Graphics System on World Wide Web http://www.pymol.org.