

Abstract
Eg5/KSP is a homotetrameric, Kinesin-5 family member whose ability to cross-link microtubules has associated it with mitotic spindle assembly and dynamics for chromosome segregation. Transient-state kinetic methodologies have been used to dissect the mechanochemical cycle of a dimeric motor, Eg5-513, to better understand the cooperative interactions that modulate processive stepping. Microtubule association, ADP release, and ATP binding are all fast steps in the pathway. However, the acid-quench analysis of the kinetics of ATP hydrolysis with substrate in excess of motor was unable to resolve a burst of product formation during the first turnover event. In addition, the kinetics of Pi release and ATP-promoted microtubule-Eg5 dissociation were observed to be no faster than the rate of ATP hydrolysis. In combination the data suggest that dimeric Eg5 is the first kinesin motor identified to have a rate-limiting ATP hydrolysis step. Furthermore, several lines of evidence implicate alternating-site catalysis as the molecular mechanism underlying dimeric Eg5 processivity. Both mantATP binding and mantADP release transients are biphasic. Analysis of ATP hydrolysis through single turnover assays indicates a surprising substrate concentration dependence, where the observed rate is reduced by half when substrate concentration is sufficiently high to require both motor domains of the dimer to participate in the reaction.
Eg5 is a member of the homotetrameric, Bim C/Kinesin-5 family. Members of this family function during mitosis and provide a plus-end directed force that has become associated with bipolar spindle assembly, spindle maintenance, and microtubule (MT)2 flux (1-10). The function of Eg5 in the mitotic spindle has been shown to be indispensable. Perturbation of its function prior to anaphase B by either antibody (1, 11) or small molecule inhibitors (12-23) causes collapse of the bipolar spindle into a monoaster and leads to apoptosis in cells with intact spindle checkpoint machinery (24, 25). As a result Eg5 has garnered substantial interest as a potential chemotherapeutic target in cancer treatment.
Mechanistically, the ATPase cycle of monomeric Eg5 motor domains are fairly well understood both free in solution and bound to MTs (26-33). Off the MT, monomeric Eg5 demonstrates weak ATP binding and has a propensity to form a non-productive Eg5 ATP complex (31). However, on the MT, ATP binding is tight, substrate productively proceeds through ATP hydrolysis, and the rates of all the individual steps in the mechanochemical cycle are accelerated (30). The MT-activated ATPase cycle concludes with a conformational change of the motor domain in relation to the MT, termed “rolling” (29), followed by the rate-limiting event in the cycle, the coupled action of phosphate (Pi) release, and motor detachment from the MT (29, 30, 33).
In vivo the individual Eg5 motor domains probably do not function independently; therefore, analysis of a higher order oligomeric structure is necessitated. Indeed, previous analysis of dimeric Eg5, Eg5-513, has indicated that two conjoined motor domains exhibit cooperativity in vitro (34, 35). In comparison to a single Eg5 motor domain, the steady-state ATPase of Eg5-513 is reduced 10-fold suggesting the physical attachment of two motor domains causes a reciprocal modulation of each enzymatic cycle (34). Also, a His5-tagged form of Eg5-513 has displayed processivity in single molecule studies (35), strongly suggesting that dimeric Eg5, like other kinetically characterized dimeric kinesins, is able to maintain the ATPase cycles of its motor domains out of phase to facilitate processive stepping. To begin to dissect the nature of these cooperative interactions, a mechanistic analysis of the individual steps in the ATPase cycle has been employed. Like conventional kinesin (36-39), dimeric Eg5 alternates the catalysis of its motor domains to allow for processive movement along the MT. However, dimeric Eg5 is the first kinesin motor found to have its ATPase cycle limited by ATP hydrolysis during a processive run.
EXPERIMENTAL PROCEDURES
Experimental Conditions
All experiments were performed in ATPase buffer: 20 mM Hepes, pH 7.2, with KOH, 5 mM magnesium acetate, 0.1 mM EDTA, 0.1 mM EGTA, 50 mM potassium acetate, 1 mM dithiothreitol at room temperature (25 °C). The listed MT concentrations represent the concentration of αβ-tubulin heterodimer that has been polymerized. Paclitaxel (Taxol) in Me2SO was used throughout to stabilize the MT polymer. For experiments in which a MT·Eg5-513 complex was treated with apyrase, the complex was incubated with 0.02 unit/ml apyrase (Grade VII, Sigma-Aldrich) for 20 min. Apyrase treatment was performed for 1 h when Eg5-513 was free in solution, because ADP release is slowed significantly in the absence of MTs. Apyrase converts free ADP to AMP plus Pi. However, the affinity of Eg5-513 for AMP is so weak that apyrase treatment effectively generates a nucleotide-free state for Eg5 (data not shown). Apyrase-treated Eg5-513 was fully active based on MT binding (34) and steady-state ATP turnover (data not shown).
Expression and Purification
Eg5-513 was expressed in Escherichia coli and purified by MT affinity as described previously (34). Concentrations for Eg5-513 are reported as single motor head concentrations.
MantATP Binding
The MT·Eg5 complex was first treated with apyrase to produce the nucleotide-free state of the motor. After treatment the complex was rapidly mixed with racemic mantATP in the KinTek SF2003 stopped-flow (KinTek Corp., Austin, TX), and an increase in fluorescence was monitored (λex = 360 nm, λem = 460 nm, 400 nm long pass filter). The fluorescence enhancement was biphasic, and the data were best fit to two exponential functions. Experiments were also performed with 3′-mant-2′-dATP to determine whether the biphasic nature of the transients observed with racemic mantATP was due to the mixture of the 2′- and 3′-mantATP isomers. The kinetics of 3′-mant-2′-dATP binding were also biphasic and comparable to the kinetics with the racemic mantATP purchased from Invitrogen Molecular Probes (data not shown).
The rate of the observed fluorescence enhancement for the initial exponential phase was dependent on the mantATP concentration. These data followed a hyperbolic function (Fig. 1B), which is indicative of two-step substrate binding with a rapid equilibrium to form the collision complex followed by an isomerization to the species that is competent for ATP hydrolysis. The data in Fig. 1B were fit to Equation 1,
| (Eq. 1) |
where K1 represents the equilibrium association constant for formation of the collision complex (Kd = 1/K1), and k+1 ′ is the maximum rate of the first-order isomerization. The second-order rate constant for mantATP binding is equal to K1k+′, and the y-intercept defines the dissociation rate, k−1′.
FIGURE 1.

MantATP binding kinetics. An MT·Eg5-513 complex was first treated with apyrase and then rapidly mixed with MgMantATP in the stopped-flow instrument. Final concentrations after mixing were 0.5 μm Eg5-513/8 μm MTs for 0.5–4 μm MgMantATP and 2.5 μm Eg5-513/8 μm MTs for 4–50 μm MgMantATP. A, the averaged fluorescence transients for the listed MgMantATP concentrations. B, each transient was fit to a double exponential function, and the observed rate of fluorescence enhancement for the first exponential is plotted as a function of mantATP concentration. The data display a hyperbolic dependence and were fit to Equation 1 with K1 = 0.11 ± 0.02 μm−1, k+1′= 54 ± 2 s−1 and apparent Kd, mantATP = 9.4 μm. B, inset, shows the linearity of the data at low substrate concentrations. C, the observed rates of the second exponential phase also display a linear dependence with respect to the mantATP concentration range examined. The data were fit to Equation 2, which provided an apparent second-order rate constant of mantATP binding of 0.14 ± 0.01 μm−1 s−1. C, inset, a representative transient, 0.5 μm Eg5-513/8 μm MTs and 0.5 μm MantATP, displaying the completion of both exponential phases. The amplitude of the initial fast phase is equal to the amplitude of the second phase with the corresponding rates of 0.41 s−1 and 0.12 s−1 for the fast and slow phases, respectively.
The second phase of the mantATP transients showed a linear increase in rate with an increase in mantATP concentration (Fig. 1C). These data were fit to the following function,
| (Eq. 2) |
where kobs is the observed exponential rate of the fluorescence enhancement, kon is the second-order rate constant of nucleotide binding, and koff is the dissociation rate obtained from the y-intercept.
Pulse-Chase Measurement of ATP Binding
Preformed MT·Eg5 complexes were rapidly mixed with MgATP plus trace [α-32P]ATP in the KinTek chemical quench-flow instrument for a set time and chased with an excess of nonradioactive MgATP (10 mM final). The reaction was allowed to proceed for 10 half-lives and quenched with formic acid. [α-32P]ADP and Pi were separated from ATP using thin layer chromatography and quantified using Image Gauge V4.0 software (Fuji Photo Film). The individual transients were fit to the burst equation,
| (Eq. 3) |
where A is the amplitude of the initial burst of product formation on the active site during the first turnover, t is the time in seconds, kb is the rate constant of the exponential burst, and kslow is the rate of subsequent ATP-binding events.
Acid-quench Experiments
A preformed MT·Eg5 complex was rapidly mixed with MgATP plus trace [α-32P]ATP in the quench-flow instrument. At varying times of incubation, reactions were quenched with 5 M formic acid, and product formation was both resolved and quantified in the same manner as described for the pulse-chase experiments. Single turnover experiments were performed with Eg5-513 active sites in excess of MgATP concentration. The data from these experiments were fit to a single exponential function.
Phosphate Release
A solution containing a preformed MT·Eg5 complex and the MDCC-labeled phosphate-binding protein from E. coli (MDCC-PBP) (38, 40) was rapidly mixed with MgATP in the stopped-flow instrument (λex = 425 nm, λem = 466 nm, 450 nm long pass filter). Final concentrations were as follows: 0.5 μm Eg5-513, 4 μm MTs, 20 μm Taxol, 5 μm MDCC-PBP, and varying concentrations of MgATP. In this assay, Pi liberated from the hydrolysis of ATP to ADP·Pi will be rapidly and tightly bound by the MDCC-PBP, eliciting a fluorescence increase (40). To remove any Pi present in the buffer that is not a result of an enzymatic event, all solutions were supplemented with a “Pi Mop” (0.05 unit/ml bacterial purine nucleoside phosphorylase plus 0.5 mM 7-methylguanosine) and incubated at 25 °C for at least 30 min prior to experimentation. The fluorescence amplitude was converted to Pi concentration using a KH2PO4 standard curve generated on the day of the experiment (41). Single turnover experiments were also performed with Eg5-513 active sites in excess of MgATP concentration. An MT·Eg5-513 complex (30 μm Eg5-513, 40 μm MTs, and 40 μm Taxol) was treated with apyrase, and the complex was sedimented (Beckman-Coulter Optima TLX Ultracentrifuge, TLA 100 rotor, 100 × g for 30 min) to remove the apyrase, AMP, and Pi that partitioned to the supernatant. The MT pellet was then resuspended in ATPase buffer supplemented with the Pi Mop and incubated at 25 °C for 20 min. The solution was adjusted to 40 μm MDCC-PBP and incubated at 25 °C for 1 h. During resuspension, recovery of the MT·Eg5-513 complex was assumed to be 100%. To determine the concentration of Eg5-513 present following centrifugation, SDS-PAGE was performed to compare the experimental sample with an Eg5-513 standard curve.
Dissociation of the MT·Eg5-513 Complex
MT·Eg5-513 complex dissociation was observed by monitoring a decrease in turbidity (λ = 340 nm) in the stopped-flow instrument. A preformed MT·Eg5-513 complex was rapidly mixed with MgAXP (magnesium with ATP, ADP, ATPγS, or AMPPNP). Kinetic measurements of the rate of MT·Eg5 complex dissociation were performed as a function of MgATP. The observed exponential rates were plotted and hyperbolically fit. For dissociation experiments, an additional 200 mM KCl (100 mM final) was added to the nucleotide syringe to weaken and therefore slow motor rebinding to the MT. Dissociation of the MT·Eg5-513 complex was also evaluated by mixing motor with MTs plus MgATP without additional salt.
Formation of the MT·Eg5-513 Complex
The pre-steady-state kinetics of MT·Eg5-513 association were determined by monitoring an increase in turbidity (λ = 340 nm) in the stopped-flow instrument. Apyrase-treated or untreated Eg5-513 was mixed with increasing MT concentrations. The rates of the exponential phase of each transient were plotted as a function of MT concentration and fit to the following linear equation,
| (Eq. 4) |
where kobs is the rate of the exponential change in turbidity, kassoc is the second-order rate constant of complex formation (k+4), and koff is defined by the y-intercept.
MantADP Release
Measurements of the rate of ADP release from Eg5-513 triggered by the formation of the MT·Eg5-513 complex were performed by first incubating Eg5-513 with mantADP racemate at a 1:1 stoichiometry. The Eg5-513·mantADP complexes were subsequently mixed with increasing amounts of MTs plus 1 mM MgATP, and a decrease in mantADP fluorescence was monitored (λex = 360 nm, λem = 460 nm, 400 nm long pass filter). The observed exponential rate constants were then fit to a hyperbola.
RESULTS
MantATP Binding
The rate of substrate binding by dimeric Eg5 was pursued by two methods: monitoring the fluorescence enhancement of mantATP binding to Eg5-513 (Fig. 1) and pulse-chase analysis (Fig. 2). A preformed MT·Eg5-513 complex was treated with apyrase to remove any ADP that accompanied Eg5-513 through purification, and the resultant nucleotide-free complex was rapidly mixed with mantATP in the stopped-flow instrument. A nucleotide-free MT·Eg5-513 complex was used in these experiments because ADP co-purified with Eg5-513 (34). The co-purifying ADP has been observed to cause Eg5-513 to partition off of the MT (34) (Fig. 2C, inset) and in essence reduce the number of Eg5-513 active sites that participate in the first mantATP binding event. The transients in Fig. 1A reveal that the fluorescence enhancement promoted by mantATP binding was biphasic with an initial fast phase followed by a slower phase. Because the amplitudes of the first and second phases were approximately equal, the kinetics suggest that the biphasic transients represent mantATP binding to both active sites of dimeric Eg5-513. In contrast, the transients for monomeric Eg5-367 were monophasic and best fit to a single exponential function (30).
FIGURE 2.

Pulse-chase kinetics of ATP binding. A preformed MT·Eg5 complex was rapidly mixed with Mg[α-32P]ATP and chased with 10 mm unlabeled MgATP. A, individual transients displaying an ATP concentration-dependent pre-steady-state burst of product formation followed by a linear phase of product formation. B, the observed exponential rates were plotted as a function of MgATP concentration and fit to a hyperbola: kmax = 52 ± 7s−1 and apparent Kd,ATP = 20.4 ± 14.5 μm. C, inset gel, not all Eg5 was bound to the MTs at the start of the experiment. Displayed are two load volumes of the supernatant and pellet fractions of centrifuged MT·Eg5 complexes. C, the burst amplitude, as micromolar ADP formed, is plotted. The hyperbola extrapolates to 4.1 μm of possible 4.5 μm maximal amplitude based on the fraction of motor that was bound to the MTs at the start of the experiment. B and C, data from individual experiments; D–F, data from multiple experiments. D, the hyperbolic fit of the observed burst rates provided k+1′= 50 ± 3s−1 and the apparent Kd,ATP, = 35 ± 7 μm. The inset displays ATP binding at low ATP concentrations where the data can be linearly fit to Equation 2. The second-order rate constant for ATP binding given by the slope is k+1 = 1.15 ± 0.1 μm−1s−1, and the off-rate provided by the y-intercept is 1.4 ± 0.6 s−1. E, the observed rates for subsequent ATP binding events obtained from the linear phase of the transients were plotted and fit to a hyperbola: kslow = 5.7 ± 0.4 μm ADP·s−1, apparent Kd,ATP = 27 ± 7 μm. F, the burst amplitudes from multiple experiments have been normalized according to the amount of Eg5 sites that partition with the MT pellet on the day of the experiment and were plotted as a function of MgATP concentration. The hyperbolic fit extrapolates to 97 ± 5% of Eg5 active sites with the apparent Kd,ATP = 57 ± 8μm. Final concentrations of the MT·Eg5 complexes were as follows: 1 μm Eg5-513/6μm MTs for 1–3 μm ATP, 2 μm Eg5-513/6 μm MTs for 2–6 μm ATP, and 5 μm Eg5-513/6 μm MTs for 5–300 μm.
The mantATP binding transients for Eg5-513 were fit to two exponential functions, and both phases showed mantATP concentration dependence. For the initial fast phase, the observed rate of mantATP binding followed a hyperbolic dependence. Deviation from linearity for mantATP binding indicated at least a two-step process with the initial collision being a rapid equilibrium, followed by a rate-limiting conformational change (k+1′). The fit of the data to Equation 1 provided the second-order rate constant, K1k+1′ = 5.8 μm−1s−1, k+1′= 54 s−1, and apparent Kd,mantATP = 9.4 μm.
The observed rates of mantATP binding obtained from the second, slower exponential phase were linear as a function of mantATP concentration from 0 to 50 μm mantATP (Fig. 1C). These data were fit to Equation 2, which provided the second-order rate of the second phase for mantATP binding at 0.14 μm−1 s−1. The concentration dependence of both phases suggests that this assay is monitoring two separate nucleotide binding events by two distinct populations, presumably head 1 versus head 2 of the dimeric molecule.
ATP Binding by Pulse-Chase
To determine the kinetics of Eg5-513 binding the natural substrate MgATP, pulse-chase experiments were performed (Fig. 2). A preformed MT·Eg5-513 complex was rapidly mixed with MgATP plus a trace of [α-32P]ATP and chased with an excess of unlabeled MgATP. This experimental design ensures that any weakly bound radiolabeled substrate from collision complex formation will be effectively out-competed by cold substrate, and only the formation of an MT·Eg5-513·ATP complex that proceeds through ATP hydrolysis will be monitored. The individual transients (Fig. 2A) were fit to the burst equation (Equation 3). A plot of the observed rates of the exponential burst of product formation as a function of ATP concentration can be fit to a hyperbolic function providing k+1′ = 50 s−1 and the apparent Kd,ATP = 35 μm (Fig. 2D). At low ATP concentrations, where the data can be fit linearly, the slope of the line provides a second-order rate constant of ATP binding, k+1 = 1.2 μm−1 s−1 and an off-rate determined by the y-intercept of 1.4 s−1 (Fig. 2D, inset). As with the mantATP binding experiment, deviation from linearity indicates a two-step process with substrate binding limited by a conformational change. The observed rates from both the pulse-chase and mantATP experiments (50 s−1 and 54 s−1, respectively) are in good agreement with each other, suggesting that the experimental approaches were monitoring the same event. Furthermore, the fact that product formation during the first ATP turnover was visible as well as the k+1′ being 100-fold faster than steady-state ATP turnover (34), indicates that ATP binding is a rapid event in the cycle.
Additional information can also be gained from the amplitude of the transients as well as from the rate of the linear phase of the transients. From the burst amplitude data, the percentage of the motor population that is participating in the first ATP turnover can be determined. In these experiments, the effective motor population is represented only by motor bound to the MT. When Eg5 is free in solution, the ATPase cycle is limited by ADP release at 0.002 s−1 (34) and will not significantly contribute to the observed signal. As evidenced by the inset SDS-PAGE gel in Fig. 2C, not all motor is bound to the MT at the start of the experiment, and the effective motor population needs to be corrected for the motor that is free in solution. After normalizing for the percentage of the motor population that is bound to the MT and therefore able to bind and hydrolyze ATP at the MT-activated rate, 97 ± 5% of motor active sites were competent to bind and hydrolyze ATP during the first turnover. The apparent Kd,ATP determined from the burst amplitude data at 57 μm(Fig. 2F) was higher than the apparent Kd,ATP determined from the rate of the burst in Fig. 2D at 35 μm. The Kd,ATP difference is suggestive that the burst rate is monitoring predominantly head 1, whereas the burst amplitude data represent both head 1 and head 2.
The rate of the linear phase of the transients represets subsequent ATP turnovers and is therefore enzyme concentration-dependent. The rate of the linear phase must also be corrected for the fraction of motor that is not bound to the MT at the start of the experiment. The observed rate of the linear phase approached kmax = 5.7 μm ADP·s−1 with the K1/2,ATP = 26.7 μm. Considering that only 85–90% of the motor (4.25–4.5 μm of 5 μm) was bound to the MT under the experimental conditions (Fig 2C, inset), the predicted slow step govering subsequent ATP turnover events was 1.27–1.34 s−1 per μm Eg5-513.
Acid-quench Analysis of ATP Hydrolysis
The kinetics of ATP hydrolysis were originally pursued by rapidly mixing a preformed MT·Eg5-513 complex (5 μm Eg5-513, 6 μm MTs) with Mg[α-32P]ATP in excess of enzyme concentration in the quench-flow instrument. Surprisingly, a burst of product formation during the first ATP turnover was not observed as compared with the pulse-chase transients at the same ATP concentration (Fig. 3 and supplemental Fig. S1A). There are several possibilities that can account for this result: (1) ATP binding is rate-limiting, (2) steady-state ATP turnover is fast enough to significantly obscure visualization of the burst phase, (3) co-purifying ADP is occupying the active sites, (4) ATP hydrolysis is the rate-limiting step in the mechanism. The first hypothesis, that the ATP hydrolysis step is limited by rate-limiting substrate binding, must be rejected because ATP binding is a fast step (Figs. 1-3).
FIGURE 3.
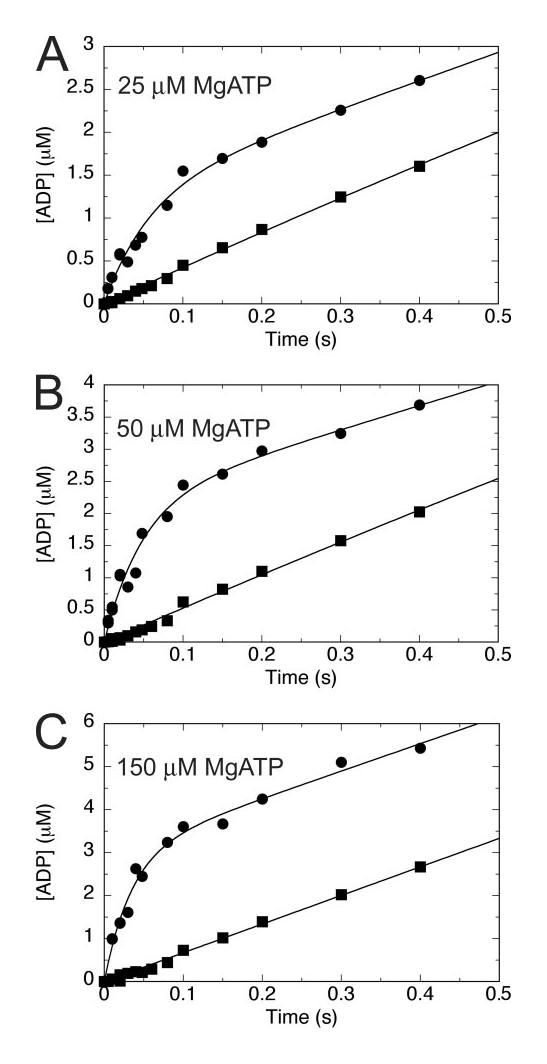
Comparison of pulse-chase and acid-quench transients. Pulsechase (●) and acid-quench (■) experiments were performed on the same day at the specified MgATP concentrations in A–C. Note the absence of a pre-steady-state burst in the acid-quench transients, yet present in each pulsechase transient.
To address the hypothesis that steady-state ATP turnover is obscuring the burst phase, additional KCl was added to the nucleotide syringe (supplemental Fig. S1B). In the case of conventional kinesin (38, 42, 43) and monomeric Eg5 (30), additional salt was added to the nucleotide syringe to better visualize the burst phase. The additional salt did not have an affect on the first ATP turnover but was able to lower the steady state by weakening MT·motor interactions and thereby slowing subsequent ATP turnovers, effectively revealing the burst phase. Incorporation of an additional 100mM KCl (final after mixing) into the MgATP syringe did not permit resolution of a burst of product formation in the case of Eg5-513 (supplemental Fig. S1B).
ADP has been demonstrated to have an effect on the equilibrium of theMT·Eg5-513 complex (34) (Fig. 2C, inset), and there was the possibility that it could be influencing the experimental readout. Co-purifying ADP was removed by apyrase treatment to ensure that all motor was bound to the MT (34), and there would be no nucleotide to compete with ATP for binding sites at the start of the experiment.Aburst of product formation was not observed when the MT·Eg5-513 complex was pretreated with apyrase prior to performing the acid-quench experiment (supplemental Fig. S1C). The failure to resolve product formation during the first turnover event from subsequent ATP turnovers using numerous experimental designs (supplemental Fig. S1), in conjunction with ATP binding being a rapid event, implied that ATP hydrolysis may be the rate-limiting step in the cycle.
Single Turnover Analysis of ATP Hydrolysis
A series of single turnover experiments were pursued to test this hypothesis and to determine the intrinsic rate constant of the ATP hydrolysis step (Fig. 4). With Eg5-513 active sites present in excess of ATP, the observed exponential conversion of ATP to ADP·Pi would reflect the intrinsic rate of ATP hydrolysis as long as the rate of substrate binding governed by [E]*kb is faster than the intrinsic rate of ATP hydrolysis. Experimental conditions at which the observed rate of ATP hydrolysis saturated were not able to be met due to technical difficulties in combining high concentrations of motor and MTs (<50 μm for each). At the highest concentration of MT·Eg5-513 used (45 μm Eg5-513, 50 μm MTs, 1 μm MgATP), the observed rate was 3.3 s−1. Fig. 4B shows the observed rate of ATP hydrolysis plotted as a function of Eg5-513 concentration, and the fit of the data to a hyperbolic function provided k+2 = 5.4 s−1.
FIGURE 4.

Single turnover acid-quench kinetics of ATP hydrolysis. A, a preformed MT·Eg5 complex was rapidly mixed with Mg[α-32P]ATP in the quench-flow instrument. Final concentrations were 15 μm Eg5-513/20 μm MTs (□), 20 μm Eg5-513/25 μm MTs (◆), 30 μm Eg5-513/35 μm MTs (●), 45 μm Eg5-513/50 μm MTs (△), and 1 μm MgATP. Each transient was fit to a single exponential function. B, the observed exponential rates were plotted as a function of Eg5-513 concentration and hyperbolically fit; k+2 = 5.4 ± 1 s−1. ◆, data from an MT·Eg5 complex that was pretreated with apyrase, k+2 = 9.6 ± 1.7 s−1. Inset, transients obtained on the same day from a MT·Eg5 complex (45 μm Eg5-513, 50 μm MTs final concentrations after mixing) in the absence of apyrase pretreatment (●) and treated with apyrase (◆). No treatment, kobs = 3.3 ± 0.1 s−1 compared with 4.8 ± 0.2 s−1 with apyrase treatment. C, the rate of ATP hydrolysis was examined by varying the MgATP concentration to evaluate ATP hydrolysis for one head versus two heads of the dimer at single turnover conditions.
With the high motor concentration used in these experiments, it was a concern that the amount of ADP co-purifying with Eg5-513 was effectively competing with the low concentration of ATP at 1 μm. To examine if this hypothesis were true, the MT·Eg5-513 complex was treated with apyrase to remove the co-purifying ADP. The observed rate after apyrase treatment increased slightly for most of the Eg5 concentrations tested, suggesting that co-purifying ADP did have an impact on this experiment (Fig. 4B).Ahyperbolic fit of the nucleotide-free Eg5 data yielded k+2 = 9.6 ± 1.7 s−1. This rate constant, however, may be an overestimation based on analysis by KINSIM (44) and theMT·Eg5 dissociation kinetics (Fig. 6), which will be discussed later.
FIGURE 6.

Dissociation of the MT·Eg5-513 complex. A, a preformed MT·Eg5 complex was rapidly mixed in the stopped-flow instrument with either buffer, MgAMPPNP, MgATPγS. MgADP, or MgATP. In each case the nucleotide syringe contained an additional 200 mm KCl resulting in final concentrations of 100 mm KCl, 1mm MgAXP, 4 μm HsEg5-513, and 6 μm tubulin. The average of four to six transients for each condition is displayed. The ATP and ADP transients were fit to a double exponential function yielding the initial fast kobs = 6.2 ± 0.2 s−1 and 23.9 ± 0.6 s−1 and the slower second phase kobs = 0.76 ± 0.02 s−1 and 1.2 ± 0.02 s−1, respectively. The amplitudes associated with the fast and slow phases were approximately equal for both the ATP and ADP transients. B, the observed rates of both the fast (●) and slow (■) exponential phases were plotted as a function of MgATP concentration. A hyperbolic fit to data from the initial rapid phase produces a kmax = 6.7 ± 0.2 s−1 and 1/2,ATP = 6.9 ± 1.2 s−1. The data from the slower exponential phase does not vary as a function of MgATP concentration (average kobs = 0.7 ± 0.1 s−1).C, dissociation of the MT·Eg5-513 complex was examined in the absence of additional KCl. Eg5-513 was mixed with MTs plus MgATP. Final concentrations were 5 μm Eg5, 5 μm MTs, and 1mM ATP. The resultant transient exhibits an increase in turbidity at 14.4 ± 0.3 s−1 followed by a 100-ms lag, and a biphasic decrease in turbidity of equal amplitude (phase 1 kobs = 1.05 ± 0.05 s−1; phase 2 kobs = 0.19 ± 0.01 s−1).
If both Eg5-513 active sites of the dimer bound and hydrolyzed ATP independently of each other, the observed rate should be independent of ATP concentration. An ATP concentration dependence was pursued using single turnover experiments to test for cooperativity between the two motor domains. If theMT·Eg5-513 complexes were mixed with a substrate concentration greater than half the active site concentration such that both head 1 and head 2 bind and hydrolyze ATP, the observed rate of ATP hydrolysis was reduced by almost half (Fig. 4C). These results provide compelling evidence that the two motor domains hydrolyze ATP in a sequential fashion in these single turnover experiments.
Phosphate Release
If the kinetic step of ATP hydrolysis were the slowest step in the enzymatic cycle, then any step following ATP hydrolysis, such as phosphate release, should be limited by ATP hydrolysis. The rate of phosphate release was first examined by mixing anMT·Eg5-513 complex and MDCCPBP with ATP in excess of motor concentration (Fig. 5A). Under these conditions, product formed in the first turnover could not be separated from the subsequent ATP hydrolysis events. As an example (Fig. 5A), when theMT·Eg5-513 complex was mixed with MgATP (0.5 μm Eg5-513, 2 μm MTs, 10 μm MgATP), kobs = 0.22 s−1 with the burst amplitude equal to 3 μm phosphate based on the KH2PO4 standard curve (Fig. 5A, inset). These results at 0.5 μm Eg5-513 indicate that the slow exponential phase of phosphate release represents six ATP turnovers.
FIGURE 5.

Phosphate release kinetics. A, a preformed MT·Eg5-513 complex plus MDCC-PBP was mixed in the stopped-flow instrument with MgATP. Final concentrations: 0.5 μm Eg5-513, 2 μm MTs, 5 μm MDCC-PBP, and 10 μm MgATP. The transient displays an amplitude corresponding to 3 μm Pi with kobs = 0.22 ± 0.0002 s−1. B, a preformed MT·Eg5-513 complex plus MDCCPBP was mixed in the stopped-flow instrument withMgATPat single turnover conditions. Final concentrations: 15 μm Eg5-513, 20 μm MTs, 20 μm MDCCPBP, and 1 μm MgATP. The data were fit to a single exponential function with kobs = 1.9 ± .002 s−1 with an amplitude of 0.98 μm. A and B, insets, the KH2PO4 standard curves used to convert fluorescence voltage to micromolar Pi released for the corresponding experiments.
Single turnover experiments were also performed to monitor the first phosphate release event. An apyrase-treated MT·Eg5-513 complex plus MDCC-PBP were rapidly mixed in the stopped-flow instrument with MgATP (final: 11 μm Eg5-513, 20 μm MTs, 20 μm MDCC-PBP, 1 μm MgATP). The resultant single exponential function displayed kobs = 1.9 s−1 with an amplitude corresponding to 0.98 μm phosphate (Fig. 5B). The observed amplitude was in good agreement with the expected amplitude of 1 μmphosphate released from 1 μmATP. Furthermore, single turnover ATP hydrolysis data of an apyrasetreated MT·Eg5-513 complex at 11 μm Eg5-513 predicted ATP hydrolysis at 1.85 s−1 (Fig. 4B). The observed rate of phosphate release at 1.9 s−1 supports the hypothesis that phosphate release was limited by ATP hydrolysis.
Dissociation of the MT·Eg5-513 Complex
To evaluate whether Eg5 detachment from the MT occurred following ATP hydrolysis as has been observed for conventional kinesin, Ncd, Kar3, and monomeric Eg5, dissociation of the MT·Eg5-513 complex was explored as a function of various nucleotides and nucleotide analogs (30, 45, 46). A preformed MT·Eg5-513 complex was rapidly mixed in the stopped-flow instrument with 2 mM MgAXP or buffer supplemented with salt (100 mM KCl final concentration). Again, the presence of additional salt does not affect the first ATP turnover but weakens MT·motor interactions such that the dissociated state becomes more predominant (30, 38, 42, 43). A slight decrease in turbidity was seen in the presence of the nonhydrolyzable ATP analogue AMPPNP and the slowly hydrolyzable analogue ATPγS. However, the amplitudes of the transients were quite small and similar to that of buffer, suggesting that the decrease was caused by the presence of the additional KCl and not the nucleotide (Fig. 6A). In contrast, if the MT·Eg5-513 complex was mixed with either MgATP or MgADP, a dramatic decrease in turbidity was detected. In conjunction, these results further support Eg5-513·ADP as a weak MT binding state and suggest that dissociation occurs, as observed for other kinesin family members, after ATP hydrolysis.
Because dissociation follows ATP hydrolysis, the observed rate of dissociation should not exceed the rate of ATP hydrolysis if hydrolysis were rate-limiting in the pathway. The kinetics of dissociation were explored as a function of MgATP concentration. The individual transients were biphasic with the rate of the initial fast phase extrapolating to 6.6 s−1 with a K1/2,ATP = 5.4 μm. The slow rate of the second phase did not display an ATP concentration dependence (average kobs = 0.7 s−1).
Another expectation as a result of dissociation following ATP hydrolysis would be that the dissociation transients would display a lag before the decrease in turbidity because of the time required for ATP binding, ATP hydrolysis, and phosphate release. The presence of such a lag was difficult to detect in the experiments with additional salt in the nucleotide syringe. Therefore, to verify that the dissociation data were indeed measuring a signal attributable to dissociation of the MT·Eg5-513 complex following ATP hydrolysis, Eg5-513 was mixed with MTs plus MgATP in the stopped-flow instrument. There was an initial increase in turbidity as expected for motor association with the MT, followed by a lag of ∼100 ms, and a biphasic decrease in turbidity. This profile is consistent with MT·Eg5-513 complex formation followed by a lag required for ATP binding, ATP hydrolysis, and Pi release prior to Eg5-513 detachment from the MT.
MT·Eg5-513 Association
Inaddition to examining steps in the mechanochemical cycle of Eg5-513 while it is associated with the MT, experiments were performed to address steps in the cycle leading to MT·Eg5-513 complex formation. Formation of the MT·Eg5-513 complex was measured by monitoring an increase in turbidity when Eg5-513, and MTs were mixed in the stopped-flow instrument. The second-order rate constant of association was measured at kassoc = 2.8 μm−1 s−1, with an off-rate of koff = 9.7 s−1 (Fig. 7). These kinetic constants provide an apparent K1/2/MT of 3.5 μm, which is similar to the steady-state K1/2/MT of 1.8 μm (34). To address the contribution that co-purifying ADP might have on the association kinetics, Eg5-513 was treated with apyrase prior to mixing with MTs in the stopped-flow instrument. After apyrase treatment the second-order rate constant for complex formation was kassoc = 3.2 μm−1 s−1 with an off-rate koff = 7.7 s−1, and the K1/2,MT = 2.4 μm. These kinetic constants are similar, and the results indicate that the magnitude of koff was not due to the presence of co-purifying ADP.
FIGURE 7.
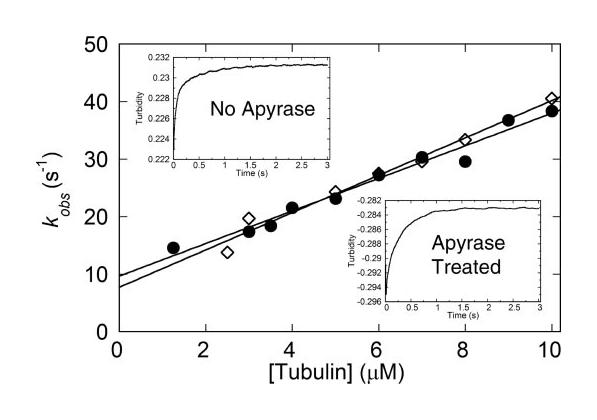
MT·Eg5-513 association. Eg5-513 with or without apyrase treatment was rapidly mixed with MTs in the stopped-flow instrument, and the increase in turbidity was monitored. Final concentrations were 1.25 μm Eg5-513 for 1.25–2.5 μm MTs, 2.5 μm Eg5-513 for 2.5–5 μm MTs, and 5 μm Eg5-513 for 5–10 μm MTs. The individual transients were fit to a double exponential function, and the observed rate of the initial fast phase was plotted as a function of MT concentration. The data were fit to Equation 4, yielding a second order rate constant for complex formation in the absence of apyrase treatment (●) of 2.8 ± 0.2 μm−1 s−1 and 3.2 ± 0.2 s−1 with apyrase treatment (◇), and an off-rate provided by the y-intercept of 9.7 ± 1 s−1 (no apyrase treatment) and 7.7 ± 1.4 4m−1 s−1 with apyrase treatment. Insets, representative MT·Eg5 association transients with and without apyrase treatment (upper left, 5 μm Eg5-513 and 8 μm MTs final) or with apyrase treatment (lower right, 5 μm Eg5-513 and 5 4m MTs final concentrations).
MantADP Release from Eg5-513
To measure the rate of ADP release with motor collision to the MT, Eg5-513 was first incubated with an equimolar amount of mantADP to exchange bound ADP with the fluorescent analog. Eg5-513·mantADP was then rapidly mixed with MTs plus 1 mM MgATP in the stopped-flow instrument, and the decrease in fluorescence upon mantADP release from the active site was monitored. The addition of nonfluorescent MgATP to the reaction served to diminish the probability that mantADP released to the solution would rebind the motor domain. The resultant fluorescence decrease was biphasic with the initial exponential phase fast. The microtubule concentration dependence of the observed rate of mantADP release was hyperbolic, with the fit of the data providing k+4 = 28 s−1 and K1/2,MTs = 3.7 μm (Fig. 8). The observed rates of the slower phase were also MT concentration-dependent, and the fit of the data to a hyperbola provided kmax = 0.5 s−1 and K1/2,MTs = 13 μm (Fig. 8B, inset).
FIGURE 8.
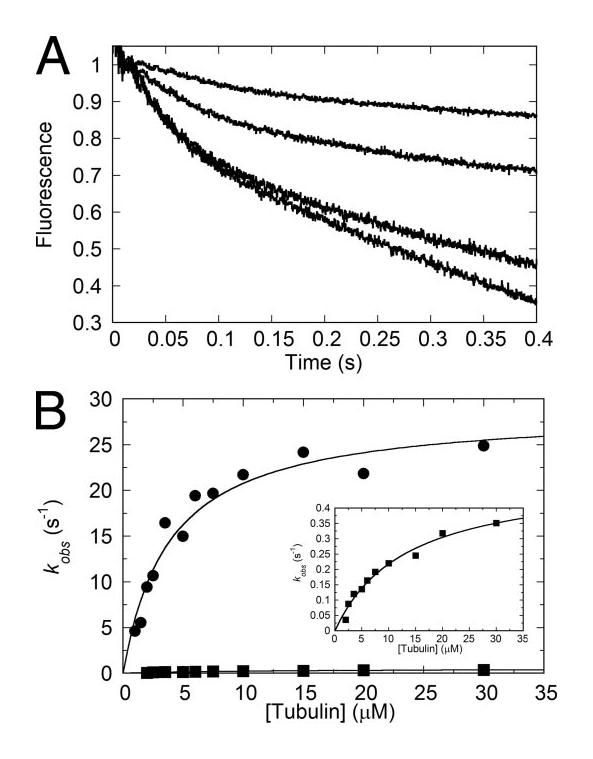
MantADP release kinetics. The Eg5·MantADP complex was rapidly mixed with MTs plus MgATP in the stopped-flow instrument, and the decrease in MantADP fluorescence emission was monitored. Final concentrations were 2 μm Eg5-513·mantADP, 1 mM MgATP, and 2–30 μm MTs. A, the individual transients were biphasic. B, the observed rates of both phases were plotted as a function of MT concentration and hyperbolically fit. The fits for the first (●) and second (■) phases extrapolate to k+4 = 29 ± 2 s−1, K1/2,MT = 3.8 ± 0.7 μm, kmax = 0.5 ± .04 s−1, and K1/2,MT = 13 ± 2 μm, respectively. Inset, the observed rates of the second phase.
DISCUSSION
This study provides kinetic evidence for the observed processive stepping of dimeric Eg5 (35). Dimeric Eg5-513 like conventional Kinesin-1 alternates the enzymatic cycles of its motor domains to ensure that one motor domain is tightly bound to the MT while the other detaches to rebind at its next MT site 16 nm away and toward theMTplus end. Dimeric Eg5 also has the striking characteristic of having a rate-limiting catalytic step while MT associated. This result is in direct contrast to what has been observed for the Eg5 monomer (30) and unlike any other kinesin presently published. Therefore, Eg5 is not simply a slower version of conventional Kinesin-1, although both motors step toward MT plus ends, are processive, and exhibit cooperative interactions.
ATP Hydrolysis Is Rate Limiting for Eg5-513
For monomeric Eg5, the rate-limiting step in the ATPase cycle was proposed to be the coupled step of phosphate release and detachment from the MT (30, 33). The data presented here suggest that the rate-limiting step for dimeric Eg5 is altered from that of the monomer. A pre-steady-state burst of product formation was not observed for MT·Eg5-513 for the step of ATP hydrolysis using acid-quench techniques withATPin excess of Eg5-513 active sites (Fig. 3 and supplemental Fig. S1). This result was surprising because all other kinetically characterized kinesin motors have displayed a pre-steady-state burst of product formation under these conditions. The analysis of ATP binding by pulse-chase or with mantATP indicates that ATP binding is a rapid step in the cycle with the ATP-dependent isomerization, k+1′ at 50–54 s−1 (Figs. 1 and 2 and Table 1). In addition, the single turnover acid-quench experiments measured ATP hydrolysis at 5–10 s−1 (Fig. 4 and Table 1), suggesting thatATPhydrolysis was intrinsically slow and no faster than other steps in the ATPase cycle. This interpretation was supported by the phosphate release kinetics as well as the ATP-promoted dissociation kinetics of the MT·Eg5 complex (Figs. 5 and 6 and Table 1). In both cases, the observed rates were no faster than ATP hydrolysis. These results in combination also indicate that phosphate release occurs as a fast step and while the motor is still associated with the MT.
TABLE 1.

Comparison of monomeric and dimeric Eg5 constants
Steps in the mechanochemical cycle not directly involved with catalysis were also examined. Both Eg5 association with the MT and the subsequent release of mantADP were rapid steps in the cycle (Figs. 7 and 8 and Table 1). At present, dimeric Eg5 is the only MT-based motor to have its ATPase cycle slowed at the catalytic step, although the actin-based motor, myosin IXb, has recently been reported to have a rate-limiting ATP hydrolysis step as well (47, 48).
Eg5-513 Displays Alternating Site Catalysis
For a processive motor, it would be logical to expect an alternating-site mechanism for ATP hydrolysis as observed previously for conventional Kinesin-1 (36-39), and there are multiple lines of evidence that provide support for such a model for Eg5-513. The kinetics of mantATP binding, ATP-promoted MT·Eg5 complex dissociation, Eg5 association with the MT, and mant-ADP release were all biphasic (Figs. 1, 6, 7, and 8). In addition, the single turnover experiments for ATP hydrolysis show that the observed rate decreases by approximately half when both heads of the Eg5 dimer bind and hydrolyze ATP as compared with an experiment in which only one head of the dimer can bind and hydrolyze ATP (Fig. 4C). Lastly, the pulse-chase results reveal two different dissociation equilibrium constants for the ATP concentration dependence of the burst rates as compared with the burst amplitude data (Fig. 2, D and E). The Kd,ATP obtained from the burst rate hyperbolic fit was 35 μm versus 57 μm from the fit of the burst amplitude data. Because the burst amplitude reflected all of the Eg5-513 sites, and the affinity for substrate was seen to be 5–12 μm in the mantATP binding and MT·Eg5-513 complex dissociation experiments, we propose that the maximum burst rate is monitoring predominantly head 1 of the dimer, yet the maximum burst amplitude is monitoring both head 1 and head 2. Although these results taken together are consistent with an alternating-site mechanism for catalysis, the structural transition gating the secondary event is not entirely resolved at this time.
Kinetic Puzzles and Issues of Cooperativity
The kinetic data presented in this study argue for a rate-limiting step of ATP hydrolysis between 5 and 10 s−1. This range is acceptable with relation to the predicted steady-state rate of 11.9 s−1 obtained from single molecule studies (35), but it cannot account for the steady-state kcat of 0.48 s−1 determined by our solution studies (34). Also, the rate of the linear phase from the pulse-chase transients (Fig. 2E) and the acid-quench transients (supplemental Fig. S1A) are ∼1–1.3 s−1, and therefore, 2- to 3-fold faster than the solution steady-state kcat. In fact, the only measured kinetic event that could correspond to the solution kcat is the second phase of mantADP release transients with kl = 0.5 s−1 (Fig. 8). This event does not appear to occur during the first ATP turnover, because ATP hydrolysis at 5–10 s−1 followed by a 0.5 s−1 step would be easily detected as a pre-steady-state exponential burst phase followed by the linear phase that would represent the 0.5 s−1 once enzyme concentration was considered. How can we resolve this conundrum?
The experiments to determine the kinetics of ATP binding, ATP hydrolysis, Pi release, and motor detachment from the MT all begin with a preformed MT·Eg5 complex. The acid-quench experiments did not show a pre-steady-state burst of product formation followed by a slow linear phase, and therefore the 0.5–1.3 s−1 gating transition must occur prior to ATP binding. Furthermore, the single molecule results from Valentine and Fordyce et al. (35) indicate that the rate-limiting step during a processive run must occur significantly faster than 0.5 s−1 and at ∼10 s−1. Only the biphasic mantADP release kinetics showed the 0.5 s−1 gating transition, suggesting that the motor establishes its processive run by colliding with the MT, releasing ADP, followed by a slow conformational change of ∼0.5–1.3 s−1. Once this transition has occurred, then each additional step is limited byATP hydrolysis until the processive run is ended by the Eg5 motor falling off the MT. In contrast to Kinesin-1, the MT association kinetics for dimeric Eg5 are much slower at 2.8 μm−1 s−1 than 10–20 μm−1 s−1 for conventional Kinesin-1. This difference in MT association is consistent with the observation of very different run lengths for the two motors. Dimeric Eg5 exhibits very short processive runs of ∼8 steps, whereas Kinesin-1 can continue for 100 steps or more. Because of the short processive run length of dimeric Eg5, the steady-state solution studies would be more sensitive to the slow transition that begins the processive run rather than the ATP hydrolysis step within the processive run. Rosenfeld et al. (29) proposed, based on their fluorescence resonance energy transfer studies with monomeric Eg5, that neck linker docking occurred upon collision with the MT (29). The fluorescence resonance energy transfer results in combination with the single molecule studies and the kinetics presented here suggest a model in which there is a structural transition, possibly neck linker docking, that occurs at ∼0.5–1 s−1, yet once the Eg5 motor begins stepping, then its movement is limited by ATP hydrolysis at ∼5—10 s−1. At this time, we have not dissected the communication from head 1 to head 2 that maintains the two heads out of phase and controls the processive stepping. These cooperativity questions will be resolved through future kinetic studies aimed at the nature of the gating between the two motor domains.
Supplementary Material
Acknowledgments
We thank our colleagues David Close, Jared Cochran, and Lisa Sproul for discussion and assistance during this study, and E. Michael Ostap (University of Pennsylvania School of Medicine) for thoughtful comments during preparation of the manuscript.
Footnotes
This work was supported by the NIGMS, National Institutes of Health (NIH)Grant GM54141 and by Career Development Award K02-AR47841 from NIAMS, NIH, Department of Health and Human Services (to S. P. G.). The costs of publication of this article were defrayed in part by the payment of page charges. This article must therefore be hereby marked “advertisement” in accordance with 18 U.S.C. Section 1734 solely to indicate this fact.
The on-line version of this article (available at http://www.jbc.org) contains supplemental Fig. S1.
The abbreviations used are: MT, microtubule; AMPPNP, adenosine 5′-(β,γ-imido)triphosphate; ATPγS, adenosine-5′-(γ-thio)triphosphate; MgAXP, magnesium with ATP, ADP, ATPγS, or AMPPNP; Eg5-513, a dimeric Eg5 motor consisting of amino acids 1–513 of the human Eg5 gene; mant, 2′(3′)-O-(N-methylanthraniloyl); MDCC-PBP, 7-diethylamino-3-((((2-maleimidyl)ethyl)amino)carbonyl)coumarin-labeled phosphate-binding protein.
REFERENCES
- 1.Sawin KE, LeGuellec K, Philippe M, Mitchison TJ. Nature. 1992;359:540–543. doi: 10.1038/359540a0. [DOI] [PubMed] [Google Scholar]
- 2.Whitehead CM, Rattner JB. J. Cell Sci. 1998;111:2551–2561. doi: 10.1242/jcs.111.17.2551. [DOI] [PubMed] [Google Scholar]
- 3.Sharp DJ, McDonald KL, Brown HM, Matthies HJ, Walczak C, Vale RD, Mitchison TJ, Scholey JM. J. Cell Biol. 1999;144:125–138. doi: 10.1083/jcb.144.1.125. [DOI] [PMC free article] [PubMed] [Google Scholar]
- 4.Wilde A, Lizarraga SB, Zhang L, Wiese C, Gliksman NR, Walczak CE, Zheng Y. Nat. Cell Biol. 2001;3:221–227. doi: 10.1038/35060000. [DOI] [PubMed] [Google Scholar]
- 5.Goshima G, Vale RD. J. Cell Biol. 2003;162:1003–1016. doi: 10.1083/jcb.200303022. [DOI] [PMC free article] [PubMed] [Google Scholar]
- 6.Chakravarty A, Howard L, Compton DA. Mol. Biol. Cell. 2004;15:2116–2132. doi: 10.1091/mbc.E03-08-0579. [DOI] [PMC free article] [PubMed] [Google Scholar]
- 7.Kwok BH, Yang JG, Kapoor TM. Curr. Biol. 2004;14:1783–1788. doi: 10.1016/j.cub.2004.09.052. [DOI] [PubMed] [Google Scholar]
- 8.Shirasu-Hiza M, Perlman ZE, Wittmann T, Karsenti E, Mitchison TJ. Curr. Biol. 2004;14:1941–1945. doi: 10.1016/j.cub.2004.10.029. [DOI] [PubMed] [Google Scholar]
- 9.Miyamoto DT, Perlman ZE, Burbank KS, Groen AC, Mitchison TJ. J. Cell Biol. 2004;167:813–818. doi: 10.1083/jcb.200407126. [DOI] [PMC free article] [PubMed] [Google Scholar]
- 10.Kapitein LC, Peterman EJG, Kwok BH, Kim JH, Kapoor TM, Schmidt CF. Nature. 2005;435:114–118. doi: 10.1038/nature03503. [DOI] [PubMed] [Google Scholar]
- 11.Blangy A, Lane HA, d’Herin P, Harper M, Kress M, Nigg EA. Cell. 1995;83:1159–1169. doi: 10.1016/0092-8674(95)90142-6. [DOI] [PubMed] [Google Scholar]
- 12.Mayer TU, Kapoor TM, Haggarty SJ, King RW, Schreiber SL, Mitchison TJ. Science. 1999;286:971–974. doi: 10.1126/science.286.5441.971. [DOI] [PubMed] [Google Scholar]
- 13.Kaiser A, Brembeck FH, Nicke B, Wiedenmann B, Riecken EO, Rosewicz S. J. Biol. Chem. 1999;274:18925–18931. doi: 10.1074/jbc.274.27.18925. [DOI] [PubMed] [Google Scholar]
- 14.Kapoor TM, Mayer TU, Coughlin ML, Mitchison TJ. J. Cell Biol. 2000;150:975–988. doi: 10.1083/jcb.150.5.975. [DOI] [PMC free article] [PubMed] [Google Scholar]
- 15.Nakazawa J, Yajima J, Usui T, Ueki M, Takatsuki A, Imoto M, Toyoshima YY, Osada H. Chem. Biol. 2003;10:131–137. doi: 10.1016/s1074-5521(03)00020-6. [DOI] [PubMed] [Google Scholar]
- 16.Brier S, Lemaire D, Debonis S, Forest E, Kozielski F. Biochemistry. 2004;43:13072–13082. doi: 10.1021/bi049264e. [DOI] [PubMed] [Google Scholar]
- 17.Sakowicz R, Finer JT, Beraud C, Crompton A, Lewis E, Fritsch A, Lee Y, Mak J, Moody R, Turincio R, Chabala JC, Gonzales P, Roth S, Weitman S, Wood KW. Cancer Res. 2004;64:3276–3280. doi: 10.1158/0008-5472.can-03-3839. [DOI] [PubMed] [Google Scholar]
- 18.Gartner M, Sunder-Plassmann N, Seiler J, Utz M, Vernos I, Surrey T, Giannis A. Chembiochem. 2005;6:1173–1177. doi: 10.1002/cbic.200500005. [DOI] [PubMed] [Google Scholar]
- 19.Sarli V, Huemmer S, Sunder-Plassmann N, Mayer TU, Giannis A. Chembiochem. 2005;6:2005–2013. doi: 10.1002/cbic.200500168. [DOI] [PubMed] [Google Scholar]
- 20.Sunder-Plassmann N, Sarli V, Gartner M, Utz M, Seiler J, Huemmer S, Mayer TU, Surrey T, Giannis A. Bioorg. Med. Chem. 2005;13:6094–6111. doi: 10.1016/j.bmc.2005.06.027. [DOI] [PubMed] [Google Scholar]
- 21.Kim KS, Lu S, Cornelius LA, Lombardo LJ, Borzilleri RM, Schroeder GM, Sheng C, Rovnyak G, Crews D, Schmidt RJ, Williams DK, Bhide RS, Traeger SC, McDonnell PA, Mueller L, Sheriff S, Newitt JA, Pudzianowski AT, Yang Z, Wild R, Lee FY, Batorsky R, Ryder JS, Ortega-Nanos M, Shen H, Gottardis M, Roussell DL. Bioorg. Med. Chem. Lett. 2006;16:3937–3942. doi: 10.1016/j.bmcl.2006.05.037. [DOI] [PubMed] [Google Scholar]
- 22.Okumura H, Nakazawa J, Tsuganezawa K, Usui T, Osada H, Matsumoto T, Tanaka A, Yokoyama S. Toxicol. Lett. 2006;166:44–52. doi: 10.1016/j.toxlet.2006.05.011. [DOI] [PubMed] [Google Scholar]
- 23.Tarby CM, Kaltenbach RF, III, Huynh T, Pudzianowski A, Shen H, Ortega-Nanos M, Sheriff S, Newitt JA, McDonnell PA, Burford N, Fairchild CR, Vaccaro W, Chen Z, Borzilleri RM, Naglich J, Lombardo LJ, Gottardis M, Trainor GL, Roussell DL. Bioorg. Med. Chem. Lett. 2006;16:2095–2100. doi: 10.1016/j.bmcl.2006.01.056. [DOI] [PubMed] [Google Scholar]
- 24.Tao W, South VJ, Zhang Y, Davide JP, Farrell L, Kohl NE, Sepp-Lorenzino L, Lobell RB. Cancer Cell. 2005;8:49–59. doi: 10.1016/j.ccr.2005.06.003. [DOI] [PubMed] [Google Scholar]
- 25.Marcus AI, Peters U, Thomas SL, Garrett S, Zelnak A, Kapoor TM, Giannakakou P. J. Biol. Chem. 2005;280:11569–11577. doi: 10.1074/jbc.M413471200. [DOI] [PMC free article] [PubMed] [Google Scholar]
- 26.Lockhart A, Cross RA. Biochemistry. 1996;35:2365–2373. doi: 10.1021/bi952318n. [DOI] [PubMed] [Google Scholar]
- 27.Crevel IM, Alonso MC, Cross RA. Curr. Biol. 2004;14:R411–R412. doi: 10.1016/j.cub.2004.05.030. [DOI] [PubMed] [Google Scholar]
- 28.Maliga Z, Xing J, Cheung H, Juszczak LJ, Friedman JM, Rosen-feld SS. J. Biol. Chem. 2006;281:7977–7982. doi: 10.1074/jbc.M511955200. [DOI] [PubMed] [Google Scholar]
- 29.Rosenfeld SS, Xing J, Jefferson GM, King PH. J. Biol. Chem. 2005;280:35684–35695. doi: 10.1074/jbc.M506561200. [DOI] [PubMed] [Google Scholar]
- 30.Cochran JC, Sontag CA, Maliga Z, Kapoor TM, Correia JJ, Gilbert SP. J. Biol. Chem. 2004;279:38861–38870. doi: 10.1074/jbc.M404203200. [DOI] [PMC free article] [PubMed] [Google Scholar]
- 31.Cochran JC, Gilbert SP. Biochemistry. 2005;44:16633–16648. doi: 10.1021/bi051724w. [DOI] [PMC free article] [PubMed] [Google Scholar]
- 32.Cochran JC, Gatial JE, III, Kapoor TM, Gilbert SP. J. Biol. Chem. 2005;280:12658–12667. doi: 10.1074/jbc.M413140200. [DOI] [PMC free article] [PubMed] [Google Scholar]
- 33.Cochran JC, Krzysiak TC, Gilbert SP. Biochemistry. 2006;45:12334–12344. doi: 10.1021/bi0608562. [DOI] [PMC free article] [PubMed] [Google Scholar]
- 34.Krzysiak TC, Wendt T, Sproul LR, Tittmann P, Gross H, Gilbert SP, Hoenger A. EMBO J. 2006;25:2263–2273. doi: 10.1038/sj.emboj.7601108. [DOI] [PMC free article] [PubMed] [Google Scholar]
- 35.Valentine MT, Fordyce PM, Krzysiak TC, Gilbert SP, Block SM. Nat. Cell Biol. 2006;8:470–476. doi: 10.1038/ncb1394. [DOI] [PMC free article] [PubMed] [Google Scholar]
- 36.Hackney DD. Proc. Natl. Acad. Sci. U. S. A. 1994;91:6865–6869. doi: 10.1073/pnas.91.15.6865. [DOI] [PMC free article] [PubMed] [Google Scholar]
- 37.Gilbert SP, Moyer ML, Johnson KA. Biochemistry. 1998;37:792–799. doi: 10.1021/bi971117b. [DOI] [PubMed] [Google Scholar]
- 38.Gilbert SP, Webb MR, Brune M, Johnson KA. Nature. 1995;373:671–676. doi: 10.1038/373671a0. [DOI] [PMC free article] [PubMed] [Google Scholar]
- 39.Ma YZ, Taylor EW. J. Biol. Chem. 1997;272:724–730. doi: 10.1074/jbc.272.2.724. [DOI] [PubMed] [Google Scholar]
- 40.Brune M, Hunter JL, Corrie JE, Webb MR. Biochemistry. 1994;33:8262–8271. doi: 10.1021/bi00193a013. [DOI] [PubMed] [Google Scholar]
- 41.Klumpp LM, Hoenger A, Gilbert SP. Proc. Natl. Acad. Sci. U. S. A. 2004;101:3444–3449. doi: 10.1073/pnas.0307691101. [DOI] [PMC free article] [PubMed] [Google Scholar]
- 42.Moyer ML, Gilbert SP, Johnson KA. Biochemistry. 1998;37:800–813. doi: 10.1021/bi9711184. [DOI] [PubMed] [Google Scholar]
- 43.Klumpp LM, Brendza KM, Rosenberg JM, Hoenger A, Gilbert SP. Biochemistry. 2003;42:2595–2606. doi: 10.1021/bi026715r. [DOI] [PubMed] [Google Scholar]
- 44.Barshop BA, Wrenn RF, Frieden C. Anal. Biochem. 1983;130:134–145. doi: 10.1016/0003-2697(83)90660-7. [DOI] [PubMed] [Google Scholar]
- 45.Gilbert SP, Mackey AT. Methods. 2000;22:337–354. doi: 10.1006/meth.2000.1086. [DOI] [PubMed] [Google Scholar]
- 46.Mackey AT, Gilbert SP. J. Biol. Chem. 2003;278:3527–3535. doi: 10.1074/jbc.M206219200. [DOI] [PubMed] [Google Scholar]
- 47.Nalavadi V, Nyitrai M, Bertolini C, Adamek N, Geeves MA, Bahler M. J. Biol. Chem. 2005;280:38957–38968. doi: 10.1074/jbc.M507161200. [DOI] [PubMed] [Google Scholar]
- 48.Kambara T, Ikebe M. J. Biol. Chem. 2006;281:4949–4957. doi: 10.1074/jbc.M509141200. [DOI] [PubMed] [Google Scholar]
Associated Data
This section collects any data citations, data availability statements, or supplementary materials included in this article.