

Abstract
Background
We employ an approach based on the elaborated frailty index (FI), which is capable of taking into account variables with mild effect on the aging, health and survival outcomes, and investigate the connections between the FI, chronological age and the aging-associated outcomes in the elderly.
Methods
Cross-sectional analysis of pooled data from the National Long Term Care Survey (NLTCS) assessing health and functioning of the U.S. elderly in 1982, 1984, 1989, 1994, and 1999.
Results
Distributions of frequency, residual life span, mortality rate, and relative risk of death are remarkably similar over age and FI. Coefficients of correlation between FI and age are low both for males (0.127, p<.01) and females (0.221, p<.01). The FI-specific age patterns show deceleration at advanced ages. The FI can provide order of magnitude better resolution in estimating mean remaining life span compared to age. Males have smaller FI than females while males’ mortality risks are higher. For short-time horizons, the FI and age are largely independently associated with mortality risks.
Conclusions
The FI: i) can be considered as an adequate sex-specific indicator of the aging-associated processes in the elderly; ii) can characterize these processes independently of age, and iii) is a better characteristic of the aging phenotype than chronological age.
Keywords: Frailty index, aging processes, longevity, sex differences
1. Introduction
The systemic description of aging-associated changes embedded in data from population-based surveys is a difficult task given that mechanisms underlying such changes are still not well understood. Indeed, large-scale surveys typically measure not only major changes in health/well-being status captured by well-defined risk factors (e.g., physiological measurements), but also various aging-associated changes spread throughout hundreds of distinct variables. The connection between such variables as well as between each of these variables and health/survival outcomes is unclear and cannot be evaluated statistically with acceptable accuracy. This is because the number of these variables is typically large while the effect of each of them on health and survival is small, so most of the parameter estimates in corresponding statistical models are non-significantly different from zero. It is clear that new statistical methods capable of taking such “mild-effect” variables into account are needed to comprehensively describe aging-associated deterioration in health/well-being status in humans. Recognizing this need has lead, for instance, to development of heterogeneous (frailty) models of survival (Vaupel et al., 1979; Yashin et al., 2000), Grade of Membership methodology (Manton et al., 1994), linear latent structure analysis (Kovtun et al., 2006), methods of artificial neural networks (Song et al., 2004), generalized state variables on the basis of individual health traits (Mitnitski et al., 2004; Rockwood et al., 2004).
It turns out that despite simplicity, the latter approach appears to be effective. Rockwood and Mitnitski and colleagues (Mitnitski et al., 2004; Rockwood et al., 2004) elaborated a cumulative index (called a frailty index, FI) arguing that health/well-being disorders (e.g., signs, symptoms, impairments, abnormal lab tests, diseases, etc.) accumulated by individuals during their life course can be considered as indicators of physiological frailty. The rationale behind this concept is that degradation/decline of neuroendocrine, immune and other functions of an organism can result in a wide spectrum of adverse health/well-being disorders (Ferrucci et al., 2003; Goggins et al., 2005; Vanitallie, 2003). On the cellular level, frailty can be associated with a process of gradual accumulation of damage in cellular tissues (Kirkwood, 2002). The level of frailty can then be described by a composite measure (the FI) of such disorders (called deficits), which can be determined for each individual as the fraction of deficits among a selected list of items that measure various aspects of health/well-being status. An important property is that the FI includes not only physiological problems, such as lack of strength or reserves, but also disease-related, psychological, and well-being problems providing a broad view on frailty concept (Fisher, 2005). According to such a systemic approach, frailty appears to be characterized not by the substance of specific traits used to define the FI but by their aggregate (or systemic) ability to describe the decline in physiological performance in an organism – and, thus to characterize its overall function. Recent studies suggest that such approach works in various settings (Goggins et al., 2005; Kulminski et al., 2006; Mitnitski et al., 2005; Woo et al., 2006).
These studies revealed several useful properties of the FI that make it a convenient characteristic of frailty. Specifically, the FI is found to be a valid and reliable measure of a physiological frailty permitting stratification of health risks (Jones et al., 2004). The FI appears to be a robust concept predicting short- and long-term mortality outcomes and institutionalization (Mitnitski et al., 2002; 2005; Rockwood et al., 2006). It can characterize morbidity and is a sensitive indicator of health/well-being status of the elderly (Mitnitski et al., 2001; Woo et al., 2006). The FI is found to have maximum levels which are age independent, suggesting that there are frailty limits (Rockwood and Mitnitski, 2006). The FI is also found to be associated with chronological age (Mitnitski et al., 2005). It has been shown that the FI has a potential to describe biological age (Goggins et al., 2005; Mitnitski et al., 2002; 2004) and be a proxy measure of aging (Mitnitski et al., 2001). Higher biological age (measured by the FI) might be a significant predictor of death. Despite these studies, there is a lack of systematic focus on the connections between the FI and aging-associated processes. Moreover, while Canadian studies (Mitnitski et al., 2002) show that the biological age is a better predictor of death than chronological age, this was not the case for Chinese (Goggins et al., 2005) studies. The potential of the FI to characterize the aging-associated processes by including into the analyses mild-effect traits, the under-investigated potential of the FI to characterize the aging and aging-related processes, and the controversial features detected in early studies motivate the need for further analyses of properties of the FI.
Analyses by Kulminski et al. (2006) have shown that the FI has a potential to be an indicator of aging-associated processes and a measure of systemic age in individuals. It has been also shown that the elaborated FI can be a useful state variable in models of health/well-being and survival (Yashin et al., 2006a; 2006b). In this paper, we provide rigorous support to these views focusing on a comparative analysis of distinct health/mortality related outcomes as functions of the FI and chronological age. To meet our goals we adapted Rockwood-Mitnitski’s approach to constructing the FI using the National Long Term Care Survey (NLTCS) data. We first check whether basic findings from extant studies on the associations of the FI with chronological age, residual life span, and mortality risks take place in case of our data. We investigate to what extent the FI, considered as a characteristics of the aging and aging-related processes, is distinct of chronological age, whether it is a better indicator of these processes than chronological age, and whether these properties are sex-specific.
2. Methods
2.1. Data
The NLTCS data used in the present study were collected during 1982, 1984, 1989, 1994, and 1999 surveys. The NLTCS uses a sample of individuals drawn from national Medicare enrollment files. The NLTCS samples contain longitudinal and cross sectional components. A two-stage interviewing process was used for selection of the NLTCS participants. First, a screening interview assessing chronic disability is given to all members of the sample (roughly, 20,000 for each wave) – except persons who received a community or institutional detailed interview in a prior NLTCS. Persons reporting on the screen at least one impairment in an (Instrumental) Activity of Daily Living, (I)ADL, that had lasted, or was expected to last, 90+ days were then given either an in-person detailed community or institutional interview. Individuals, who, in a prior NLTCS, received such an interview, were automatically given a detailed questionnaire in the current NLTCS (up to the time of death). To replace deceased individuals and to ensure that the sample screened is representative of the entire U.S. elderly population, a new sample supplement is drawn for each survey of persons who passed age 65 since the last NLTCS. All NLTCS records are linked to Medicare (to the end of 2001) and Vital Statistics (to August 6, 2003) files. The 1982 to 1999 NLTCS screener questionnaires represent roughly 42,000 different individuals (for further details see (Manton and Gu, 2001)).
2.2. The Frailty Index
To construct the FI, we selected a set of deficits (32 questions), which are similar to those assessed from the Canadian Study of Health and Aging (Mitnitski et al., 2001) i.e., difficulty with eating, dressing, walk around, getting in/out bed, getting bath, toileting, using telephone, going out, shopping, cooking, light house work, taking medicine, managing money, arthritis, Parkinson’s disease, glaucoma, diabetes, stomach problem, history of heart attack, hypertension, history of stroke, flu, broken hip, broken bones, trouble with bladder/bowels, dementia, self-rated health, as well as problems with vision, hearing, ear, teeth, and feet. All of these questions are present in all five waves. Following Mitnitski et al. (2001), we define the FI as an unweighted count of the number of such deficits divided by the total number of all potential deficits considered for a given person. In this way, we avoid the problem of missing answers, i.e., by counting only those questions which were explicitly answered in the survey. The problem of missing data is also reduced by high overall response rate in the survey (for most questions the missing rate is less than 1%).
An important property of the FI is that it represents a cumulative measure of health/well-being deficits for which separate contributions to health and death risks are often small and thus estimation from the data is unreliable. But the accumulation of such mild deficiencies into a single index can produce a coherent contribution, establishing reliable associations with mortality and health risks (Goggins et al., 2005; Kulminski et al., 2006; Mitnitski et al., 2004; Woo et al., 2006). Moreover, the introduction of such indices allows for inclusion of many more measurements in the analyses than is possible in standard regression approaches using separate measurements.
2.3. Analysis
Traditional statistical analyses (i.e., frequency distributions, correlation coefficients, age and time to death patterns, relative risks) were performed using the SPSS software (release 12.0, Chicago, Illinois, USA). Mortality rates were calculated using FORTRAN implemented Kaplan-Meier algorithm which conveniently takes into account right censoring and left truncation, i.e., we calculated exact (with one-day accuracy) individual length of the follow-up period. The relative risks were calculated using Cox proportional hazard model with time of follow up as the time scale. To increase the statistical power, and to smooth estimates, we pooled data for all five (1982, 1984, 1989, 1994, and 1999) waves into one sample that provided about 27,000 person/waves.
3. Results
3.1. Frequency Distributions
The properties of the population marginal distributions with respect to age and FI along with the respective bar charts are shown in Figure 1 for males and females survived one year and died within one year after the interview. For longer follow-up periods, e.g., 2–4 years, the results remain qualitatively similar and, thus, are not shown here.
Figure 1.
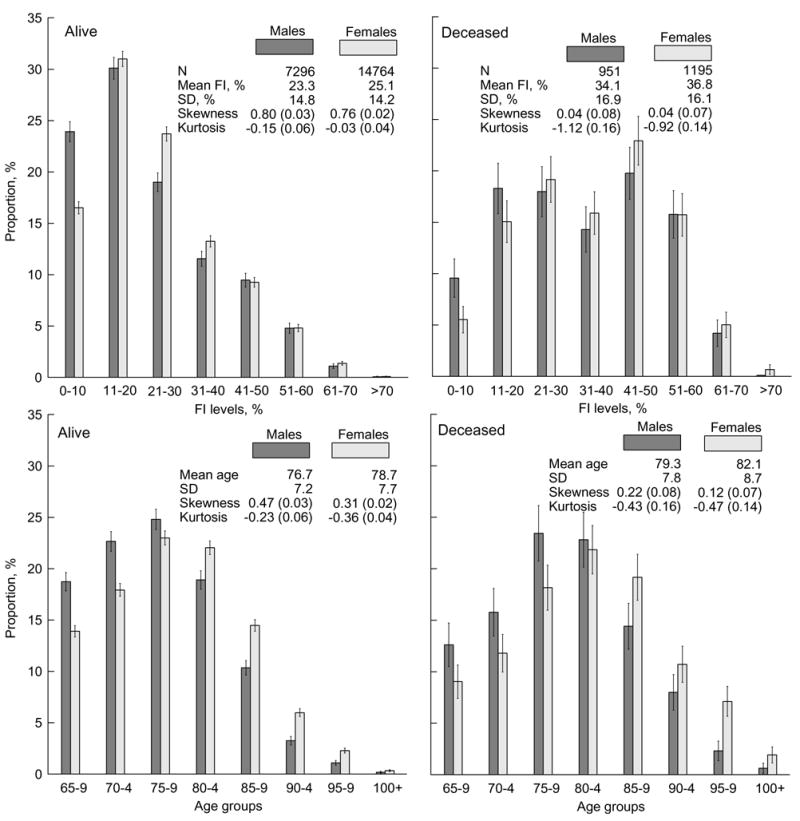
Frailty index (FI) (upper panels) and age (lower panels) frequency patterns for males and females surviving (left panels) and dying (right panels) during one year after the date of the respective interview. Thin bars show 95% confidence interval (CI). Insets show characteristics of the population marginal distributions. Numbers in parentheses are standard errors. SD means standard deviation.
Insets in Figure 1 show that, for the samples considered, larger mean ages correspond to larger mean values of the FI. One can also see that the mean age and the mean value of the FI of decedents are larger that those of survivors. However, the relative increase of the mean age for decedents is considerably smaller than that of the FI, (i.e., it is 0.043 vs. 0.47 for females and 0.035 vs. 0.46 for males). Similar correlated changes between sexes and survivors/decedents are seen for skewness (shape parameter) of the frequency patterns.
Visual comparison of the FI- and age-specific frequency patterns in Figure 1 shows their similarities for both surviving and deceased individuals. There are, however, qualitative differences in the shapes of the FI- and age-patterns between them. Specifically, the frequency patterns for survivors have large positive skewness, being close in shape to a gamma distribution, while those for deceased individuals are bell-shaped being close to a normal distribution (Figure 1). The kurtosis measures show that the FI- and age-specific patterns for decedents are flatter than those for survivors.
Figure 1 shows essential differences between the frequency distributions for males and females. The proportions of males at younger ages and smaller FI values are larger than for females. For larger FI levels and later ages (e.g., for 11–20% FI and 75–79 age group for survivors, and for 21–30% FI and 80–84 age group for decedents), the proportion of females is similar to that for males and increases afterwards. When the FI is large, there is almost no difference in the proportions of males and females, although the prevalence of females at advanced ages is clearly pronounced irrespective of vital status.
3.2. Correlation of the Frailty Index and Chronological Age
The (Pearson) correlation coefficients between FI and age (rFI–Age) are found to be low for the entire sample (rFI–Age = 0.193, p<.01) as well as for males (0.127, p<.01) and females (0.221, p<.01). For decedents, these coefficients are even smaller than for the unconditional samples (i.e., rFI–Age = 0.083, p<.05 for males and rFI–Age = 0.141, p<.01 for females). In all cases, they are smaller for males than for females. Figure 2 shows FI-specific frequency patterns for distinct age groups of the entire sample. It is seen that gamma-like patterns persist up to the advanced ages (95 years). Consequently, the proportion of individuals with small FI values remains relatively large for those ages, although the number of individuals at advanced ages decreases. Figure 2 reveals the reason why the correlation between the FI and age is small: this is because the respective FI and age groups are composed of, generally, distinct individuals, e.g., a low FI is not necessarily found only among younger individuals.
Figure 2.
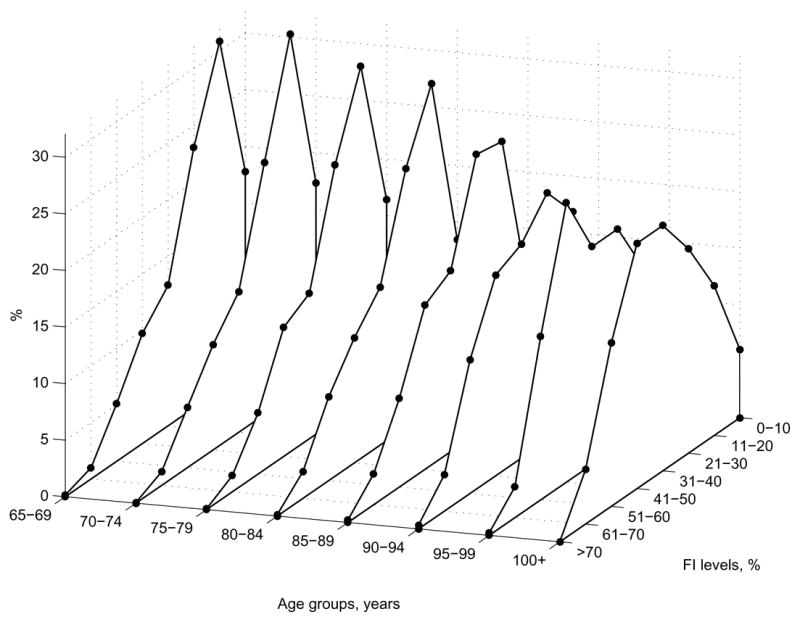
The FI frequency distributions (percentages) for the five-year age groups.
3.3. The Frailty Index Age-Specific Patterns
Extant studies of FI age-specific patterns in the NLTCS (Kulminski et al., 2006) and other (Goggins et al., 2005; Mitnitski et al., 2005) data show that the FI exhibits a nonlinear relationship with age. Figure 3 shows that the nonlinear relationship holds also for surviving and deceased males and females. An essential difference between the FI age patterns for survivors and decedents is that the entire patterns for decedents are shifted up toward larger FI values. These patterns are also flatter than those for survivors. The FI age patterns show a tendency to decelerate and even decline at advanced ages.
Figure 3.
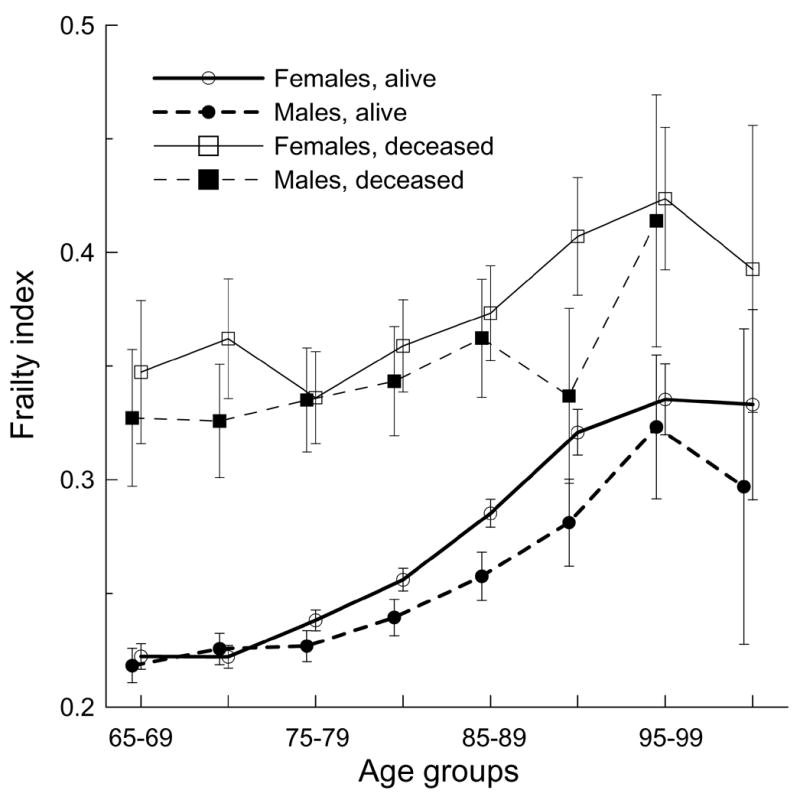
Five-year age patterns of the frailty index for males and females surviving and died within one year after the respective interview. Bars show 95% CI.
In general, females have larger FIs than males both for survivors and decedents. This difference is statistically significant for surviving males and females aged 75–94 years and for male and female decedents aged 90–94 years. Figure 3 clearly shows that individuals with smaller numbers of deficits live longer, despite the difference in chronological age. By contrast, having a large FI irrespective of age can be predictive of death.
3.4. Time to death, chronological age, and the frailty index
Figure 1 and Figure 3 show that the FI can be associated with mortality. Further insights on the associations of the FI and age with survival characteristics can be obtained from the analysis of the relationships among the FI, age, and time to death (TTD). We calculated mean TTD for individuals in given age groups and for individuals with specified FI levels (Figure 4) as the number of days during which an individual stays alive since the date of respective interview. Obviously, both males and females have longer life spans when they are younger. The association of the FI with TTD is similar, i.e., individuals have longer life spans when they have smaller FI values. As expected, mean TTD for females is larger than for males of the same age or FI. It is also seen that TTD declines with FI and age irrespective of sex. An intriguing finding is that magnitude of the TTD for the respective age groups and FI levels are similar, although they are slightly larger (especially for females) at younger, than older, ages.
Figure 4.
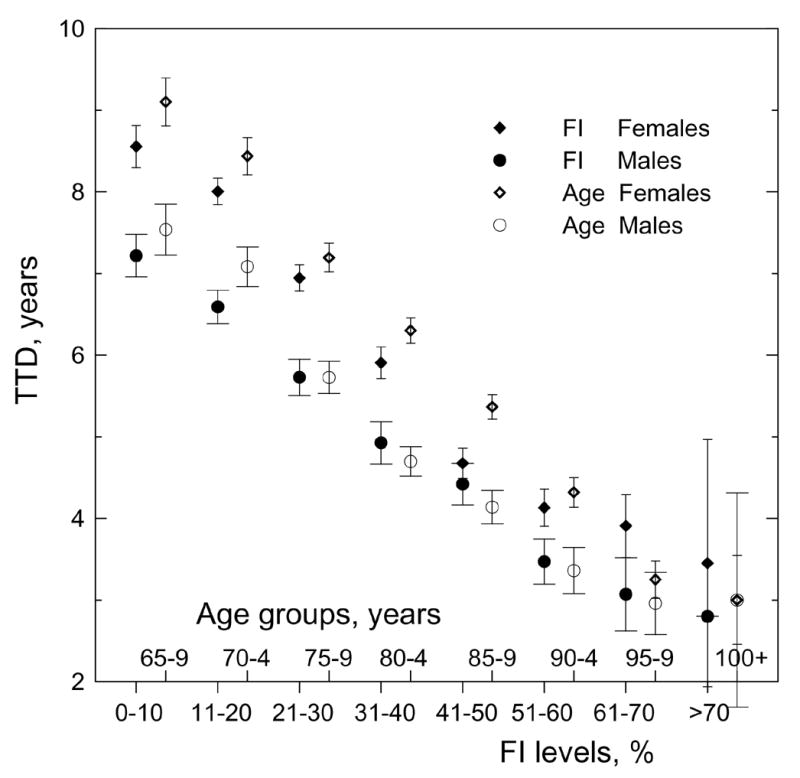
Distribution of time to death (TTD) by frailty index (FI) levels and age groups for both sexes. Bars show 95% CI.
Figure 5 depicts trajectories of the mean FI and age by TTD. This figure confirms the above associations between FI, age, and TTD. It also shows that the FI has a potential to better resolve chances of death, especially during a short-time perspective. To better understand this, we fitted curves to the respective patterns. Among tested functions (linear, exponential, power-law, and quadratic), the best fit was quadratic, y = U + B1 × TTD + B2 × TTD2, where y is FI or age. However, coefficient B2 for the fit of the age-TTD pattern for males was insignificant indicating that a better fit is given by the linear function (see upper insets in Figure 5). For the male and female subgroups, the difference between the respective coefficients B1 and B2 for the quadratic functions fitted to the FI-TTD patterns is statistically insignificant. Also, the slopes of these fits, (B′ × B1 + B2 × TTD) and their variation with TTD (B2), appear similar. Consequently, the TTD-patterns of the FI for males are nearly parallel to the female patterns but shifted down since the male- and female-curve intercepts (U) are statistically different.
Figure 5.
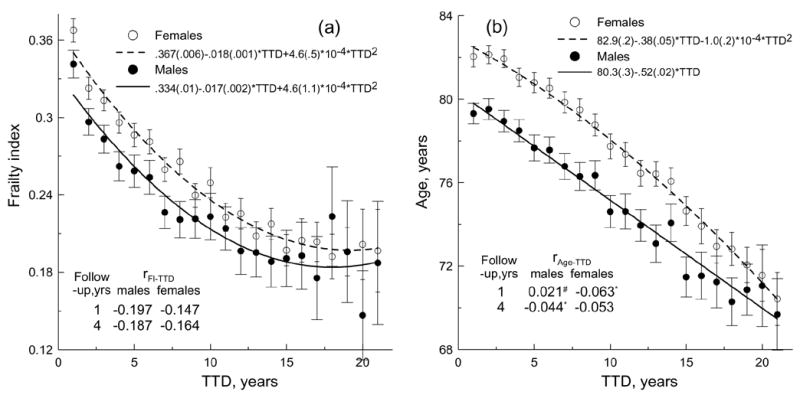
Time to death (TTD) patterns of the FI (a) and chronological age (b) for each sex. Bars show 95% CI. Upper insets show parameters of the best fits. Numbers in parentheses are standard errors. P<0.001 for the fit coefficients. Coefficients of determination are: (a) R2 = 97.6% for females and R2 = 89% for males and (b) R2 = 99.4% for females and R2 = 97.2% for males. Lower insets show correlation coefficients between FI and TTD (rFI– TTD) and between age and TTD (rAge –TTD). Note that#p>.05, *p<.05; for other estimates of the correlation coefficients p<.01.
Using the obtained fits, we can define a parameter characterizing the potential for resolution of the remaining life span, which can be introduced similarly to the contrast concept in physics, i.e.,
Then, for instance, using the fits for females, we find that the contrast is of an order of magnitude larger for the FI than for age (for short TTD intervals), i.e., for two years of life span (i.e., TTDmax = 2 and TTDmin = 0) we have CAge = 0.00484 and CFI = 0.0482. The larger contrast for the FI than for age means that the FI provides a better resolution decreasing uncertainty in the estimation of the remaining life span. This property of the FI is consistently reflected in the correlation of the FI and TTD as compared to the correlation of the age and TTD, i.e., the correlation coefficients rFI–TTD are larger than rAge–TTD for each sex (see lower insets in Figure 5).
3.5. The FI- and Age-Specific Mortality Rates
To ascertain if our observations are manifested in mortality patterns, we calculated one-year age- and FI-specific mortality rates (MRs) for males and females (Figure 6).
Figure 6.
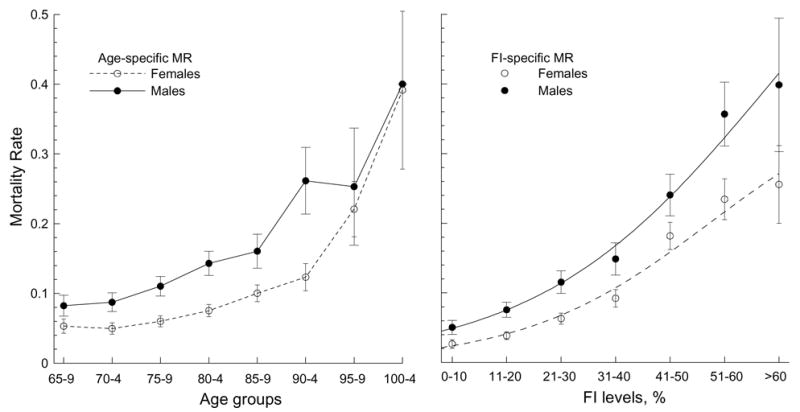
The age- (left) and FI- (right) specific patterns of the mortality rate (MR) for males and females. Bars show 95% CI.
It can be seen that the age-specific MRs exhibit an accelerated increase up to extreme ages both for males and females. Since we are studying a sample with a large proportion (about 80%) of disabled individuals, the MRs in our case are larger than those for the general U.S. elderly population aged 65–85 years (Akushevich et al., 2005). These patterns, however, converge at the oldest-old ages (85+). Figure 6 also shows that the age-specific MRs are significantly larger for males than females up to advanced ages. At extreme ages, the sex-specific patterns converge.
Figure 6 explicitly shows that the FI is associated with mortality. The FI-specific MRs (Figure 6, right panel) exhibit, generally, accelerated patterns with a small acceleration/deceleration at small/large FI and with faster (larger acceleration) increase at moderate FI. Such nonlinear behavior is typical for a logistic model,
where coefficients K, B0, and B1 must be estimated from the data. Indeed, in comparative tests of the fits of exponential, quadratic, power, and logistic functions to the data of Figure 6 (right panel), we found that the logistic function provides the best fit to the data. The logistic function slightly better characterizes the males’ (R2=99%, B0=30.5 [SE=2.86], B1=0.0093 [SE=0.0019] at K=0.8) patterns than the females’ (R2=98%, B0=70.1 [SE 11.5], B1=0.0029 [SE=0.0011] at K=0.4). We can also see in this figure that the mean MR for males is significantly larger than for females for a given FI level.
3.6. Relative Risks of Death
To analyze the relative risk (RR) of death, we performed uni- and multi-variate Cox regression analyses with age or/and FI as basic covariate(s) and with (SEX), and without (No SEX), controls for sex, as well as for males and females separately (Table 1 shows the results of the multivariate analyses using four models considering occurrence of death within one and four years of follow-up). Univariate analyses using either the FI or age as a covariate shows that the respective RRs resemble those from multivariate analyses with both FI and age included. For instance, for one-year follow-up univariate analyses shows that logarithm of the age-specific RR is 0.044 (SE: 0.004) for males and 0.051 (0.004) for females. The logarithm of the FI-specific RR is 0.038 (0.002) for males and 0.045 (0.002) for females. These risks are close to those in the multivariate analyses (Table 1), especially for the FI. This means that the FI and age are largely independently associated with mortality risks (that is also justified by low correlation between the regression coefficients in the multivariate models).
Table 1.
Cox proportional multivariate hazard regression models.
| Observation period, yrs. | Covariate | ln(RR)
|
|||
|---|---|---|---|---|---|
| ALL
|
|||||
| SEX | No SEX | Males | Females | ||
| 1 | AGE | 0.032 (0.003) | 0.027 (0.003) | 0.034 (0.004) | 0.032 (0.004) |
| FI, % | 0.039 (0.001) | 0.039 (0.001) | 0.037 (0.002) | 0.042 (0.002) | |
| 4 | AGE | 0.046 (0.001) | 0.041 (0.001) | 0.047 (0.002) | 0.045 (0.002) |
| FI, % | 0.029 (0.001) | 0.029 (0.001) | 0.028 (0.001) | 0.031 (0.001) | |
Note: RR means relative risk; Numbers in parentheses are standard errors.
p<.001
Table 1 also shows that the RR of death associated with a 1% increment in FI (RRFI) is larger than that because of the one-year increment in age (RRAge) for the one-year follow up. For the four-year follow up, we observe the opposite situation for all models. Nevertheless, in all cases, the integrated risk of death due to accumulated deficits is larger than that due to age. Specifically, while theoretically the FI ranges from 0 to 100%, we define the range of the FI change from zero to the practically observed maximum values of the FI in our data, which is about 70% (this is consistent with other studies (Rockwood and Mitnitski, 2006)). Then, calculating the integrated risk for a 70% FI increment and for a 40-year age increment (age 65 to 105 years) for one-year follow up in the model with control for sex, we obtain that the former is e70 × 0.039 /e40 × 0.032 ≈ 4.3 times larger than the latter. For the four-year follow up, this ratio is smaller: e70 × 0.029 /e40 × 0.046 ≈ 1.2. This means that the FI predicts the chances of death better than chronological age especially within a short-time horizon, which supports our conclusion from the above analyses of the TTD patterns.
Controlling for sex does not change the ln(RRFI), while the ln(RRAge) appears to be larger (compare “SEX” with “No SEX” models, Table 1). Surprisingly, the ln(RRFI) for males is slightly smaller than for females, indicating that the RR for females per 1% of the FI increment is larger than for males. This observation is consistent with the findings of a recent study on sex differences in the risk of death among frail elderly in the Longitudinal Aging Study of Amsterdam (Puts et al., 2005). This is likely due to the facts that females both accumulate more deficits than males over their life and live longer.
Finally, we calculated the age- and FI-specific RRs for the four-year follow up (Figure 7). The first age group (65–69) and the 0–10% FI level were considered as baseline.
Figure 7.
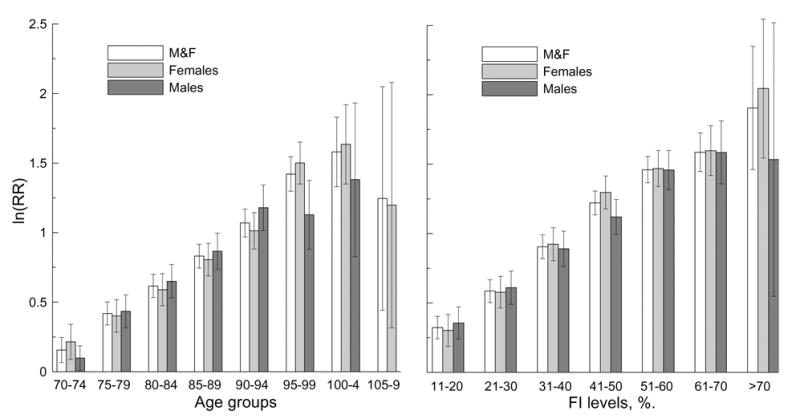
Logarithm of relative risk (RR) of death for different five-year age groups (left panel) and the FI levels (right panel) for the entire sample (controlling for sex) and both sexes for four-year follow up. Thin bars show 95% CI.
It can be seen that ln(RRAge) for the entire sample increases linearly with age until the advanced ages (95–99 age group, R2=99.4) and declines afterward. Linear growth at younger ages is also seen for males (up to 90–94 age group, R2=99.3) and females (up to 90–94 age group R2=99.9), although at advanced ages we observe deviation from the linear increase for both sexes. The ln(RRFI) patterns for the entire sample as well as for females and males also exhibit linear growth up to the 51–60% interval of the FI (R2=99.8 for the entire sample; R2=98.9 for females, and R2=99.7 for males). Deviation from the linear growth of the exponential factor (i.e., ln(RR)) at the highest ages and largest values of the FI implies that the entire RR patterns are not exponential functions of age or the FI. Our analyses do not show statistically significant differences in the RR of death for males and females, except for those aged 95–99.
4. Discussion and Conclusions
Our analyses provide evidence in support of the following three major conclusions. First, the FI can be useful characteristic of the aging phenotype in models of mortality, aging, and survival. Second, the FI can characterize the aging-related processes independently of chronological age. Third, the FI is a better indicator of these processes than chronological age.
The arguments toward the first conclusion follow from the similarities between the statistical characteristics of the FI- and age-specific outcomes revealed in our study. For instance, the time-to-death, mortality-rate, and relative-risk-of-death FI- and age-specific patterns show similarities in the nonlinear shape of the respective distributions and in the nature of their behaviors, e.g., accelerated growth for the relative risk patterns up to advanced aged and subsequent leveling off. An intriguing finding pertains to the behavior of the FI-specific mortality rates, which exhibit an accelerated increase up to certain FI values and a subsequent deceleration at larger values of the FI. Such behavior is in line with the age-specific pattern of the mortality rates at the old and oldest-old ages observed in humans and laboratory animals (Akushevich et al., 2005; Carey et al., 1992; Vaupel et al., 1998).
An advantage of the FI concept for modeling aging phenotypes is that the FI can easily be constructed using data from typical population-based studies. The FI has also a potential to bring into the analyses so-called mild-effect traits which are typically ignored due to their insignificant individual effects. Consequently, the FI is a promising measure of overall health/well-being not only for geriatricians, but also for specialists in other fields of aging research.
The second conclusion is supported, first, by the low correlation between the FI and age (Section 3.2). Figure 2 reveals the nature of such a low correlation: low FIs are not necessarily associated with younger ages and, thus, are characteristics of, generally, distinct individuals. Second, univariate and multivariate Cox regression analyses using as covariates age and the FI show small differences (statistically insignificant for males) between the respective relative risks (and low correlation between the regression coefficients in the multivariate analyses). This implies that the risk of death caused by the FI basically contributes to the adjustment of the baseline hazard (i.e., the intercept coefficient in the Gompertz’s approximation of the mortality rate), and has very little effect on the rate of the mortality change with age (i.e., the slope parameter of the Gompertz’s curve). Specifically, for the multivariate analysis the mortality function is given by
In the univariate case, the respective mortality function can be approximated by the Gompertz’s function
When β10 ≈ β1 (that approximately holds for males, see Section 3.6), we have μ01 ≈ μ0 exp (β2 FI) because the risk μ is measured in the same sample of individuals. Therefore, chronological age and the FI reflect largely distinct aging-associated processes and, consequently, they are rather independent measures of aging.
These findings might have implications for the “compensation law of mortality” (Gavrilov and Gavrilova, 2006) or Strehler-Mildvan correlation (Strehler, 1977; Strehler and Mildvan, 1960) which implies that higher values of the slope parameter β10 are “compensated” by lower magnitudes of the intercept parameter μ01. Taking into account that the aging process can be described by measures which can be largely independent of the chronological age, the compensation law of mortality appears to be a matter of which aspects of the aging processes are captured by the Gompertz’s model.
For the third conclusion a first argument is that, for the short observation periods, the correlation between the FI and time to death (i.e., remaining life span) is higher than that between the age and time to death. Note, this observation is consistent with the dynamic view of frailty (Fried et al., 2004; Mitnitski et al., 2004) which implies that aging with dysregulation of multiple physiological systems likely results in a faster health decline than in the case of normal (without dysregulation) aging and would be more pronounced at short-time periods. Such differences result in increased mortality for individuals with dysregulation, and, consequently, in a larger correlation of the FI than age with time to death. A second argument is that the FI can more precisely characterize remaining life span than age because of better resolution (Section 3.4). This fact is supported by the higher contrast we found for the FI- (concave shape) than age-(convex shape) specific time-to-death patterns. A third argument is that the relative risk of death due to accumulated deficits is larger than that due to attained age as shown by the multivariate Cox regression analyses. This implies that the FI can better characterize chances of death especially for short-time horizons.
Our analysis also suggests that the FI has a potential to capture fundamental processes associated with sex differences. Specifically, as expected from prior studies, we find that females have lower age-specific mortality outcomes than males. Females, however, can have larger values of the FI for the same age than males. One possible explanation of these features which appear to be study independent (Mitnitski et al., 2005) is that females may have a larger behavior (Boerner, 2004) and/or physiological (Patten et al., 1998; Ward and Cohen, 2004) adaptation capacity than males. This hypothesis, however, deserves separate study. Sex-insensitivity of the FI when it is large (see Figures 1, 3, and 5) might indicate a saturation effect – as health problems begin to affect the majority of an organism’s critical subsystems, sex becomes less important. The presence of survivors with large FI (see Figure 1) along with sex-insensitivity at large FI might be due to a high level of non-sex-specific stress-resistance in those individuals as suggested by experiments on laboratory animals (Semenchenko et al., 2004). Our analysis also clearly shows that males surviving to the same age as females are healthier, i.e., the FI can be an indicator of the sex-specific life span sensitive to the health/well-being status.
Acknowledgments
The research reported in this paper was supported by the NIH/NIA grants 5UO1-AG-007198-18, 1R01 AG028259-01, 1R01-AG-027019-01 and 5P01-AG-008761-16 from the National Institute on Aging (NIA). A.K. also acknowledges support from K12-AG-000982-05 NIA grant.
Footnotes
Publisher's Disclaimer: This is a PDF file of an unedited manuscript that has been accepted for publication. As a service to our customers we are providing this early version of the manuscript. The manuscript will undergo copyediting, typesetting, and review of the resulting proof before it is published in its final citable form. Please note that during the production process errors may be discovered which could affect the content, and all legal disclaimers that apply to the journal pertain.
References
- Akushevich I, Manton K, Kulminski A. Human Mortality and Chronic Disease Incidence at Extreme Ages: New Data and Analysis 2005; Population Association of America annual meeting; Philadelphia, USA. 2005. p. 47. [Google Scholar]
- Boerner K. Adaptation to disability among middle-aged and older adults: the role of assimilative and accommodative coping. J Gerontol B Psychol Sci Soc Sci. 2004;59:P35–42. doi: 10.1093/geronb/59.1.p35. [DOI] [PMC free article] [PubMed] [Google Scholar]
- Carey JR, Liedo P, Orozco D, Vaupel JW. Slowing of mortality rates at older ages in large medfly cohorts. Science. 1992;258:457–461. doi: 10.1126/science.1411540. [DOI] [PubMed] [Google Scholar]
- Ferrucci L, Guralnik JM, Cavazzini C, Bandinelli S, Lauretani F, Bartali B, Repetto L, Longo DL. The frailty syndrome: a critical issue in geriatric oncology. Crit Rev Oncol Hematol. 2003;46:127–137. doi: 10.1016/s1040-8428(02)00177-4. [DOI] [PubMed] [Google Scholar]
- Fisher AL. Just what defines frailty? J Am Geriatr Soc. 2005;53:2229–2230. doi: 10.1111/j.1532-5415.2005.00510.x. [DOI] [PubMed] [Google Scholar]
- Fried LP, Ferrucci L, Darer J, Williamson JD, Anderson G. Untangling the concepts of disability, frailty, and comorbidity: implications for improved targeting and care. J Gerontol A Biol Sci Med Sci. 2004;59:255–263. doi: 10.1093/gerona/59.3.m255. [DOI] [PubMed] [Google Scholar]
- Gavrilov L, Gavrilova N. Reliability Theory of Aging and Longevity. In: Masoro EJ, Austad SN, editors. The handbooks of aging. Elsevier Academic Press; Amsterdam; Boston: 2006. pp. 1–40.pp. 660 [Google Scholar]
- Goggins WB, Woo J, Sham A, Ho SC. Frailty index as a measure of biological age in a Chinese population. J Gerontol A Biol Sci Med Sci. 2005;60:1046–1051. doi: 10.1093/gerona/60.8.1046. [DOI] [PubMed] [Google Scholar]
- Jones DM, Song X, Rockwood K. Operationalizing a frailty index from a standardized comprehensive geriatric assessment. J Am Geriatr Soc. 2004;52:1929–1933. doi: 10.1111/j.1532-5415.2004.52521.x. [DOI] [PubMed] [Google Scholar]
- Kirkwood TB. Molecular gerontology. J Inherit Metab Dis. 2002;25:189–196. doi: 10.1023/a:1015625811569. [DOI] [PubMed] [Google Scholar]
- Kovtun M, Akushevich I, Manton KG, Tolley HD. Linear latent structure analysis: Mixture distribution models with linear constraints. Statistical Methodology. 2006 in press. [Google Scholar]
- Kulminski A, Yashin A, Ukraintseva S, Akushevich I, Arbeev K, Land K, Manton K. Accumulation of health disorders as a systemic measure of aging: Findings from the NLTCS data. Mech Ageing Dev. 2006;127:840–848. doi: 10.1016/j.mad.2006.08.005. [DOI] [PMC free article] [PubMed] [Google Scholar]
- Manton KG, Gu X. Changes in the prevalence of chronic disability in the United States black and nonblack population above age 65 from 1982 to 1999. Proc Natl Acad Sci U S A. 2001;98:6354–6359. doi: 10.1073/pnas.111152298. [DOI] [PMC free article] [PubMed] [Google Scholar]
- Manton KG, Woodbury MA, Tolley HD. Statistical applications using fuzzy sets. J. Wiley; New York: 1994. [Google Scholar]
- Mitnitski A, Graham J, Mogilner A, Rockwood K. Frailty, fitness and late-life mortality in relation to chronological and biological age. BMC Geriatr. 2002;2:1. doi: 10.1186/1471-2318-2-1. [DOI] [PMC free article] [PubMed] [Google Scholar]
- Mitnitski A, Song X, Rockwood K. The estimation of relative fitness and frailty in community-dwelling older adults using self-report data. J Gerontol A Biol Sci Med Sci. 2004;59:M627–632. doi: 10.1093/gerona/59.6.m627. [DOI] [PubMed] [Google Scholar]
- Mitnitski A, Song X, Skoog I, Broe GA, Cox JL, Grunfeld E, Rockwood K. Relative fitness and frailty of elderly men and women in developed countries and their relationship with mortality. J Am Geriatr Soc. 2005;53:2184–2189. doi: 10.1111/j.1532-5415.2005.00506.x. [DOI] [PubMed] [Google Scholar]
- Mitnitski AB, Mogilner AJ, Rockwood K. Accumulation of deficits as a proxy measure of aging. ScientificWorldJournal. 2001;1:323–336. doi: 10.1100/tsw.2001.58. [DOI] [PMC free article] [PubMed] [Google Scholar]
- Patten RD, Udelson JE, Konstam MA. Ventricular remodeling and its prevention in the treatment of heart failure. Curr Opin Cardiol. 1998;13:162–167. [PubMed] [Google Scholar]
- Puts MT, Lips P, Deeg DJ. Sex differences in the risk of frailty for mortality independent of disability and chronic diseases. J Am Geriatr Soc. 2005;53:40–47. doi: 10.1111/j.1532-5415.2005.53008.x. [DOI] [PubMed] [Google Scholar]
- Rockwood K, Mitnitski A. Limits to deficit accumulation in elderly people. Mech Ageing Dev. 2006;127:494–496. doi: 10.1016/j.mad.2006.01.002. [DOI] [PubMed] [Google Scholar]
- Rockwood K, Mitnitski A, Song X, Steen B, Skoog I. Long-term risks of death and institutionalization of elderly people in relation to deficit accumulation at age 70. J Am Geriatr Soc. 2006;54:975–979. doi: 10.1111/j.1532-5415.2006.00738.x. [DOI] [PubMed] [Google Scholar]
- Rockwood K, Mogilner A, Mitnitski A. Changes with age in the distribution of a frailty index. Mech Ageing Dev. 2004;125:517–519. doi: 10.1016/j.mad.2004.05.003. [DOI] [PubMed] [Google Scholar]
- Semenchenko GV, Khazaeli AA, Curtsinger JW, Yashin AI. Stress resistance declines with age: analysis of data from a survival experiment with Drosophila melanogaster. Biogerontology. 2004;5:17–30. doi: 10.1023/b:bgen.0000017681.46326.9e. [DOI] [PubMed] [Google Scholar]
- Song X, Mitnitski A, MacKnight C, Rockwood K. Assessment of individual risk of death using self-report data: an artificial neural network compared with a frailty index. J Am Geriatr Soc. 2004;52:1180–1184. doi: 10.1111/j.1532-5415.2004.52319.x. [DOI] [PubMed] [Google Scholar]
- Strehler BL. Time, cells, and aging. Academic Press; New York: 1977. [Google Scholar]
- Strehler BL, Mildvan AS. General theory of mortality and aging. Science. 1960;132:14–21. doi: 10.1126/science.132.3418.14. [DOI] [PubMed] [Google Scholar]
- Vanitallie TB. Frailty in the elderly: contributions of sarcopenia and visceral protein depletion. Metabolism. 2003;52:22–26. doi: 10.1016/s0026-0495(03)00297-x. [DOI] [PubMed] [Google Scholar]
- Vaupel JW, Carey JR, Christensen K, Johnson TE, Yashin AI, Holm NV, Iachine IA, Kannisto V, Khazaeli AA, Liedo P, Longo VD, Zeng Y, Manton KG, Curtsinger JW. Biodemographic trajectories of longevity. Science. 1998;280:855–860. doi: 10.1126/science.280.5365.855. [DOI] [PubMed] [Google Scholar]
- Vaupel JW, Manton KG, Stallard E. The impact of heterogeneity in individual frailty on the dynamics of mortality. Demography. 1979;16:439–454. [PubMed] [Google Scholar]
- Ward NS, Cohen LG. Mechanisms underlying recovery of motor function after stroke. Arch Neurol. 2004;61:1844–1848. doi: 10.1001/archneur.61.12.1844. [DOI] [PMC free article] [PubMed] [Google Scholar]
- Woo J, Goggins W, Sham A, Ho SC. Public health significance of the frailty index. Disabil Rehabil. 2006;28:515–521. doi: 10.1080/09638280500215867. [DOI] [PubMed] [Google Scholar]
- Yashin AI, Arbeev KG, Kulminski A, Akushevich I, Akushevich L, Ukraintseva SV. Cumulative index of elderly disorders and its dynamic contribution to mortality and longevity. Rejuvenation Research. 2006a doi: 10.1089/rej.2006.0500. in press. [DOI] [PubMed] [Google Scholar]
- Yashin AI, Arbeev KG, Kulminski A, Akushevich I, Akushevich L, Ukraintseva SV. Health Decline, Aging And Mortality: How Are They Related? Biogerontology. 2006b doi: 10.1007/s10522-006-9073-3. in press. [DOI] [PMC free article] [PubMed] [Google Scholar]
- Yashin AI, Iachine IA, Begun AZ. Mortality Modeling: A Review. Mathematical Population Studies. 2000;8:305–332. [Google Scholar]