

Summary
Visual motion perception relies on two opposing operations: Integration and Segmentation. Integration overcomes motion ambiguity in the visual image by spatial pooling of motion signals, whereas segmentation identifies differences between adjacent moving objects. For visual motion area MT, previous investigations have reported that stimuli in the receptive field surround, which do not elicit a response when presented alone, can nevertheless modulate responses to stimuli in the receptive field center. The directional tuning of this “surround modulation” has been found to be mainly antagonistic and hence consistent with segmentation. Here we report that surround modulation in area MT can be either antagonistic or integrative depending upon the visual stimulus. Both types of modulation were delayed relative to response onset. Our results suggest that the dominance of antagonistic modulation in previous MT studies was due to stimulus choice and that segmentation and integration are achieved, in part, via adaptive surround modulation.
Introduction
Unlike the stimuli typically used to probe visual motion processing in the laboratory, natural visual scenes are filled with multiple moving features. Some of those features provide relatively reliable motion information whereas other features provide unreliable or ambiguous information. The “aperture problem” (Wallach, 1935; Wuerger et al., 1996; Marr and Ullman, 1981; Adelson and Movshon, 1982) provides one type of ambiguity: Motion parallel to a one-dimensional (1–D) feature, such as a contour, is invisible and hence the motion of a 1-D feature is indeterminate (Figure 1A). One way to overcome the aperture problem is to integrate motion information from differently oriented 1-D features. For example, the motion information arising from the horizontal contours of the square shown in Figure 1A could be integrated with that provided by the vertical contours. The aperture problem can also be overcome by integrating the unambiguous motion information provided by two-dimensional (2-D) features with the ambiguous information arising from a 1-D feature. The corners of the square seen in Figure 1A are one type of 2-D feature. For stimuli, such as squares, that possess 1-D features with different orientations as well as 2-D features, both types of motion integration may be utilized by the visual system to overcome the aperture problem.
Figure 1.
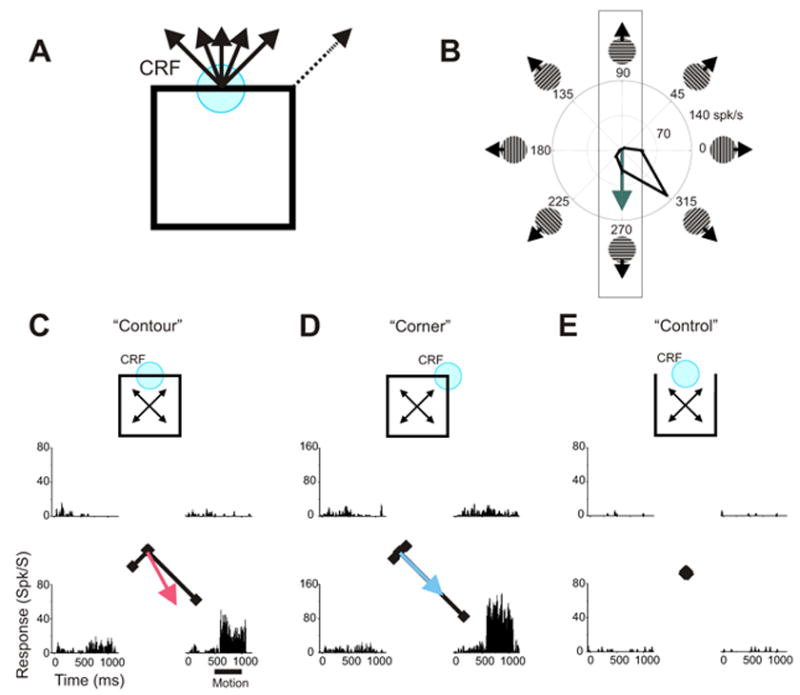
The “aperture problem” and responses from a representative MT neuron. A. The motion of a 1-D feature, such as a contour, viewed through an aperture defined by a CRF is consistent with a family of motions (solid arrows). 2D features, such as corners, provide unambiguous motion information (dashed arrow). B. Directional tuning measured with drifting gratings. Responses to upward and downward motions were used to produce the Local Prediction (green arrow). Responses to downward motion were stronger than to upward motion and hence the Local Prediction points downward. C. Responses to one contour of a square shown as PSTHs and vectors. The Contour Directional Preference (red arrow) was the direction of the averaged response vector. The motion period (dark bar) was from 500 to 1000 ms after stimulus onset. D. Responses to one corner of the square shown as PSTHs and vectors (scale is different from that in C and E to facilitate comparisons of directional tuning). The Global Prediction (blue arrow) was based on these responses. E. No significant responses were observed in the “control conditions”; therefore the sensitivity to the global motion of the square observed under contour conditions reflects surround modulation rather than CRF stimulation. PSTHs were based on 15 trials.
At the neuronal level, the aperture problem arises when only a single 1-D feature is present in the classical receptive field (CRF): the region of visual space within which a stimulus evokes neuronal activity. In the example shown in Figure 1A, integration of the motion information supplied by the parts of the square outside the CRF would allow disambiguation of the motion of the horizontal contour within the CRF. However, integration yields a veridical motion representation only if those motions arise from the same object: motion signals arising from different objects should be segregated to achieve segmentation. Integration and segmentation constitute two fundamental types of motion processing that work in opposite directions (Braddick, 1993). Although these two opposing processes have been much-investigated at the perceptual level, the underlying neuronal mechanisms are far from understood.
Cortical area MT of the primate is known to play a central role in visual motion processing (Dubner and Zeki, 1971; Baker et al., 1981; Maunsell and Van Essen, 1983a; Albright, 1984; Britten et al., 1992; Duncan et al., 2000; Pack et al., 2004) and is thus a candidate to underlie motion integration and segmentation. Indeed, neurophysiological experiments have revealed evidence of both integration and segmentation when multiple moving features are placed within the CRF of area MT neurons (Adelson and Movshon, 1982; Stoner and Albright, 1992; Thiele and Stoner, 2003). While visual stimuli outside the CRFs of MT neurons do not, by themselves, elicit neuronal responses, such “surround” stimuli can modulate responses to stimuli within the CRF (Allman et al., 1985a; Albright and Stoner, 2002; Born and Bradley, 2005). The directional tuning of surround modulation in area MT has been found to be mostly antagonistic (Allman et al., 1985b; Tanaka et al., 1986; Xiao et al., 1995; Raiguel et al., 1995): CRF stimuli moving in the “preferred” direction yield (by definition) larger responses relative to non-preferred directions, but surround modulation of CRF responses is such that responses are smaller for surround stimuli moving in that preferred direction than in non-preferred directions. This directional antagonism1 has been proposed to support motion segmentation (Allman et al, 1985a; Nakayama and Loomis, 1974).
To overcome ambiguity within the CRF via surround modulation, the directional tuning of that modulation needs to be integrative rather than antagonistic: surround stimuli moving in the “preferred” direction should, like CRF stimuli, yield larger responses relative to surround stimuli moving in “non-preferred” directions. Unlike directional antagonism, directional integration has been encountered relatively infrequently in MT (Allman et al., 1985b; Tanaka et al., 1986). Some studies have reported “reinforcing surrounds” in MT of the owl monkey (Born and Tootell, 1992; Berezovskii and Born, 2000; Born, 2000), but this directional reinforcement does not appear to constitute surround modulation: Stimuli in the “reinforcing surround” elicited responses even in the absence of stimuli at the center. This suggests that the “reinforcing surround” is part of the CRF and accordingly has the same directional tuning as the center of the receptive field (RF).
Based on the existing data it might therefore seem unlikely that area MT neurons could overcome the aperture problem via directional integration. Previous characterizations of the directional selectivity of surround modulation in area MT have not, however, used stimuli that present the aperture problem. We hypothesized that the directional tuning of surround modulation in area MT is not fixed. Specifically, we hypothesized that stimuli that present an ambiguously moving 1-D feature within the CRF and disambiguating motion information in the surround would elicit integrative rather than antagonistic modulation. To test this hypothesis, we used the moving square stimulus depicted in Figure 1A, which presented ambiguous motion within the CRF and elicits an unambiguous percept of integration. Under these stimulus conditions, we found that individual area MT neurons exhibited directional integration that overcame the local motion ambiguity. By contrast, when the ambiguous motion in the CRF was replaced by unambiguous motion (i.e. of moving dots), we found that the same MT neurons exhibited directional antagonism. The surround modulation seen with these stimuli was, consistent with previous investigation, predominately directional antagonism. Our results reveal that, for individual MT neurons, the directional modulation of a given region of the surround is not fixed but can be either integrative or antagonistic depending upon the visual stimulus. This adaptive surround modulation provides a flexible and economical implementation of the opposing operations of motion integration and segmentation.
Results
Aperture problem and integrative surround modulation in MT
We recorded from neurons in area MT of three awake macaque monkeys. Figure 1C shows the responses of a representative MT neuron to a contour moving within its CRF. This horizontally oriented contour was part of a square that moved in one of four oblique “global” directions. Due to the aperture problem, however, there were only two distinguishable “local” motions within the CRF: upwards and downwards. Neuronal responses to the four motion conditions are shown as post-stimulus time histograms (PSTHs) and as vectors in which angle and length indicate the global direction of the square and the response magnitude, respectively. These “contour responses” (Figure 1C) suggest sensitivity, not just to the local motion of the contour within the CRF, but also to the global motion of the square: For downward local motions, responses were stronger when the square moved down and to the right than when it moved down and to the left even though the CRF stimulus was identical in these two cases. This directional bias was consistent with that seen when one of the corners of the moving square was centered within the CRF (Figure 1D).
To determine whether this bias arose from the rest of the square (i.e. other than the contour passing through the CRF) intruding into the CRF, we examined responses to control stimuli for which the contour passing through the CRF had been deleted (Figure 1E). No part of this contour provides information about the global motion of the square. These control stimuli thus consist of the portion of the moving square that allows the global motion of the contour within the CRF to be recovered. As seen in Figure 1E, control stimuli did not elicit any significant response. Therefore, the sensitivity to the global motion of the square seen under contour conditions was not due to the intrusion of disambiguating features into the CRF. The directional selectivity of the modulation seen with the contour stimuli matched rather than opposed that seen in the responses to CRF stimuli: when stimulated with an ambiguously moving contour in its CRF, this neuron behaved as if the rest of the square were also in its CRF. This directional surround modulation is thus integrative.
To characterize this direction-selective surround modulation, we first computed the “Contour Directional Preference,” (red arrow, Figure 1C) which was the direction of the vector average of the four contour response vectors. We then compared the Contour Directional Preference with local and global predictions. The Global Prediction was the directional preference seen in response to the moving square when one of the corners was centered in the CRF (blue arrow, Figure 1D). This Global Prediction, the average of the four corner response vectors, points downward and to the right, indicating a preference for motion in that direction. Whereas these stimuli could move in one of four global directions of motion, there were only two locally differentiable motions within the CRF and these two motions defined a single axis (illustrated by the rectangle in Figure 1B). Accordingly, the Local Prediction was the directional preference along that axis. This axial preference was determined by averaging the response vectors seen for gratings moving in those two directions. For the example neuron illustrated in Figure 1, this Local Prediction points down (green arrow, Figure 1B). To permit comparison of the Contour Directional Preference with the two predictions, the three vectors from this example are shown together in Figure 2A.
Figure 2.
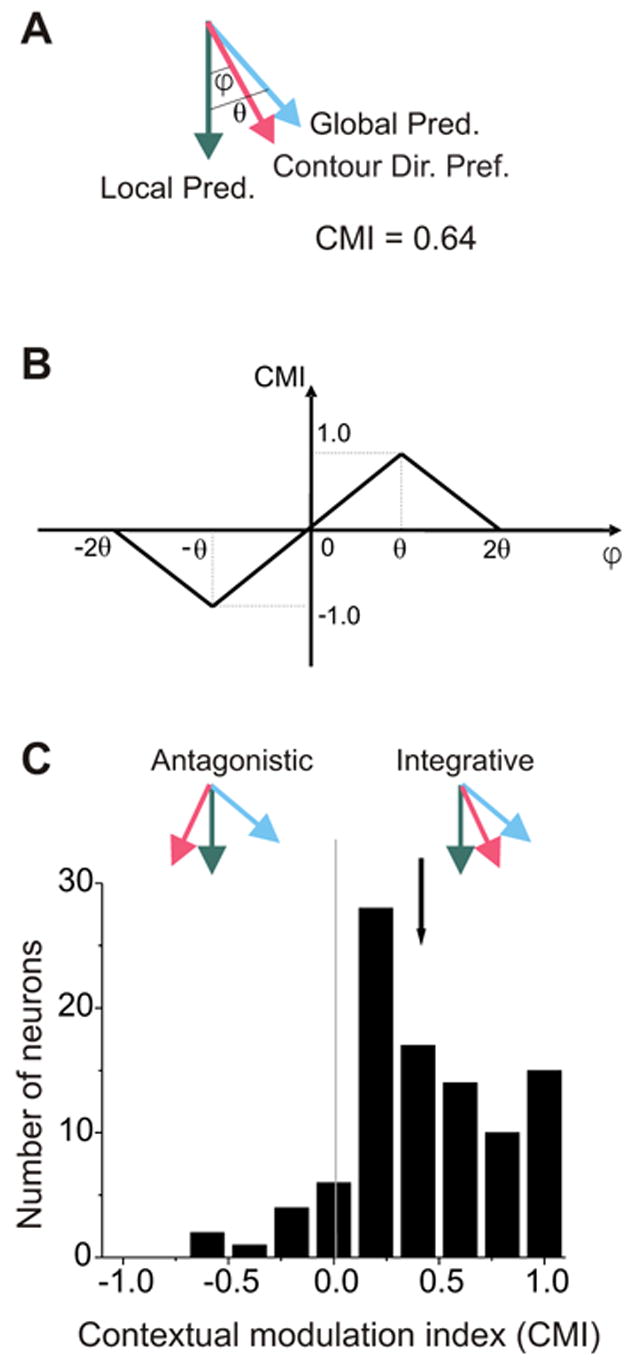
Integrative surround modulation in area MT. A. The Contour Directional Preference, the Local Prediction, and the Global Prediction from Figure 1. ϕ is the angular difference between the Contour Directional Preference and the Local Prediction. θ is the angular difference between the Global Prediction and the Local Prediction. B. CMI Definition. The Contextual Modulation Index (CMI) varies linearly from -1 to 1 as ϕ varies from -θ to θ. The magnitude of the CMI falls off linearly as the absolute value of ϕ deviates from θ (see text). The CMI for the neuronal data shown in Figures 1 and 2a was 0.64. C. CMI frequency distribution for sample of MT neurons (N = 97). Positive CMIs correspond to integrative modulation; the Contour Directional Preference (red) is biased away from the Local Prediction (green) toward the Global Prediction (blue). Negative CMIs indicate antagonistic modulation; the Contour Directional Preference is biased in the opposite direction. Black arrow indicates the mean of this distribution. Most MT neurons exhibited integrative modulation under these conditions.
We devised a Contextual Modulation Index (CMI) such that a positive CMI indicates directional integration and a negative CMI indicates directional antagonism. The value of the CMI is positive when the Contour Directional Preference deviates from the Local Prediction and toward the Global Prediction. The value of the CMI is negative when the Contour Directional Preference deviates from the Local Prediction and away from the Global Prediction. More specifically, Contour Directional Preferences matching the Local and Global Predictions were designated as 0 and 1, respectively (Figure 2B). Deviations of the Contour Directional Preference from the Global Prediction, whether toward or away from the Local Prediction, indicate that neuronal responses imperfectly reflect the global motion of the square and the CMI was designed accordingly (Figure 2B, see Supplementary Material S1 for results using a simpler measure). To provide a symmetrical metric, we defined the Antagonism Prediction to be the mirror-image of the Global Prediction: the same angular difference as between the Local and Global Predictions but with the opposite sign. By this scheme, Contour Directional Preferences aligned with the Antagonism Prediction are indicated by CMIs of −1. The CMI varies linearly from −1 (maximum antagonism) to 1 (maximum integration) as the Contour Directional Preference varies from the Antagonism Prediction to the Global Prediction. Importantly, because this metric is symmetrical relative to the Local Prediction, if area MT neurons were insensitive to the direction of motion of surround stimuli, the mean of the CMI distribution should not be significantly different from zero.
The example neuron from Figure 1 had a CMI of 0.64 (Figure 2A). The mean CMI of 97 neurons in our population recorded from three macaque monkeys was 0.42 (indicated by black arrow in Figure 2C), which was significantly greater than zero (student t-test, P 《 0.0001). Eighty-eight percent (85 of 97) of these neurons yielded positive CMIs. None of these 97 neurons gave significant responses to control stimuli (Wilcoxon signed rank test, P>0.05, see Methods). Since the control stimuli constitute the portion of the contour stimuli that provide information that can disambiguate the motion of the contour within the CRF, we conclude that the predominately positive CMIs observed for contour stimuli reflect integrative surround modulation rather than CRF stimulation.
Surround modulation in MT is stimulus dependent
Our results appear to contradict previous reports that the directional tuning of area MT surround modulation is largely antagonistic (for reviews see Allman et al., 1985a; Albright and Stoner, 2002; Born and Bradley, 2005). One possible explanation for this discrepancy is that, despite their relative rarity in earlier reports, our neuronal sample was biased towards neurons with integrative surrounds. Another possibility follows from the finding that MT surrounds are spatially heterogeneous (Xiao et al., 1995; Xiao et al., 1997). Perhaps the geometry and placement of our stimuli was such that they stimulated parts of the surround that, on average, were more integrative than antagonistic. A related hypothesis is that our control stimuli were placed in sub-threshold regions of the RF that had the same directional preferences as the RF center (see Discussion). These hypotheses all assume that the directional selectivity of a given region of the surround is fixed. If this assumption were true, the surround stimulus should yield integrative modulation whenever the RF center was stimulated. We also considered an alternative hypothesis, namely that the directional selectivity of surround modulation is not fixed, but rather dependent on the visual stimulus.
To distinguish among these possibilities we tested a subset of our neuronal population with contour stimuli as well as with modified stimuli in which the contour passing through the CRF was replaced by random dots moving within a circular aperture (illustrated in Figure 3E). These “dot stimuli” resembled the stimuli used in previous investigations of area MT surround modulation, in that moving 2D features were present in both the CRF and the surround. The dots in these stimuli had the same velocity as the local motion of the contour they replaced. Critically, the portion of the dot and contour stimuli that distinguishes the local motion within the CRF from the oblique motion in the surround is identical. This portion, as observed above, defines our control stimulus (as shown in Figure 1E). Surround stimulation by this critical portion is therefore identical for all three stimulus types (i.e. dot, contour, and control stimuli). If the region of the visual field stimulated by this portion of these stimuli had fixed directional tuning, we should observe integrative modulation for both contour and dot stimuli. Responses of a representative neuron to contour and dot stimuli are shown in Figures 3D and E, respectively (See Supplementary Material S2 for another example). For contour stimuli, the CMI of this neuron was 0.63 indicating directional integration: the Contour Directional Preference (red arrow) was biased away from the Local Prediction (green arrow) towards the Global Prediction (blue arrow). When presented with dot stimuli, however, surround modulation was directionally antagonistic rather than integrative: responses were smaller when the surround features moved down and to the left (the preferred direction for CRF stimuli) than when they moved down and to the right; the resultant CMI was −0.19. Figure 4 shows the results from the 41 neurons tested from two monkeys. Each point in the graph represents the CMIs calculated from the responses of a single neuron to contour stimuli (abscissa) and to dot stimuli (ordinate).
Figure 3.
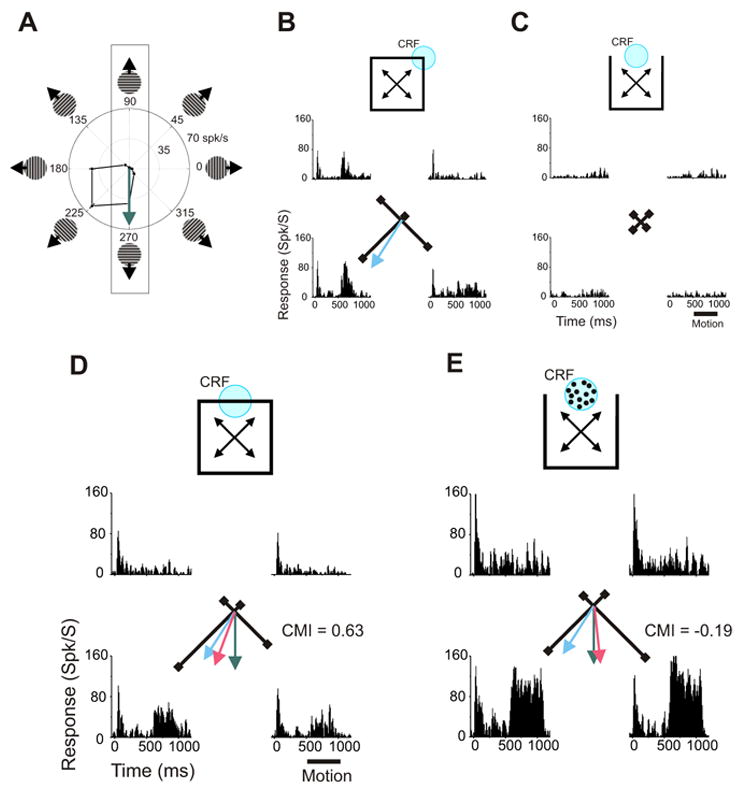
Adaptive surround modulation in area MT – single neuron example. A. Directional tuning measured with drifting gratings. The Local Prediction is indicated by the green arrow. B. Responses to one corner of the square shown as PSTHs and vectors. The Global Prediction is indicated by the blue arrow. C. No significant responses were elicited by control stimuli. D. Responses to one contour of an intact square shown as PSTHs and vectors. The Contour Directional Preference (red arrow) was biased away from the Local Prediction (green arrow) towards the Global Prediction (blue arrow). The CMI was 0.63 indicating surround integration. E. Responses of the same neuron to dots moving either upward or downward within the CRF. The surround stimulus moved in one of the four oblique directions. The direction of the mean response vector is biased away from the Local Prediction towards the Antagonism Prediction (mirror-image of the Global Prediction; not shown to avoid clutter). The CMI was −0.19 indicating surround antagonism. PSTHs were based on 10 trials.
Figure 4.
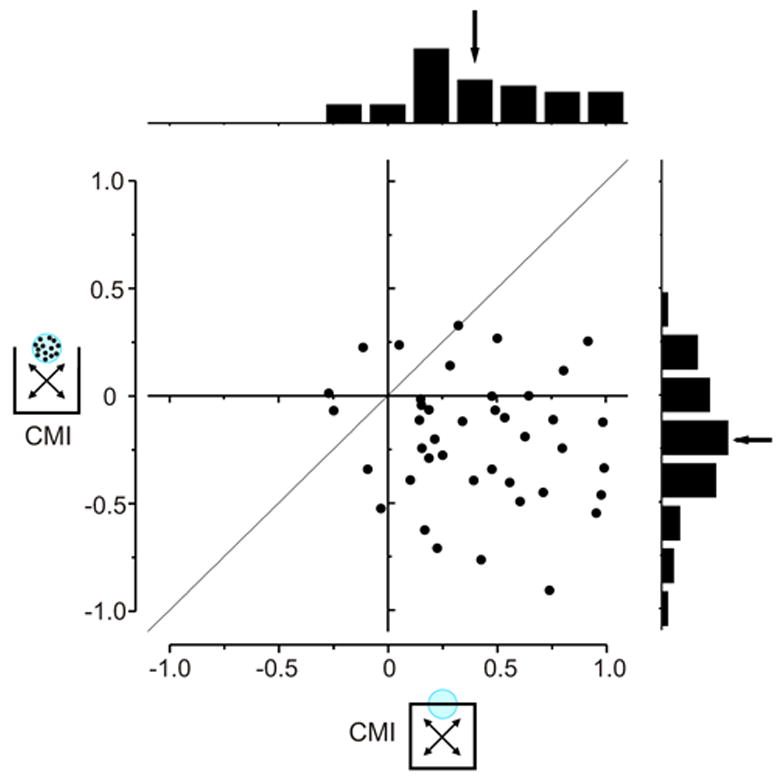
Adaptive surround modulation in area MT. Scatter plot and marginal distributions of CMIs for contour (abscissa) and dot (ordinate) stimuli. Each point represents data from one neuron. Across the neuronal population, surround modulation was predominately integrative for contour stimuli and predominately antagonistic for dot stimuli.
Eighty-eight percent of the neurons tested with both contour and dot stimuli (36 out of 41 neurons) yielded larger CMIs in response to contour stimuli than in response to dot stimuli. The average CMI for contour stimuli was significantly greater than for dot stimuli (paired t-test, P 《 0.0001). For contour stimuli, the average CMI was 0.40, which was significantly greater than zero (student t-test, P 《 0.0001) and matched that of the larger population (Figure 2C). The average CMI for dot stimuli was −0.20 and was significantly less than zero (student t-test, P < 0.0001).
These results show that the integrative effects found for contour stimuli did not arise from a biased sample that excluded neurons with antagonistic surrounds. Nor were those integrative effects due to our stimuli activating fixed integrative regions of the surround. Similarly, these results cannot be explained by assuming that the surround portion of our stimuli were in sub-threshold RF regions that had the same directional tuning as the RF center. Instead, our results demonstrate that at the spatial scale of our stimuli, a given region of the surround can act either antagonistically or integratively depending upon the stimulus. These neuronal effects parallel perception: Human subjects report unambiguous motion integration for contour stimuli and motion segmentation (i.e. dots are perceptually repelled away from surround stimuli) for dot stimuli (data not shown).
Time course of surround modulation
Although there is evidence that directional antagonism in area MT is delayed relative to response onset (Allman et al., 1985b; Perge et al., 2005), little is known about the timing of integrative surround modulation. We asked how quickly features outside the CRF influenced neuronal directional selectivity relative to when those features were within the CRF. Figure 5 shows the normalized and averaged PSTHs of 41 neurons tested with corner, contour, and dot stimuli. Preferred (orange traces) and less-preferred (gray traces) directions were defined based on corner responses. For contour and dot stimuli, these two directions of motion yielded identical motions within the CRF and were only distinguished by motion in the surround. For these stimuli, the point at which the traces diverge reflects the onset of directionally selective surround modulation. Consistent with previous findings (Osborne et al., 2004), directional selectivity for motion within the CRF (i.e. for corner stimuli) emerges at response onset (Figure 5A). Integrative modulation (Figure 5B) and antagonistic modulation (Figure 5C), however, both emerge about 40 ms after response onset. Thus both types of surround modulation are delayed relative to the emergence of directional selectivity for 2D features within the CRF. These time delays are consistent with the involvement of horizontal connections within area MT and/or feedback connections from higher-order areas.
Figure 5.
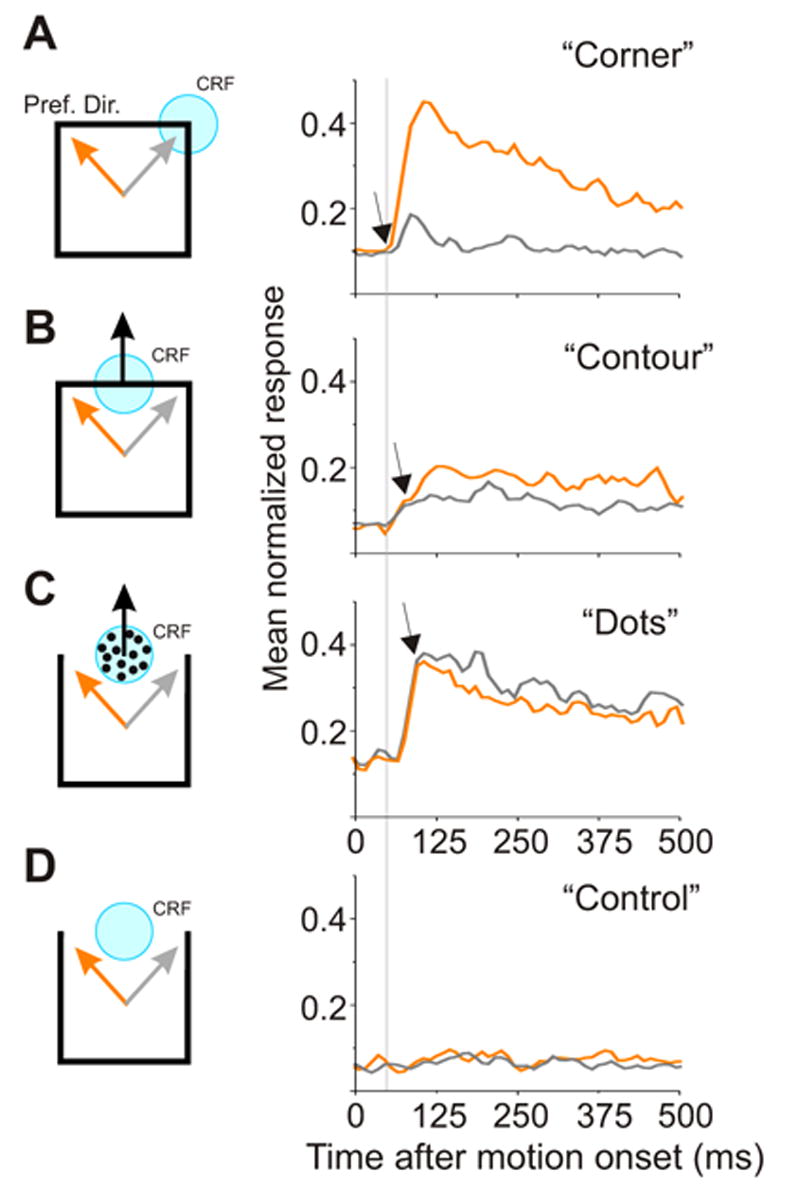
Time course of direction selectivity for CRF stimuli and surround modulation in area MT. Normalized and averaged PSTHs of the 41 neurons in response to corner (A), contour (B), dot (C) and control stimuli (D). Preferred (orange traces) and less-preferred (gray traces) directions were defined based on responses to corners within the CRF (A). For contour and dot stimuli, these two directions were distinguished only by the motion in the surround. Arrows indicate where these traces diverge and hence when directional selectivity begins. To facilitate comparison, the point of divergence for corner responses is indicated by the dotted line in all 4 plots. Both integrative (B) and antagonistic (C) surround modulations were delayed relative to the emergence of the directional selectivity to the corner stimuli (A). No significant responses were evoked in the control condition (D).
Response magnitude and surround modulation
On average, neuronal responses to dot stimuli were about twice as large as to contour stimuli. This trend can be seen in the population averages in Figure 5 and is pronounced in the example data shown in Figure 3. For the population averages, the "maximum responses" (i.e. the largest trial-averaged response to any of the four global directions) were 56.3 and 30.5 spikes/sec for dot and contour stimuli respectively. This firing rate difference suggests that integration might yield to antagonism whenever firing rate increases. To test this hypothesis, we examined the 14 (out of 41) neurons whose "maximum response" to dot stimuli was not significantly greater than that to contour stimuli (Wilcoxon singed rank test, P >= 0.05). Across these 14 neurons, the mean "maximum response" rate was 23.7 and 36.3 spikes/sec for dot and contour stimuli respectively. For these neurons, the mean CMI for contour stimuli was 0.42 and was significantly greater than zero (Wilcoxon signed rank test, P < 0.0001), whereas the mean CMI for dot stimuli was −0.20 and was significantly less than zero (Wilcoxon signed rank test, P = 0.03). These values mirror those from the larger population of 41 neurons. Therefore, while response magnitude and type of surround modulation may be mechanistically related, one cannot reliably predict whether an individual neuron will exhibit integrative or antagonistic modulation based on its firing rate.
Discussion
We have found that individual area MT neurons can exhibit either directional integration or directional antagonism depending upon the stimulus. This result demonstrates that the direction selectivity of surround modulation in area MT is not fixed and hence that surround modulation does not subserve a single function such as segmentation. In this discussion, we briefly consider the implications of this work with regard to previous findings and neuronal mechanisms.
Possible underlying mechanisms
Our definition of surround modulation follows from previous investigations of surround modulation (e.g. see Allman et al., 1985a; Bair et al., 2003): the ability of a stimulus that elicits no response by itself to modulate responses when presented in conjunction with another stimulus. Although our control stimuli did not elicit changes in neuronal firing rate, they may have evoked sub-threshold activation. It might be proposed therefore that the integrative modulation seen for contour stimuli could be explained by merely assuming that this activation exceeded threshold when occurring in tandem with stimulation of the CRF. We found, however, that the same region of the surround can exert either an integrative or antagonistic influence. Sub-threshold summation, by itself, cannot account for this change in the type of modulation.
The source of the inputs driving integrative and antagonistic modulation is not yet clear and may involve horizontal connections within area MT and/or feedback connections from higher-order areas such as medial superior temporal (MST) or ventral intraparietal (VIP) areas. The mechanisms that underlie the observed stimulus-specific switch in the directional modulation also remain to be determined but may reflect a shift in the relative weights of integrative and antagonistic inputs. Rust et al. (2006) recently advanced an innovative model to account for MT neurons’ selectivity to complex motion patterns independent of the orientation of the patterns’ components. This model provides important insight into the role that feedforward connections from area V1 might play in integrating the motions of features within the CRFs of area MT neurons. Integrative and antagonistic surround modulation in area MT, however, likely involves additional neural circuitry within area MT and/or feedback connections. While determining the precise underlying neuronal mechanisms is an important goal of future research, understanding the function of surround modulation rests more on identification of the stimulus factors that elicit the two types of modulation. We consider these factors next.
Motion uncertainty and integration
Psychophysical experiments suggest that the uncertainty of a motion measurement plays an important role in determining the spatial scale over which motions are integrated rather than segmented. In particular, decreasing luminance contrast (Murakami and Shimojo, 1993) and adding motion noise (Hanada, 2004), both of which affect signal-to-noise ratio, produce an expansion of the range over which motions are perceptually integrated rather than segmented. This expansion may serve to achieve sensitivity whenever the information provided by local motion signals is weak or ambiguous. The aperture problem offers a geometric source of motion uncertainty and one interpretation of the directional integration observed in our study is that it reflects expansion of the spatial scale of motion integration in response to the ambiguity present in the CRF. If so we might expect other sources of motion uncertainty such as low luminance contrast to influence direction-selective surround modulation.
A recent study by Pack and colleagues is broadly consistent with a role for uncertainty within the CRF in surround modulation (Pack et al., 2005). It was found that decreasing the luminance contrast of a field of moving dots resulted in an expansion of the region of spatial summation. In that study, however, the directional selectivity of the surround was not investigated. As non-directional changes in spatial summation as a function of luminance contrast have been found in area V1 (Levitt and Lund, 1997; Polat et al., 1998; Sceniak et al., 1999; Cavanaugh et al., 2002), Pack and colleagues’ result may reflect that type of non-directional effect. Determining whether luminance contrast affects the directional tuning of surround modulation requires that both the luminance and the direction of CRF and surround stimulus features be independently manipulated and awaits future experimentation.
Is motion integration object-specific?
To achieve a veridical representation of visual motion, only those motions that arise from the same object should be integrated. We might expect therefore that a switch from directional antagonism to directional integration within area MT should be contingent upon whether CRF and surround features are part of the same perceptual object.
Several previous studies have suggested object-specific motion interactions within area MT. For example, it was found that transparency cues that govern perceptual motion integration (Stoner et al., 1990) have parallel neuronal effects when moving features lie within the CRF of area MT neurons (Stoner and Albright, 1992; Thiele and Stoner, 2003). Duncan et al. (2000) found that some MT neurons distinguish between 2D features in the surround that are “intrinsic” or “extrinsic” to the 1-D features within the CRF and thereby achieved a representation consistent with perceptual experience. In that study, however, unlike the current study, the direction of features in the surround was not varied and hence the directionality of the observed surround modulation could not be characterized as being integrative or antagonistic.
Our current study showed that when the CRF stimulus provided ambiguous motion information and was part of the same object as the surround stimulus, directional integration dominates. This directional integration allowed the veridical motion of the moving object to be recovered, at least in part. Further studies are needed to resolve the relative importance of CRF ambiguity and object segmentation cues in determining the type and magnitude of surround modulation within area MT.
Reconciling segmentation and integration
Our results suggest that previous characterizations of area MT surrounds as primarily antagonistic reflect, not an intrinsic property of MT neurons, but rather the type of stimuli used in those studies. In the current study, we used two types of stimuli and each presented the visual system with a different computational problem. Using contour stimuli, for which directional integration provided the function of overcoming the aperture problem, we found that surround modulation was mostly integrative.
Conversely, our dot stimuli, like stimuli used in previous studies of MT surround modulation, offered unambiguous motion in both CRF and surround. Under these circumstances, we too found that surround modulation was predominately antagonistic. As suggested by previous investigators, directional antagonism amplifies directional differences and thereby presumably contributes to motion-based image segmentation (Allman et al, 1985a; Nakayama and Loomis, 1974). Our results suggest that the opposing functions of motion integration and motion segmentation (Braddick, 1993) are implemented, not within distinct neuronal populations, but by neurons that are sensitive to the particular computational challenge with which they are faced.
The complementary functions of integration and segmentation extend to visual properties besides motion, including brightness (Helson, 1963; Heinemann, 1955), and depth (Westheimer, 1986). Adaptive switching between surround integration and antagonism may be a general solution applicable to these other visual attributes. For example, neurons in area MT are tuned to binocular disparity (Maunsell and Van Essen, 1983b; DeAngelis et al., 1998; DeAngelis and Newsome, 1999) and are reported to have mostly antagonistic surrounds for disparity (Bradley and Andersen, 1998). Given that depth from disparity suffers from its own version of the aperture problem (Morgan and Castet, 1997), we speculate that surround integration would be dominant if the visual stimulus was such that integration would serve to disambiguate disparity information within the CRF.
Experimental Procedures
General
Experimental protocols were in accordance with guidelines set by US Department of Agriculture and National Institutes of Health for the care and use of laboratory animals. We recorded from a total of 267 neurons or small clusters of neurons in area MT in three fixating rhesus monkeys (Macaca mulatta). Contour stimulus data was collected from all three monkeys and dot stimulus data was collected from two. The results from the different monkeys were not significantly different (see Supplementary Material S3).
Our neurophysiological methods have been described in more detail previously (Krekelberg and Albright, 2005). We identified area MT by its characteristically large proportion of directionally selective cells, small RFs relative to those of neighboring area MST, and its location on the posterior bank of the superior temporal sulcus. Recording depths agreed well with the expected anatomical location of MT that was determined from structural magnetic resonance scans. Data from 97 units (77 single-units, 20 multi-units) that did not show significant responses to the “control” conditions are reported here. Single units were well-isolated neurons whose spike waveforms were, based on the raw waveforms and the PCA analysis of the Plexon spike sorter (Plexon Inc. Dallas TX), clearly clustered and distinct from the baseline noise and other clusters of spikes. Action potentials that crossed a magnitude threshold and had stable waveforms but did not meet the criteria of a single-unit were characterized as multi-unit. The directional selectivity of each unit was characterized using square-wave gratings drifting in one of eight directions. The gratings were viewed through an invisible circular aperture with a diameter of 6º.
These 97 units were highly directional selective: the mean directional selectivity index (DSI, equal to 1 minus the ratio of the responses to null and preferred directions after subtraction of baseline firing rate) was 0.90 and the standard deviation was 0.20. Forty-one of these 97 units (31 single-units, 10 multi-units) were tested with both contour and dot stimuli. Results obtained from single- and multi-units were not significantly different (see Supplementary Material S4).
CRFs were mapped by recording the responses to square-wave gratings (5ºx5º), which drifted in the preferred direction of each recording site for 500 ms. Gratings were positioned at different spatial locations tiling a rectangular region (usually 25ºx20º, sometimes 40ºx30º) of the display. CRF size was calculated as the square root of the total area of all of the gratings that gave responses that were significantly larger than the baseline firing rate (adapted from Gattass et al. 1988). The mean CRF size was 8.6º ± 2.8º (std) (see Supplementary Material S5). Our measure overestimated CRF size because the minimum estimated CRF size was constrained by the size of the mapping gratings (5ºx5º) and only a small portion of a grating need stimulate the neuron for the whole area of the gratings to be counted as part of the CRF. The raw CRF map was interpolated with the Matlab (MathWorks) function “interp2” at an interval of 0.5º, using “bicubic” interpolation. The location in the interpolated map giving rise to the highest firing rate was taken as the CRF center over which stimuli (contour, corner, control, and dots) were then centered as illustrated in Figures 1 and 3. The mean eccentricity of the 97 units was 5.5º ± 3.4º (std).
We found no significant correlation between the CMI and any of the other neuronal parameters we measured (i.e. CRF size, CRF eccentricity, and directional selectivity; see Supplementary Material S6).
Visual Stimuli
Visual stimuli were presented on a 21” CRT monitor at a viewing distance of 57 cm. The resolution of the monitor was 1024x768 pixels and the refresh rate was 75 Hz. The main visual stimuli were outlined squares moving in four oblique (global) directions at 5º/sec. The global directions were 45, 135, 225 and 315º, with 0º defined as rightward. The luminance of the square outline was 13.6 cd/m2 and the background was 0.67 cd/m2. The square was 20º across and the contour width was 0.5º. The square was stationary for 500 ms and then moved for another 500 ms. For contour conditions, after establishing each neuron’s directional selectivity, either a horizontal or vertical contour of the square was centered within the CRF based on which yielded a larger difference between the Local and Global Predictions. Although the local motions were either vertical or horizontal, the global motions of the square were the same for all neurons. The beginning position of the contour was also the same for all four directions of global motion. Similarly, for “corner” conditions, one corner of the square was centered on the CRF and the square moved in one of the four global directions. The “control” conditions were identical to the contour conditions except that the contour passing through the CRF was erased. The control stimulus did not include the two small segments of the “CRF contour” that extended beyond the CRF. The motion information provided by these segments was redundant with that offered within the CRF. They could not therefore have provided the global motion information that produced the directional integration observed for contour stimuli. Retaining these segments would, moreover, have introduced 2-D features (i.e. the “terminators” of the two segments) in the control stimulus at locations that did not offer 2-D features in the contour stimulus.
Trials of corner, contour, and control conditions were randomly interleaved. Illustrations of the contour stimulus’ path relative to the raw CRF map (see above) are shown in the Supplementary Materials S7. For dot stimuli, the contour passing through the CRF was replaced with random dots viewed through an invisible circular aperture. The aperture was static and had a diameter of 4º, which corresponded to the total length of the contour’s path (including the width of the contour) for both directions of motion. The dots were of the same luminance as the contour and had the same velocity as the local motion of that contour. Applying the standard deviation contrast metric for non-periodic stimuli (Moulden et al. 1990) to our dot stimuli yields a contrast of 14.7 cd/m2. Dot density was ~3 dots per square degree. The diameter of each dot was ~0.2°. The median number of trials was 10 (range: 10 to 20).
Eye Position Monitoring
In initial experiments with one monkey, eye position was monitored at 1 kHz using the search coil method. In later experiments, eye position was measured at 60 Hz using infrared video (ISCAN) with a spatial resolution of 0.2~0.3º. Monkeys were required to maintain fixation within a 2x2º window during the experiment trial. Actual fixation was typically much more accurate than this window size. To determine whether eye position was sensitive to surround motion, we analyzed eye position recordings from the two monkeys that were shown both the square and the dot stimuli. These recordings constituted a total of 2320 trials. For the 500 ms period after motion onset, we compared the eye positions of each monkey for those pairs of conditions that differed only in the motion of the surround stimulus (such as indicated by the gray and orange arrows in Figures 5B and 5C). We examined the 31 individual sampling points of this period and found no significant difference in either vertical or horizontal eye positions at any point in time (Kolmogorov-Smirnov test, P > 0.05). As we did not impose a Bonferroni correction for these multiple comparisons, this was a strict test. Averaged across the full 500 ms period, eye position differences between compared conditions ranged from 0.01~0.05º. We conclude that variation in eye position was unlikely to have played a role in our results.
Data Analysis
Screening criteria
We applied two criteria to test if control stimuli were outside the CRF. First, the “response” (i.e. the neuronal activity 0–500 ms after motion onset) to control stimuli moving in any of the four global directions could not be significantly greater than the baseline activity (measured in the 200 ms prior to stimulus onset) of the corresponding condition (Wilcoxon signed rank test, P>0.05). Second, we compared the “responses” to the control stimuli that corresponded to the contour stimuli with the same local motions within the CRF. There were two such comparisons. To illustrate, for the example in Figure 1E, the activity seen in the upper-left PSTH was compared with that seen in upper-right PSTH, and the activity seen in the lower-left PSTH was compared with that seen in the lower-right PSTH. All neurons with a significant difference (Wilcoxon signed rank test, P<0.05) in either of these two types of comparisons were excluded. Because we wished to exclude all neurons for which the control stimuli intruded into the CRF, Bonferroni correction for multiple comparisons was not imposed on these criteria. As a result, our criteria for detecting responses to control stimuli were much stricter than the criterion of each individual test.
Contextual Modulation Index (CMI) was defined as the following:
ϕ is the angular difference between the Contour Directional Preference and the Local Prediction (see Figure 2AB). θ is the angular difference between the Global Prediction and the Local Prediction (θ is less or equal to 180º). Neurons that exhibited a small difference between Local and Global Predictions (i.e. θ less than 15º) were not included in our analyses. Neurons in which the absolute value of ϕ was greater than the absolute value of 2θ were also excluded from further analysis.
The CMI was based on responses during the 100 to 500 ms period after motion onset (i.e. 600 to 1000 ms after the stimulus onset) to discount response latency and the early response transient. Similar results were found when response magnitudes were computed over the entire 500 ms period of stimulus motion. For the analyses presented in this manuscript, the Global Prediction was based on corner responses. To determine whether our results were dependent upon using corner responses to generate this prediction, we also constructed Global Prediction based on responses to drifting gratings moving in the four “global” directions. We found the same pattern of results (see Supplementary Material S8).
Averaged and normalized PSTHs
For Figure 5A, B, and C, the raw PSTH (using 10 ms bins) was normalized to the maximum response across the “corner”, “contour” and “dot” conditions for each neuron. The normalized responses were then averaged across the 41 neurons and smoothed with a Savitzky-Golay (SG) filter with a 2nd degree underlying polynomial and a window size of 5 bins.
Response latency
To characterize the time course of surround modulation, we computed the response onset, direction selectivity onset, and modulation latencies of the population responses of the 41 neurons tested with both square and dot stimuli. These latencies were determined with a method adapted from previous study (Maunsell and Gibson, 1992). First, the normalized and averaged PSTHs were smoothed with a SG filter (see above). We used the 200 ms period prior to motion onset to estimate the mean and the standard deviation of the baseline firing rate. We established latency by looking for the first three successive bins that exceeded the baseline rate by one, one and a half and two standard deviations respectively. Latency was taken to be the middle time point of the first bin. We chose three increment values in order to detect the initial rising phase of the response. To determine when responses to different stimuli diverged, we first subtracted the PSTH with a smaller magnitude from the larger one and then imposed the criterion described to the response difference. The latencies based on these criteria agreed with those determined by visual inspection.
Supplementary Material
Acknowledgments
We thank L. Abavare, J. Costanza, D. Diep, D. Woods, S. Barry and T. Nguyen for superb technical assistance. We also thank G. Horwitz, G. Blanc, B. Krekelberg, J. Reynolds, A. Schlack, F. Klam, and X. Hu for discussions on this work and comments on the manuscript.
Footnotes
Although “surround antagonism” and “surround suppression” are sometimes referred to interchangeably, a critical distinction exists between these two properties as used here. Suppression refers to a decrease in neuronal response due to visual stimulation of the surround. Antagonism, on the other hand, indicates that the directional tuning of surround modulation is opposite to that of the CRF (see main text). These two properties have no necessary relationship: Antagonistic modulation could be suppressive or facilitatory, and suppressive modulation could be antagonistic or integrative. To clarify our meaning, we refer to directional antagonism and directional integration.
Publisher's Disclaimer: This is a PDF file of an unedited manuscript that has been accepted for publication. As a service to our customers we are providing this early version of the manuscript. The manuscript will undergo copyediting, typesetting, and review of the resulting proof before it is published in its final citable form. Please note that during the production process errors may be discovered which could affect the content, and all legal disclaimers that apply to the journal pertain.
References
- Adelson EH, Movshon JA. Phenomenal coherence of moving visual patterns. Nature. 1982;300:523–525. doi: 10.1038/300523a0. [DOI] [PubMed] [Google Scholar]
- Albright TD. Direction and orientation selectivity of neurons in visual area MT of the macaque. J Neurophysiol. 1984;52:1106–1130. doi: 10.1152/jn.1984.52.6.1106. [DOI] [PubMed] [Google Scholar]
- Albright TD, Stoner GR. Contextual influences on visual processing. Annu Rev Neurosci. 2002;25:339–379. doi: 10.1146/annurev.neuro.25.112701.142900. [DOI] [PubMed] [Google Scholar]
- Allman J, Miezin F, McGuinness E. Stimulus specific responses from beyond the classical receptive field: neurophysiological mechanisms for local-global comparisons in visual neurons. Annu Rev Neurosci. 1985a;8:407–430. doi: 10.1146/annurev.ne.08.030185.002203. [DOI] [PubMed] [Google Scholar]
- Allman J, Miezin F, McGuinness E. Direction- and velocity-specific responses from beyond the classical receptive field in the middle temporal visual area (MT) Perception. 1985b;14:105–126. doi: 10.1068/p140105. [DOI] [PubMed] [Google Scholar]
- Bair W, Cavanaugh JR, Movshon JA. Time course and time-distance relationships for surround suppression in macaque V1 neurons. J Neurosci. 2003;23:7690–7701. doi: 10.1523/JNEUROSCI.23-20-07690.2003. [DOI] [PMC free article] [PubMed] [Google Scholar]
- Baker JF, Petersen SE, Newsome WT, Allman JM. Visual response properties of neurons in four extrastriate visual areas of the owl monkey (Aotus trivirgatus): a quantitative comparison of medial, dorsomedial, dorsolateral, and middle temporal areas. J Neurophysiol. 1981;45:397–416. doi: 10.1152/jn.1981.45.3.397. [DOI] [PubMed] [Google Scholar]
- Berezovskii VK, Born RT. Specificity of projections from wide-field and local motion-processing regions within the middle temporal visual area of the owl monkey. J Neurosci. 2000;20:1157–1169. doi: 10.1523/JNEUROSCI.20-03-01157.2000. [DOI] [PMC free article] [PubMed] [Google Scholar]
- Born RT. Center-surround interactions in the middle temporal visual area of the owl monkey. J Neurophysiol. 2000;84:2658–2669. doi: 10.1152/jn.2000.84.5.2658. [DOI] [PubMed] [Google Scholar]
- Born RT, Bradley DC. Structure and function of visual area MT. Annu Rev Neurosci. 2005;28:157–189. doi: 10.1146/annurev.neuro.26.041002.131052. [DOI] [PubMed] [Google Scholar]
- Born RT, Tootell RB. Segregation of global and local motion processing in primate middle temporal visual area. Nature. 1992;357:497–499. doi: 10.1038/357497a0. [DOI] [PubMed] [Google Scholar]
- Braddick O. Segmentation versus integration in visual motion processing. Trends Neurosci. 1993;16:263–268. doi: 10.1016/0166-2236(93)90179-p. [DOI] [PubMed] [Google Scholar]
- Bradley DC, Andersen RA. Center-surround antagonism based on disparity in primate area MT. J Neurosci. 1998;18:7552–7565. doi: 10.1523/JNEUROSCI.18-18-07552.1998. [DOI] [PMC free article] [PubMed] [Google Scholar]
- Britten KH, Shadlen MN, Newsome WT, Movshon JA. The analysis of visual motion: a comparison of neuronal and psychophysical performance. J Neurosci. 1992;12:4745–4765. doi: 10.1523/JNEUROSCI.12-12-04745.1992. [DOI] [PMC free article] [PubMed] [Google Scholar]
- Cavanaugh JR, Bair W, Movshon JA. Nature and interaction of signals from the receptive field center and surround in macaque V1 neurons. J Neurophysiol. 2002;88:2530–2546. doi: 10.1152/jn.00692.2001. [DOI] [PubMed] [Google Scholar]
- DeAngelis GC, Cumming BG, Newsome WT. Cortical area MT and the perception of stereoscopic depth. Nature. 1998;394:677–680. doi: 10.1038/29299. [DOI] [PubMed] [Google Scholar]
- DeAngelis GC, Newsome WT. Organization of disparity-selective neurons in macaque area MT. J Neurosci. 1999;19:1398–1415. doi: 10.1523/JNEUROSCI.19-04-01398.1999. [DOI] [PMC free article] [PubMed] [Google Scholar]
- Dubner R, Zeki SM. Response properties and receptive fields of cells in an anatomically defined region of the superior temporal sulcus in the monkey. Brain Res. 1971;35:528–532. doi: 10.1016/0006-8993(71)90494-x. [DOI] [PubMed] [Google Scholar]
- Duncan RO, Albright TD, Stoner GR. Occlusion and the interpretation of visual motion: perceptual and neuronal effects of context. J Neurosci. 2000;20:5885–5897. doi: 10.1523/JNEUROSCI.20-15-05885.2000. [DOI] [PMC free article] [PubMed] [Google Scholar]
- Hanada M. Effects of the noise level on induced motion. Vision Res. 2004;44:1757–1763. doi: 10.1016/j.visres.2004.03.001. [DOI] [PubMed] [Google Scholar]
- Gattass R, Sousa AP, Gross CG. Visuotopic organization and extent of V3 and V4 of the macaque. J Neurosci. 1988;8:1831–1845. doi: 10.1523/JNEUROSCI.08-06-01831.1988. [DOI] [PMC free article] [PubMed] [Google Scholar]
- Heinemann EG. Simultaneous brightness induction as a function of inducing and test-field luminances. J Exp Psychol. 1955;50:89–96. doi: 10.1037/h0040919. [DOI] [PubMed] [Google Scholar]
- Helson H. Studies of anomalous contrast and assimilation. J Opt Soc Am. 1963;53:179–184. doi: 10.1364/josa.53.000179. [DOI] [PubMed] [Google Scholar]
- Krekelberg B, Albright TD. Motion mechanisms in macaque MT. J Neurophysiol. 2005;93:2908–2921. doi: 10.1152/jn.00473.2004. [DOI] [PubMed] [Google Scholar]
- Levitt JB, Lund JS. Contrast dependence of contextual effects in primate visual cortex. Nature. 1997;387:73–76. doi: 10.1038/387073a0. [DOI] [PubMed] [Google Scholar]
- Marr D, Ullman S. Directional selectivity and its use in early visual processing. Proc R Soc Lond B Biol Sci. 1981;211:151–180. doi: 10.1098/rspb.1981.0001. [DOI] [PubMed] [Google Scholar]
- Maunsell JH, Gibson JR. Visual response latencies in striate cortex of the macaque monkey. J Neurophysiol. 1992;68:1332–1344. doi: 10.1152/jn.1992.68.4.1332. [DOI] [PubMed] [Google Scholar]
- Maunsell JH, Van Essen DC. Functional properties of neurons in middle temporal visual area of the macaque monkey. I. Selectivity for stimulus direction, speed, and orientation. J Neurophysiol. 1983a;49:1127–1147. doi: 10.1152/jn.1983.49.5.1127. [DOI] [PubMed] [Google Scholar]
- Maunsell JH, Van Essen DC. Functional properties of neurons in middle temporal visual area of the macaque monkey. II. Binocular interactions and sensitivity to binocular disparity. J Neurophysiol. 1983b;49:1148–1167. doi: 10.1152/jn.1983.49.5.1148. [DOI] [PubMed] [Google Scholar]
- Morgan MJ, Castet E. The aperture problem in stereopsis. Vision Res. 1997;37:2737–2744. doi: 10.1016/s0042-6989(97)00074-6. [DOI] [PubMed] [Google Scholar]
- Moulden B, Kingdom F, Gatley LF. The standard deviation of luminance as a metric for contrast in random-dot images. Perception. 1990;19:79–101. doi: 10.1068/p190079. [DOI] [PubMed] [Google Scholar]
- Murakami I, Shimojo S. Motion capture changes to induced motion at higher luminance contrasts, smaller eccentricities, and larger inducer sizes. Vision Res. 1993;33:2091–2107. doi: 10.1016/0042-6989(93)90008-k. [DOI] [PubMed] [Google Scholar]
- Nakayama K, Loomis JM. Optical velocity patterns, velocity-sensitive neurons, and space perception: a hypothesis. Perception. 1974;3:63–80. doi: 10.1068/p030063. [DOI] [PubMed] [Google Scholar]
- Osborne LC, Bialek W, Lisberger SG. Time course of information about motion direction in visual area MT of macaque monkeys. J Neurosci. 2004;24:3210–3222. doi: 10.1523/JNEUROSCI.5305-03.2004. [DOI] [PMC free article] [PubMed] [Google Scholar]
- Pack CC, Gartland AJ, Born RT. Integration of Contour and Terminator Signals in Visual Area MT of Alert Macaque. J Neurosci. 2004;24:3268–3280. doi: 10.1523/JNEUROSCI.4387-03.2004. [DOI] [PMC free article] [PubMed] [Google Scholar]
- Pack CC, Hunter JN, Born RT. Contrast dependence of suppressive influences in cortical area MT of alert macaque. J Neurophysiol. 2005;93:1809–1815. doi: 10.1152/jn.00629.2004. [DOI] [PubMed] [Google Scholar]
- Perge JA, Borghuis BG, Bours RJ, Lankheet MJ, van Wezel RJ. Dynamics of directional selectivity in MT receptive field centre and surround. Eur J Neurosci. 2005;22:2049–2058. doi: 10.1111/j.1460-9568.2005.04363.x. [DOI] [PubMed] [Google Scholar]
- Polat U, Mizobe K, Pettet MW, Kasamatsu T, Norcia AM. Collinear stimuli regulate visual responses depending on cell's contrast threshold. Nature. 1998;391:580–584. doi: 10.1038/35372. [DOI] [PubMed] [Google Scholar]
- Raiguel S, Van Hulle MM, Xiao DK, Marcar VL, Orban GA. Shape and spatial distribution of receptive fields and antagonistic motion surrounds in the middle temporal area (V5) of the macaque. Eur J Neurosci. 1995;7:2064–2082. doi: 10.1111/j.1460-9568.1995.tb00629.x. [DOI] [PubMed] [Google Scholar]
- Rust NC, Mante V, Simoncelli EP, Movshon JA. How MT cells analyze the motion of visual patterns. Nat Neurosci. 2006;9:1421–1431. doi: 10.1038/nn1786. [DOI] [PubMed] [Google Scholar]
- Sceniak MP, Ringach DL, Hawken MJ, Shapley R. Contrast's effect on spatial summation by macaque V1 neurons. Nat Neurosci. 1999;2:733–739. doi: 10.1038/11197. [DOI] [PubMed] [Google Scholar]
- Stoner GR, Albright TD. Neural correlates of perceptual motion coherence. Nature. 1992;358:412–414. doi: 10.1038/358412a0. [DOI] [PubMed] [Google Scholar]
- Stoner GR, Albright TD, Ramachandran VS. Transparency and coherence in human motion perception. Nature. 1990;344:153–155. doi: 10.1038/344153a0. [DOI] [PubMed] [Google Scholar]
- Tanaka K, Hikosaka K, Saito H, Yukie M, Fukada Y, Iwai E. Analysis of local and wide-field movements in the superior temporal visual areas of the macaque monkey. J Neurosci. 1986;6:134–144. doi: 10.1523/JNEUROSCI.06-01-00134.1986. [DOI] [PMC free article] [PubMed] [Google Scholar]
- Thiele A, Stoner G. Neuronal synchrony does not correlate with motion coherence in cortical area MT. Nature. 2003;421:366–370. doi: 10.1038/nature01285. [DOI] [PubMed] [Google Scholar]
- Wallach H. Ueber visuell whargenommene bewegungrichtung. Psychol Forsch. 1935;20:325–380. [Google Scholar]
- Westheimer G. Spatial interaction in the domain of disparity signals in human stereoscopic vision. J Physiol. 1986;370:619–629. doi: 10.1113/jphysiol.1986.sp015954. [DOI] [PMC free article] [PubMed] [Google Scholar]
- Wuerger S, Shapley R, Rubin N. On the visually perceived direction of motion by Hans Wallach: 60 years later. Perception. 1996;25:1317–1367. [Google Scholar]
- Xiao DK, Raiguel S, Marcar V, Koenderink J, Orban GA. Spatial heterogeneity of inhibitory surrounds in the middle temporal visual area. Proc Natl Acad Sci U S A. 1995;92:11303–11306. doi: 10.1073/pnas.92.24.11303. [DOI] [PMC free article] [PubMed] [Google Scholar]
- Xiao DK, Raiguel S, Marcar V, Orban GA. The spatial distribution of the antagonistic surround of MT/V5 neurons. Cereb Cortex. 1997;7:662–677. doi: 10.1093/cercor/7.7.662. [DOI] [PubMed] [Google Scholar]
- Zeki SM. Functional organization of a visual area in the posterior bank of the superior temporal sulcus of the rhesus monkey. J Physiol. 1974;236:549–573. doi: 10.1113/jphysiol.1974.sp010452. [DOI] [PMC free article] [PubMed] [Google Scholar]
Associated Data
This section collects any data citations, data availability statements, or supplementary materials included in this article.