Abstract
Methylenedianiline (DAPM) is considered a cholangiodestructive toxicant in vivo. Increases in biliary inorganic phosphate (Pi) and glucose occur prior to biliary epithelial cell (BEC) injury, which could be due to increased paracellular permeability and/or impairment of Pi and glucose uptake by BEC. To evaluate these possibilities, we induced mild injury [loss of BEC from major bile ducts (6 h), ultrastructural alterations in BEC mitochondria and Golgi cisternae (3 h), and striking increases in biliary Pi and glucose (3–6 h)] with 25 mg DAPM/kg and then assessed temporal alterations in tight junction (TJ) permeability by measuring bile to plasma (B:P) ratios of [3H]-inulin. Parameters maintained by hepatocytes in bile were unchanged (bile flow, bile acids, bilirubin) or only transiently perturbed (protein, glutathione). Minimal elevations in B:P ratios of inulin occurred temporally later (4 h) in DAPM-treated rats than increases in biliary Pi and glucose. To confirm a direct effect of DAPM on BEC TJs, we measured transepithelial resistance (TER) and bi-ionic potentials of BEC monolayers prior to and after exposure to pooled (4 to 6) bile samples collected from untreated rats (Basal Bile) or rats treated with 50 mg DAPM/ kg (DAPM-Bile). BEC TJs were found to be cation selective. Exposure to DAPM-Bile for 1 h decreased TERs by ~35% and decreased charge selectivity of BEC TJs while exposure to Basal Bile had no effects. These observations indicate that DAPM-Bile impairs paracellular permeability of BEC in vitro. Further, our in vivo model suggests that increases in paracellular permeability induced by DAPM are localized to BEC because bile flow and constituents excreted by hepatocytes were unchanged; BEC damage was temporally correlated with increases in biliary Pi and glucose; and elevations in B:P ratios of inulin were delayed and minimal.
Keywords: methylenedianiline, biliary epithelial cells, tight junctions, inulin, paracellular permeability
Introduction
Methylenedianiline (DAPM, 4,4’-diaminodiphenylmethane) is an aromatic amine used in the production of polyamides, epoxy resins and in the synthesis of MDI (4,4’-methylenediphenyl diisocyanate), a major component of polyurethanes. These polymers are used in the manufacture of insulation materials, automotive and aircraft parts as well as medical devices such as dialysis tubing, catheters, intra-aortic balloons, and surgical implants (Do Luu and Hutter, 2000; Moore, 1978). Occupational or accidental exposure to DAPM causes injury to cholangiocytes with subsequent cholestasis, cholangitis, jaundice, elevated serum liver enzymes, fever, chills, and malaise (Kopelman et al., 1966; Tillmann et al., 1997; Bastien, 1984).
Studies in rats have shown that moderate doses of DAPM (100–250 mg/kg) induce a dose- and time-dependent cholestasis, rapid and severe injury to biliary epithelial cells (BEC) and moderate hepatotoxicity (Kanz et al., 1992; Bailie et al., 1993). Minimally toxic doses (50 mg/kg) induce prominent increases in biliary inorganic phosphate (Pi) and glucose but have only minor effects on hepatocellular constituents such as bilirubin and bile acids in serum and bile (Kanz et al., 1998; Dugas et al., 2001). The mechanism(s) by which DAPM causes BEC injury and alterations in biliary constituents is unknown; however, elevations in biliary Pi are typically regarded as an indicator of tight junction (TJ) leakage. A number of cholestasis-inducing toxicants such as α-naphthylisothiocyanate (Krell et al., 1982), and estradiol valerate (Jaeschke et al., 1987b) elevate biliary Pi levels. Similarly, glucose is believed to enter bile via TJs (Handler et al., 1994) but to be maintained at low levels in bile by Na+-dependent glucose transporters on BEC which take up glucose (Lira et al., 1992; Lazaridis et al., 1997). Because biliary Pi is also maintained at very low levels, active Pi uptake from bile has been proposed. This theory is supported by sodium-dependent Pi uptake by canalicular plasma membrane vesicles, and Western blot and immunofluorescence studies demonstrating the presence of the sodium-phosphate cotransporter, NaPi-IIb, on canalicular membranes of hepatocytes and brush border membranes of cholangiocytes (Frei et al., 2004). Thus, the early elevations in both biliary glucose and Pi could be due to several DAPM-induced impairments: TJ “leakiness” between hepatocytes or BEC, an inability of BEC to take up biliary glucose, and/or an inability of BEC to take up Pi.
In order to test these hypotheses, we developed a DAPM model in which BEC injury occurred without evident injury to hepatocytes. The threshold for DAPM toxicity in rats is reported to be between 25 and 75 mg/kg (Bailie et al., 1993). Thus, we chose 25 mg DAPM/kg as our model dose and assessed its temporal effects on bile flow, biliary constituents and BEC morphology. Furthermore, since bile salts and bilirubin are concentrated in bile via transporter-mediated routes through hepatocytes (Kamisako et al., 2000; Trauner and Boyer, 2002) while glucose is removed from bile via glucose transporters on BEC (Lira et al., 1992; Lazaridis et al., 1997), our working hypothesis was that, at a dose below the threshold of toxicity, effects would be observed on biliary glucose but not on bile salts or bilirubin.
After characterization of the above model, our objective was to temporally assess TJ permeability following DAPM treatment by measuring the bile to plasma ratios of [3H]-inulin. Non-metabolizable sugars such as inulin, erythritol and mannitol have been used as markers of water movement into bile or canalicular bile flow because these sugars equilibrate between blood and bile chiefly across TJs of the paracellular pathway (Forker, 1970; Handler et al., 1994). Appearance of inulin in bile occurs as early as 1 min after iv injection and reaches a steady-state excretion rate within 2 min (Lorenzini et al., 1986). Thus, our working hypothesis was that, if DAPM treatment induced alterations in TJ permeability, elevation of the bile to plasma (B:P) ratio of inulin would be temporally correlated with increases in biliary Pi.
Our second objective was to specifically examine the effects of DAPM on TJ permeability by measuring TJ alterations following exposure of BEC in monolayer culture to bile collected from DAPM-treated animals (Santa Cruz et al., 2005). Using this in vitro model, we have previously reported that bile collected during the first hour after DAPM administration [DAPM-Bile (1st Hr)] decreases transepithelial resistance (TER) of BEC monolayers and increases paracellular leakage of a non-metabolizable glucose analog within 2 h (Santa Cruz et al., 2005). The alterations in TER suggested that DAPM could also have an effect on the ionic permeability of BEC TJs. Therefore, we measured the bi-ionic potentials of BEC monolayers in response to changes in the ionic composition of the apical membrane solution (Barry, 1989) before and after exposure to DAPM-Bile.
Materials and Methods
Chemicals
DAPM was purchased from Aldrich Chemical Co. (Milwaukee, WI). [3H]-Inulin (>99% purity, specific activity 140 mCi/g) was obtained from American Radiolabeled Chemicals, Inc. (St. Louis, MO). Unless noted, all other chemicals were from Sigma (St. Louis, MO). DAPM is classified as a possible human carcinogen by the WHO International Agency for Research on Cancer (IARC, 1986); proper safety precautions instituted by the UTMB Office of Environmental Health and Safety were followed.
Animals
All experimental and animal care procedures were in compliance with the USDA Animal Welfare Act and the NIH Guide for the Care and Use of Laboratory Animals. Male Sprague Dawley rats (Harlan, Indianapolis, IN) were maintained in wire-floor cages in a 12 hr light/dark cycle, temperature- and humidity-controlled animal room for 1 week prior to experiments. Rats weighed 340–355 g in each experiment; control and DAPM-treated groups consisted of 4 rats and 6–7 rats, respectively.
Experimental Protocols
DAPM was dissolved in 100% ethanol and then diluted to 35% ethanol with warm distilled water. For the DAPM-injury and [3H]-inulin studies, rats were given 25 mg DAPM/kg or vehicle (35% ethanol) in a volume of 1 ml/kg. For collection of bile to use in the in vitro studies with BEC monolayers, rats were given 50 mg DAPM/kg in a volume of 2 ml/kg.
For DAPM-injury experiments, rats were anesthetized with pentobarbital (50 mg/ml, 1 ml/kg) and bile duct, duodenal and peritoneal cannulas were implanted by established procedures (Kanz et al., 1998). Body temperatures of anesthetized rats were maintained at ~37ºC by a homeothermic blanket unit (Harvard Bioscience, Natick, MA). Taurocholate (36.3 mM) was infused (2.9 ml/hr/kg rat) to sustain bile flow and anesthesia was maintained by infusion of pentobarbital (2.5 mg/ml, ~2.5 ml/hr) through the duodenal and peritoneal cannulas, respectively. Basal bile was collected for 1 h in tared microcentrifuge tubes on ice; then rats were gavaged with DAPM or vehicle and bile was collected for a further 6 h. Bile volumes were determined by weight; bile samples were aliquoted for biochemical analyses and stored at −20ºC. Liver sections from at least 2 lobes and sera were collected at the end of 6 h for histological and biochemical assessment of injury.
For [3H]-inulin studies, rats were anesthetized and cannulated as described above with the addition of jugular and femoral vein cannulas (Moslen et al., 1988a). During the equilibration period, rats were infused through the femoral cannula with a bolus dose of [3H]-inulin (~3.85 μCi/ml) at a rate of 10 μl/min. Then, during the basal (1 h) and experimental (4 h) periods, the [3H]-inulin infusion rate was reduced to 6.66 μl/min. Bile was collected in tared tubes on ice at 0 and 30 min of each hour. At 15 and 45 min of each hour, 200 μl of blood was withdrawn from the jugular cannula and replaced with 200 μl of heparinized saline to replenish plasma volumes. Blood was centrifuged immediately to obtain plasma which was stored at −20ºC prior to determination of [3H]-inulin concentration. Bile samples were aliquoted for biochemical analyses and [3H]-inulin assays and stored at −20ºC. Serum and liver sections from at least 2 lobes were collected at the end of the 4 h experimental period for biochemical and histological assessment of injury.
For in vitro studies, bile was collected hourly [Basal bile, DAPM-Bile (1st Hr), DAPM-Bile (2nd Hr)] from two rats cannulated on an individual day, pooled, aliquoted and stored at −80ºC. BEC monolayers were subsequently exposed to pooled aliquots of undiluted bile from 4 to 6 rats treated on different days (Santa Cruz et al., 2005). For electron microscopy studies, rats were anesthetized with pentobarbital 3 h after treatment with DAPM or vehicle. Livers were perfusion-fixed and sectioned as previously described (Kanz et al., 1998).
Measurements of Biliary Constituents
Total bilirubin and glucose were assayed using Sigma kits 550 and 20, respectively. Bile salts were measured by the method of Koss et al. 1974 with taurocholate as standard. Total protein was determined by the bicinchoninic acid method (Smith et al., 1985) with bovine serum albumin as standard. Inorganic phosphate (Pi) was measured by the sensitive malachite green method of Moslen et al. 1988b. Total glutathione was assayed by the enzymatic recycling method of Tietze (1969) with glutathione as standard.
Assessment of Hepatotoxicity and Histopathology
Serum levels of alanine aminotransferase (ALT), alkaline phosphatase (ALP), glucose and bilirubin were measured with Sigma kits 57, 10, 20 and 550, respectively. The method of Koss et al. 1974 was used to measure serum bile acids. For histopathology, the main bile ducts in major portal tracts (minimum of 15 per rat) were examined by light microscopy and injury was categorized as 1) none, 2) minor (pyknosis of individual epithelial cells and/or exfoliation of ~10% of BEC from the basement membrane), 3) moderate (exfoliation of 20–60% of BEC with minimal portal edema), and 4) moderate to severe (<70% exfoliation of BEC with extensive edema, fibrin exudation, and inflammatory infiltrate).
[3H]-Inulin Determinations
Aliquots of plasma and bile were placed in scintillation fluid and counted for radioactivity in a Beckman Tri-Carb 1900A liquid scintillation analyzer. B:P ratios of [3H]-inulin were calculated as μCi/ml of bile per kg rat divided by μCi/ml of plasma per kg rat.
Measurement of Bi-Ionic Potentials of BEC Monolayers
BEC were isolated and characterized as previously reported (Santa Cruz et al., 2005). BEC were cultured on collagen-coated 12 well cell culture inserts with a 0.4 μm pore size until confluent. Inserts were placed in an Endohm-12 culture chamber of an EVOM Epithelial Voltohmeter® (World Precision Instruments, Sarasota, FL). The Endohm-12 chamber was modified adjacent to the apical probe with a micro-perfusion line (PE-50) attached to vacuum (outflow line) and another line attached to perfusion syringes (bathing line) set ~63.5 cm in height for gravimetric flow (1.23 ml/min). Pilot studies determined that the apical bathing solution in this apparatus was completely changed within 1 min.
The polarity and magnitude of bi-ionic potentials generated in response to changes in the ionic composition of the apical membrane solution indicate TJ ion selectivity, and alterations in selectivity are assessed by measuring transepithelial voltage (Vt). The ionic composition of the apical membrane solution is changed by substituting two large and poorly permeable ions, tetramethylammonium chloride (TMA+, [(CH3)4N+Cl-]) and sodium gluconate (GA-, [C6(OH)5H6O2-Na+], for Na+ and Cl−, respectively. Resulting changes in Vt are measured over time. To initiate experiments, both the basolateral and apical surfaces of inserts were bathed with iso-osmotic NaCl (iso-NaCl) for 5 minutes at room temperature. Pre-treatment basal values were obtained by replacing the apical solution every 10–15 min in the following sequence: iso-NaCl, iso-TMA+, iso-NaCl, iso-GA−, iso-NaCl. Monolayers were then incubated with basal bile or DAPM-Bile (1st Hr or 2nd Hr) for 60 min. Post-treatment values were obtained by bathing the monolayers using the same pre-treatment sequence. Vt measurements were taken at 1 min intervals with the EVOM Epithelial Voltohmeter®. Iso-NaCl contained 140 mM NaCl, 5 mM KCl, 1.3 mM CaCl2·2H2O, 0.5 mM MgCl2·6H2O, 10 mM HEPES, 5 mM glucose, pH 7.4. For iso-TMA+, 126 mM TMA+Cl- was substituted for NaCl and the pH was brought to 7.4 with TMA+OH−. For iso-GA−, 132 mM Na+GA− was substituted for NaCl. Osmolarities of iso-NaCl, iso-TMA+, and iso-GA− were 278, 278, and 281, respectively. Measurements made using blank inserts were subtracted from those determined with cells. Vt was expressed in millivolts (mV) and was calculated using the following equation.
Statistics
Values in figures and tables are expressed as means ± SE. Data for serum and biliary constituents were analyzed by analysis of variance (ANOVA) and ANOVA with repeated measures, respectively, using ABSTAT (Anderson Bell, Boulder, CO), a statistical package for personal computers. If a significant difference between groups was found for biliary constituents, the means at individual time points were compared by Scheffe’s post hoc test. A p value of <0.05 was considered significant.
Results
Model of BEC Injury without Evident Hepatocyte Injury
Effects of DAPM on Liver Histology and Serum Indicators of Toxicity
DAPM injury with 25 mg/kg was localized to bile ducts of major portal tracts at 6 h with minimal injury in smaller bile ducts. More injury was observed in the left liver lobe than the median or right lobes. Figure 1 shows representative micrographs of main bile ducts in which injury was categorized as moderate (Fig. 1B) and moderate to severe (Fig. 1C), respectively. Bile ductules were consistently spared (Figs. 1B, 1C) and hepatocytes displayed no obvious morphological alterations (compare Fig. 1A to 1B and 1C). Histopathological assessment of the major portal tracts in at least two liver lobes per rat indicated injury to main bile ducts was ~36% absent, ~27% minor, ~18% moderate, and ~19% moderate to severe. Although occasional severe injury to main bile ducts was observed (e.g., Fig. 1C), DAPM-induced damage had no effect on serum liver constituents at 6 h (Table 1).
Figure 1.
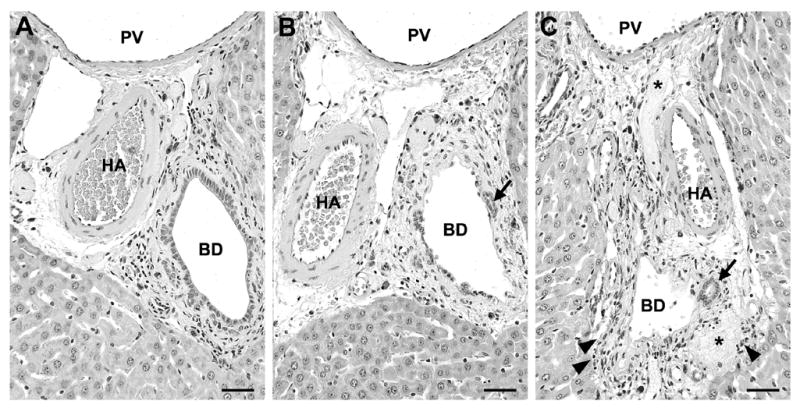
Representative micrographs of liver portal tracts from (A) control and (B, C) DAPM-treated rats. At 6 h after 25 mg DAPM/kg, major bile ducts (BD) were (B) partially or (C) completely denuded of BEC while bile ductules (arrows) were spared. Severe injury to major bile ducts (C) was accompanied by edema, inflammatory infiltrate (arrowheads), and fibrin exudate (asterisks). HA, hepatic artery; PV, portal vein. Hematoxylin and eosin; each bar = 2.5 μm.
TABLE 1.
Effects of 25 mg DAPM/kg on Serum Parameters at 6 Hours
| Treatment
|
||
|---|---|---|
| Serum Parameter | Control | DAPM |
| ALT (IU) | 31 ± 7 | 39 ± 15 |
| ALP (U/L) | 89 ± 4 | 97 ± 6 |
| Glucose (mg/dL) | 157 ± 8 | 162 ± 12 |
| Bilirubin (mg/dL) | 0.20 ± 0.01 | 0.24 ± 0.01 |
| Bile Salt (mM) | 0.30 ± 0.04 | 0.31 ± 0.01 |
Values are means ± SE of 4 (control) and 6 (DAPM-treated) rats.
Effects of DAPM on Bile Flow and Excretion of Biliary Solutes
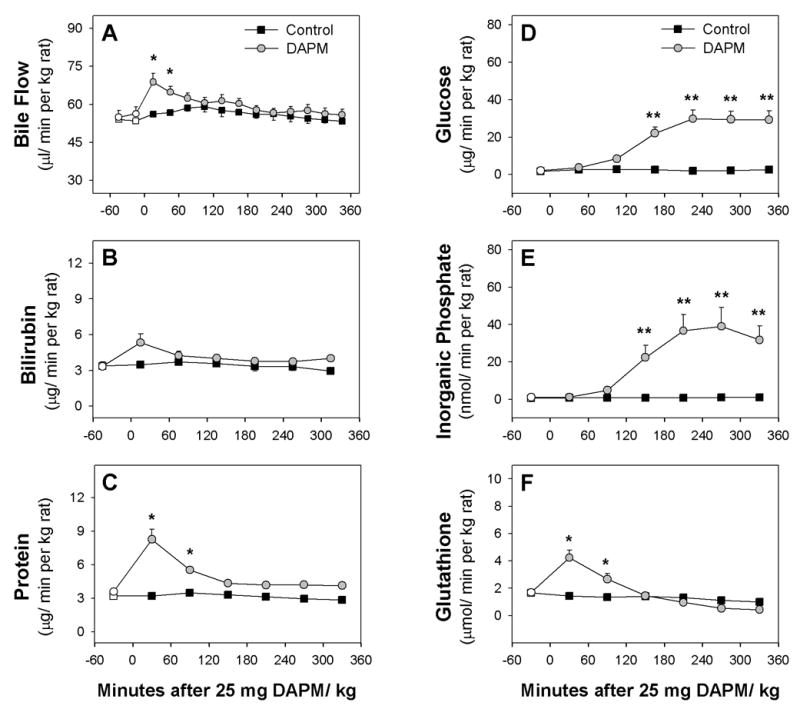
Administration of 25 mg DAPM/kg induced a transient, ~20% increase in bile flow during Hour 1 (Fig. 2A). As expected, this dose of DAPM had no effect on bilirubin (Fig. 2B) or bile salt excretion (data not shown). Protein and glutathione excretion increased ~2.3- and 2.5-fold, respectively, in Hour 1, and then declined to nearly control levels by Hour 3 (Figs. 2C, 2F). In contrast to other biliary solutes, alterations in glucose and Pi excretion were not observed until Hour 3 when each began to increase toward stable elevations of ~15- and 35-fold (Figs. 2D, 2E).
Figure 2.
Time course of changes in (A) bile flow and biliary excretion of (B) bilirubin, (C) protein, (D) glucose, (E) inorganic phosphate and (F) glutathione of control rats and rats treated with 25 mg DAPM/ kg. Values are means ± SE of four control or six DAPM-treated rats per group. Open symbols represent basal values; symbols without error bars indicate the SE lies within the symbol. Asterisks near symbols of DAPM-treated rats indicate values significantly different from control rats at that time point. * p < 0.05; ** p < 0.01. Note the Y axis is ~7-fold greater in graphs D and E than graphs B, C, and F.
Effects of DAPM on BEC Ultrastructure
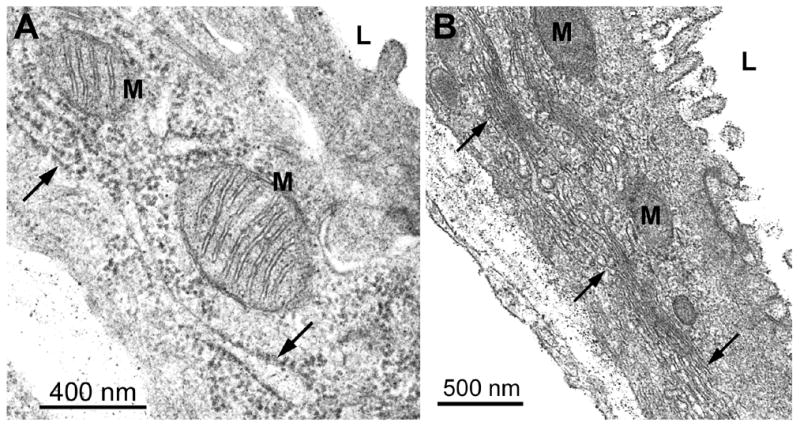
The histopathology data indicated numerous BEC were damaged by 6 h. Thus, we examined BEC ultrastructure at 3 h, the time point at which glucose and Pi excretion was increased ~10- and 20-fold, respectively, but bile flow and excretion of other biliary solutes were normal. In particular, tight junction morphology was examined, but no obvious alterations were observed (data not shown). Instead, randomly scattered mitochondria in BEC of main bile ducts were found to display translucent matrices, disrupted cristae and/or membrane whorls (Compare Fig. 4 with Fig. 3A). In addition, the Golgi regions in some BEC showed dilated cisternae and areas of membrane coalescence (Figs. 4, 5), which were notable in comparison to the prominent Golgi regions composed of regularly spaced lamellae in BEC from the livers of control rats (Fig. 3B). These ultrastructural alterations are consistent with those observed for the 50 mg/kg dose, where mitochondrial abnormalities, loss of lumenal microvilli and dilation of rough endoplasmic reticulum cisternae were also evident (Kanz et al., 1998).
Figure 4.
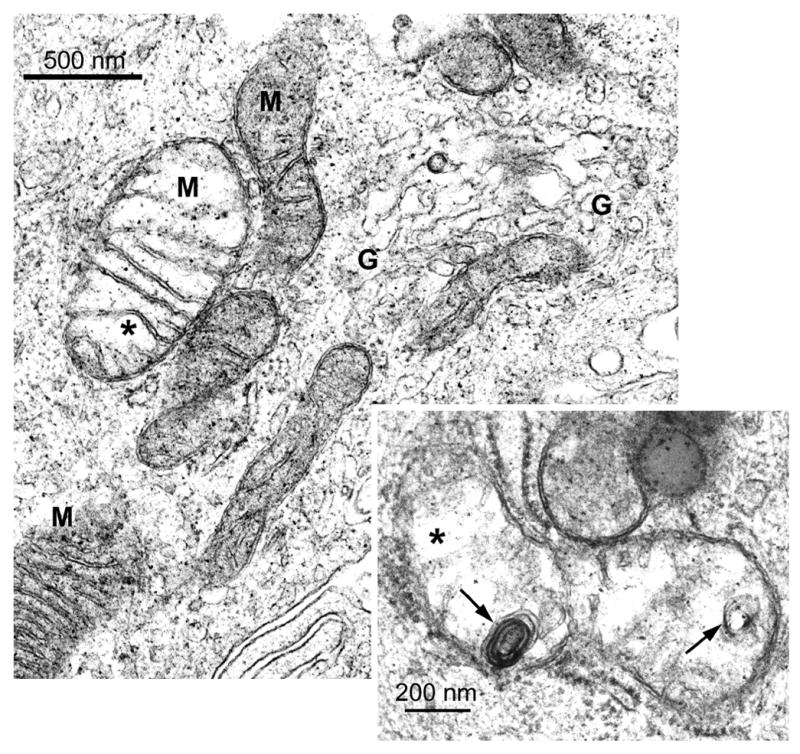
Electron micrographs of BEC from a rat liver 3 h after 25 mg DAPM/kg. The enlarged mitochondrion on the left displays a translucent matrix and areas that appear disrupted (asterisk). Cisternae of the Golgi region (G) are dilated and disorganized (upper right). Inset: Enlarged mitochondrion with translucent matrix, areas that appear disrupted (asterisk) and membrane whorls (arrows). Original magnification; 41,250X; inset; 82,500X.
Figure 3.
Electron micrographs of BEC from control rat livers. (A) Cross-sections of mitochondria (M) are rounded with dense matrices and typical cristae. Arrows indicate cisternae of the rough endoplasmic reticulum and a single microvilli extends from the lumenal (L) surface of the cell. Original magnification; 82,500X. (B) Regularly spaced cisternae of several Golgi regions (arrows) are seen adjacent to mitochondria that are rounded or elongated. Numerous microvilli extend from the lumenal surface of the cell. Original magnification; 41,250X.
Figure 5.
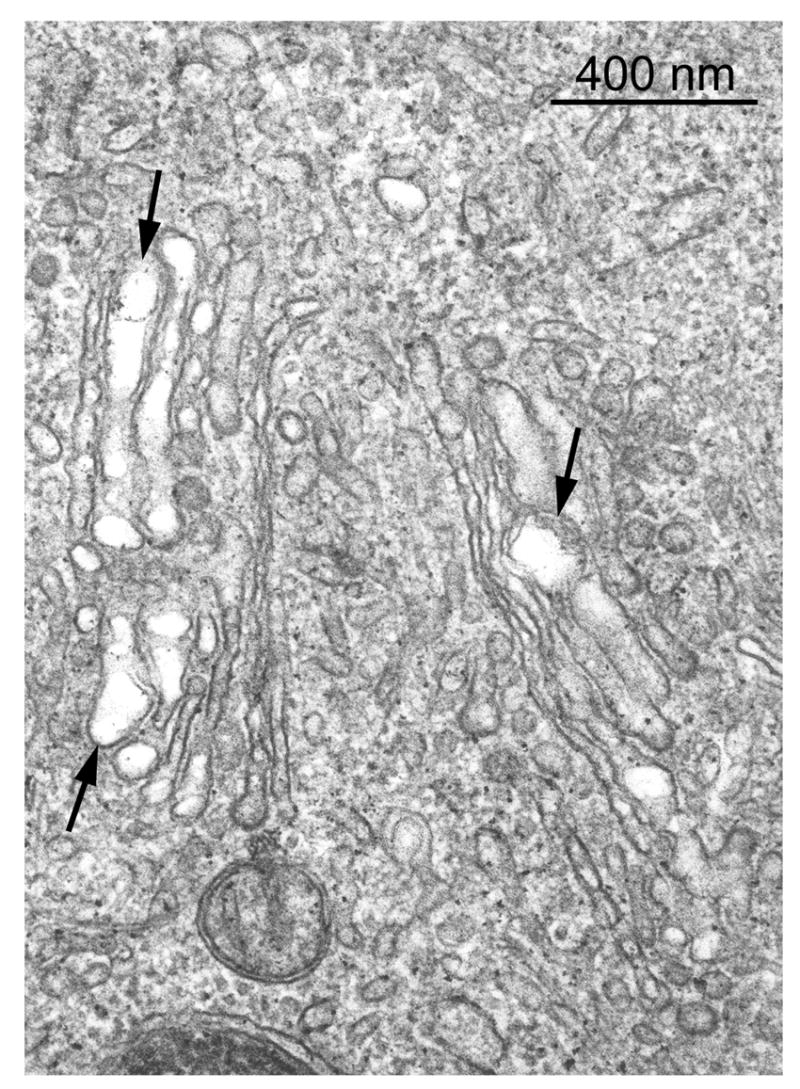
Electron micrograph of a BEC from a rat liver 3 h after 25 mg DAPM/kg. Regularly spaced cisternae of the Golgi region are replaced by dilated cisternae that show areas of membrane coalescence or disruption (arrows). Original magnification; 82,500X.
Effects of BEC Injury on Bile to Plasma Ratios of Inulin
Effects of Continuous Inulin Infusion on DAPM-Induced BEC Injury and Biliary Constituents
We chose an experimental period of 4 h for the examination of the effects of DAPM on B:P ratios of inulin because 1) elevations in the excretion of glucose and Pi were stable by 4 h, and 2) bile flow and excretion of other biliary solutes had returned to basal values (see Fig. 2). Pilot studies indicated that steady-state levels of [3H]-inulin could be achieved in blood (See Fig. 7A) while inulin was also being excreted into urine if [3H]-inulin was infused at a high rate (10 μl/min) for the first 45 minute after cannulation (during equilibration), followed by a slower infusion rate (6.66 μl/min) during the basal and experimental periods. To confirm that these rates of inulin infusion did not induce liver injury or exacerbate DAPM effects on biliary function, we examined liver histopathology, serum constituents and biliary solutes in control and DAPM-treated animals receiving continuous inulin infusion.
Figure 7.
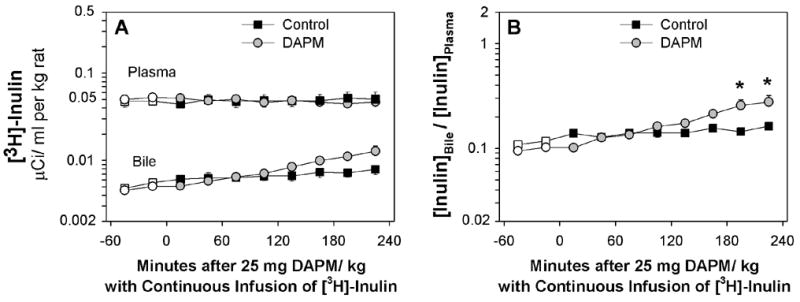
(A) Time course of changes in [3H]-inulin in plasma and bile and (B) ratio of [3H]-inulin in bile to plasma of control rats and rats treated with 25 mg DAPM/ kg. Values are means ± SE of four control and seven DAPM-treated rats per group. Open symbols represent basal values; symbols without error bars indicate the SE lies within the symbol. Asterisks near symbols of DAPM-treated rats indicate values significantly different from control rats at that time point. * p < 0.05. Note the Y axes are log scale.
In control animals infused with inulin, liver histology was unremarkable and serum enzymes were in normal ranges (data not shown). In DAPM-treated rats infused with inulin, DAPM injury was again generally confined to bile ducts of major portal tracts in the left liver lobe. Patterns of injury were similar to those shown in Fig. 1, except that the severity of injury was less at 4 h than at 6 h. Following examination of the major portal tracts in at least two liver lobes per rat, we classified DAPM injury of bile ducts as: ~38% absent, ~48% minor, ~14% moderate, and 0% moderate to severe. Furthermore, continuous inulin infusion followed by DAPM treatment had no effect on serum liver enzymes at 4 h (data not shown).
In control rats, inulin infusion did not alter bile flow (Fig. 6A) or the biliary excretion of several solutes (Figs 6B to 6E). In rats that were receiving inulin, DAPM treatment produced a minor increase in bile flow during the first hour which was not significantly different from bile flow in control rats (Fig. 6A). Nevertheless, bile flow rates in the first 30 min after DAPM treatment were equivalent in rats receiving inulin (mean = 65.1 ± 2.9 μl/min per kg, n=6) versus rats not receiving inulin (mean = 68.8 ± 3.7 μl/min per kg, n=7). Likewise, inulin infusion did not affect DAPM-induced increases in biliary protein (Fig. 6C), glucose (Fig. 6D) and Pi (Fig. 6E) that were seen in the absence of inulin (See Figs. 2C, 2D, 2E). The only apparent effect induced by inulin infusion followed by DAPM treatment was an elevation in bilirubin excretion (Fig. 6B), which became significant at two disparate time points.
Figure 6.
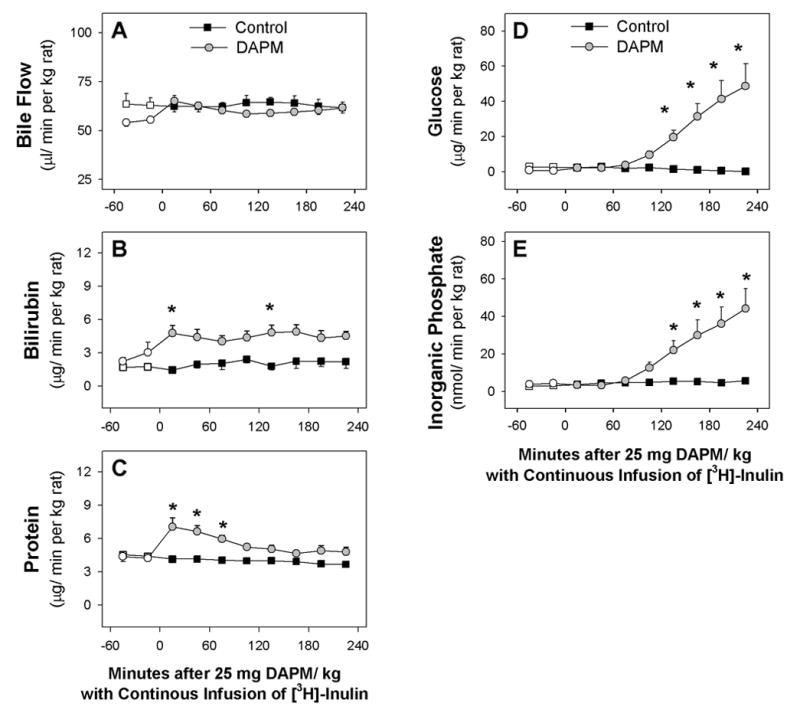
Time course of changes in (A) bile flow and biliary excretion of (B) bilirubin, (C) protein, (D) glucose, and (E) inorganic phosphate of control rats and rats treated with 25 mg DAPM/ kg that were continuously infused with [3H]-inulin. Values are means ± SE of four rats per group (B, C) or four control and seven DAPM-treated rats per group (A, C, D). Open symbols represent basal values; symbols without error bars indicate the SE lies within the symbol. Asterisks near symbols of DAPM-treated rats indicate values significantly different from control rats at that time point. * p < 0.05; ** p < 0.01. Note the Y axis is ~6-fold greater in graphs D and E than graphs B and C.
Effects of DAPM on Bile to Plasma (B:P) Ratios of Inulin
During the 5 hrs of continuous inulin infusion, plasma concentrations in control and DAPM-treated rats remained stable (Fig. 7A). In contrast, biliary concentrations of inulin increased ~60% in control rats and ~180% in DAPM-treated rats (Fig. 7A). Thus, B:P ratios of inulin were significantly increased in DAPM-treated rats during Hour 4 (Fig. 7B). However, increases in the B:P ratios of inulin were temporally slower in DAPM-treated rats than the concomitant increases in biliary inorganic phosphate and glucose (See Figs. 6D, 6E).
Correlation of DAPM-Induced Effects on Biliary Phosphate, Glucose and B:P Ratio of Inulin
As expected, DAPM-induced increases in biliary phosphate demonstrated a strong correlation with increases in biliary glucose (Fig. 8A; r2 = 0.94, p <0.001). Similarly, B:P ratios of inulin showed strong correlations with DAPM-induced increases in biliary phosphate (Fig. 8B; r2 = 0.76, p <0.001) and biliary glucose (Fig. 8C; r2 = 0.82, p <0.001). No correlations were observed between B:P ratios of inulin and DAPM-induced alterations in biliary bilirubin or protein (data not shown).
Figure 8.
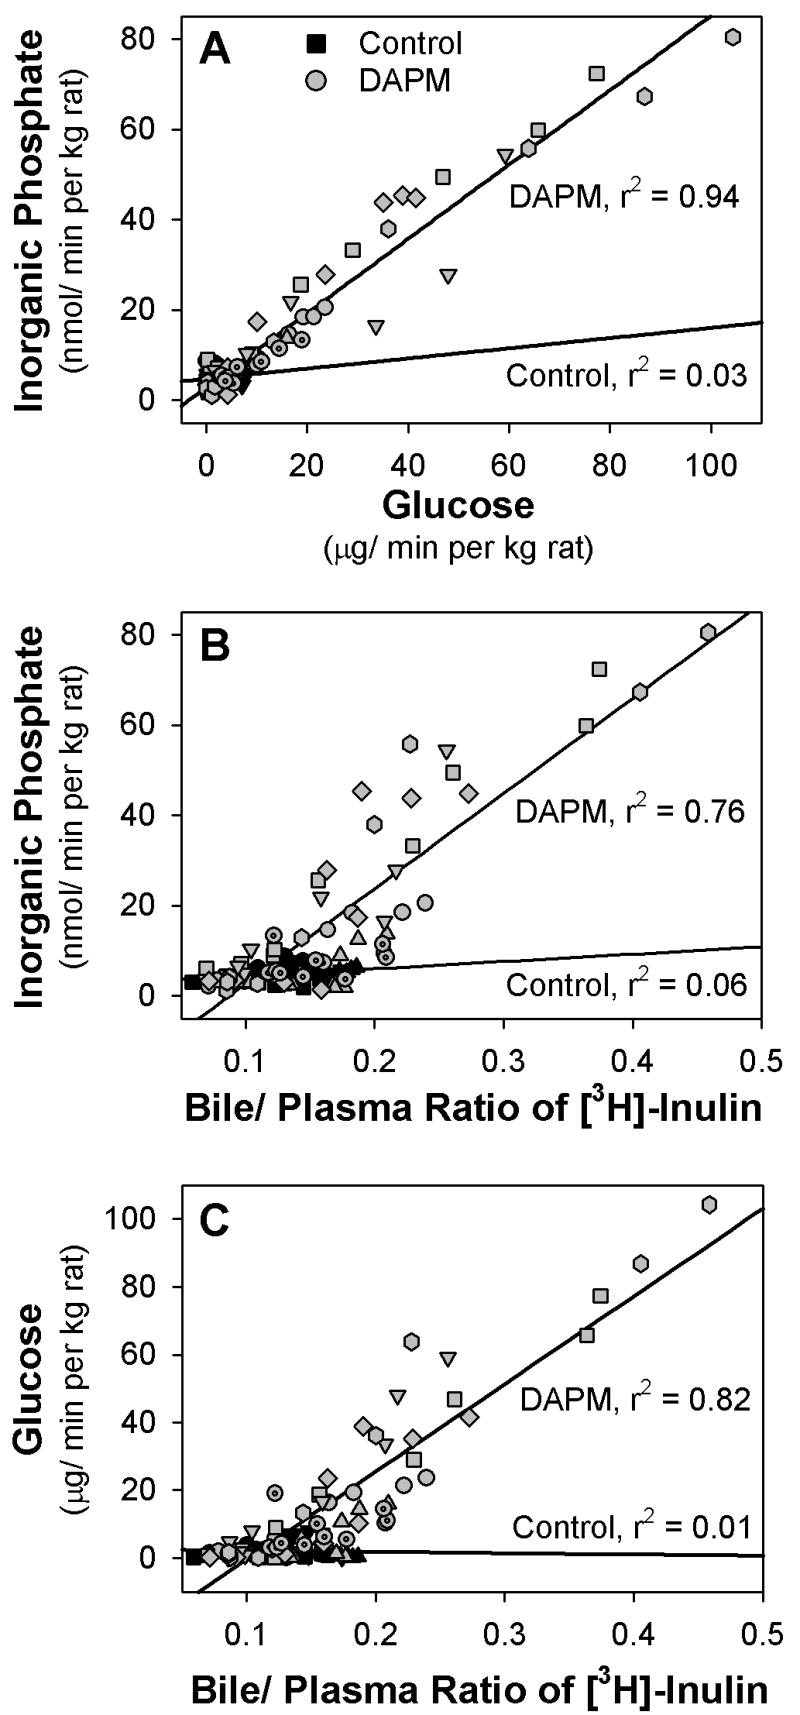
Linear regression plots of the biliary excretion of (A) inorganic phosphate versus glucose, (B) inorganic phosphate versus B:P ratio of inulin, and (C) glucose versus B:P ratio of inulin in 4 control rats (black symbols) and 7 rats treated with 25 mg DAPM/ kg (gray symbols). Each symbol shape represents the values from one rat.
Effects of DAPM-Bile on the Bi-Ionic Potentials of BEC Monolayers
A sharp increase in TER was observed during Na+ replacement with TMA+ in all BEC monolayers before exposure to various biles (Figs. 9A, 9C). In contrast, replacement of Cl− with GA− on the apical surface of monolayers had little effect on TER (Figs. 9A, 9C). Following exposure of monolayers to Basal Bile, the pattern of changes in TER and bi-ionic potentials during replacement of permeable ions in the apical solution with impermeable ions was not altered (Figs. 9A, 9B). But the pattern of change in TER and bi-ionic potentials after treatment with DAPM-Bile (1st Hr) differed considerably from the patterns exhibited before treatment (Figs. 9C, 9D). Basal TER decreased ~35% after exposure to DAPM-Bile (1st Hr) (Fig. 9C), and elevations in TER and Vt following Na+ replacement with TMA+ were ~25% and 40%, respectively, of the changes observed prior to bile exposure (Figs. 9C, 9D). In addition, slight decreases in Vt were observed when Cl− was replaced with GA− following monolayer exposure to DAPM-Bile (1st Hr) (Fig. 9D). Similar but less severe alterations in TER and bi-ionic potentials occurred with monolayers exposed to DAPM-Bile (2nd Hr) (data not shown).
Figure 9.
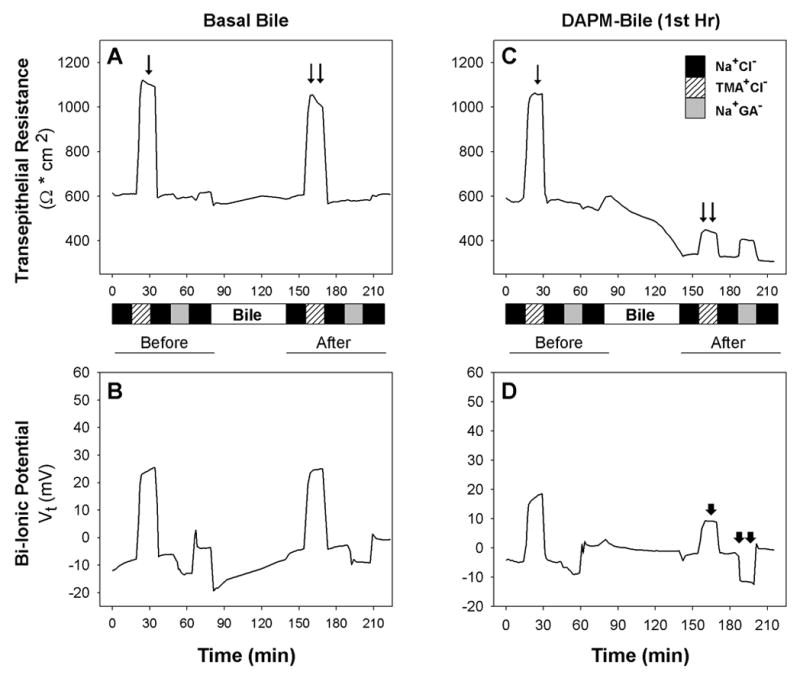
Representative measurements of (A,C) transepithelial resistance (TER) and (B,D) bi-ionic potentials of BEC monolayers before and after incubation with Basal Bile (left) and DAPM-Bile (1st Hr) (right). A). The TER increases observed when Na+ is replaced by TMA+ are equivalent prior to (arrow) and after (double arrows) monolayer exposure to Basal Bile. B). Changes in Vt in the presence of different ions follow the same pattern before and after incubation with Basal Bile. C). Baseline TER declined from ~590 to ~330 Ω * cm2 following monolayer exposure to DAPM-Bile (1st Hr). The TER increase (double arrow) observed when Na+ is replaced by TMA+ after monolayer exposure to DAPM-Bile (1st Hr) is one-third of the TER increase (arrow) observed during Na+ replacement by TMA+ prior to bile exposure. D). Vt change during Na+ replacement by TMA+ is decreased (arrowhead) while Vt change during Cl− replacement by GA− becomes slightly more negative (double arrowheads) following DAPM-Bile (1st Hr) exposure. Data are representative of a minimum of 3 monolayers exposed to pooled bile samples of Basal Bile and DAPM-Bile (1st Hr).
Discussion
Prior studies have suggested that DAPM is a selective BEC toxicant (Bailie et al., 1993; Kanz et al., 1998; Santa Cruz et al., 2005), but evidence that the alterations in biliary parameters induced by DAPM are characteristic of BEC injury rather than hepatocellular injury has been equivocal. Thus, we examined aspects of BEC function in rats given a dose of DAPM (25 mg/ kg) that is reported to be below the threshold of injury (Bailie et al., 1993). Our reasoning was that, if no indices of hepatocellular injury could be detected at this dose of DAPM, alterations observed should be related to the injurious effects of DAPM on BEC alone. The present studies provide strong evidence that the earliest effects of DAPM in vivo are functional and morphological changes associated with BEC impairment. First, 25 mg DAPM/kg had no effect on hepatocyte morphology (Fig. 1) and did not increase serum or biliary constituents indicative of injury (enzymes) or impairment in bile formation (cholestasis, uptake and excretion of bile acids, bilirubin) (Table 1, Fig. 2). Second, increases in biliary protein and glutathione which are predominately excreted by hepatocytes (LaRusso, 1984; Ballatori and Truong, 1992) returned to baseline levels by ~3 h, indicating only transient modulation of hepatocyte function by DAPM. Conversely, histological and ultrastructural evidence of BEC injury was observed (Figs. 1, 4, 5), and solutes (glucose, Pi) believed to be actively taken up by BEC (Lira et al., 1992; Lazaridis et al., 1997; Frei et al., 2004) were increased in bile (Fig. 2). Finally, stabilization of the glucose and Pi elevations by 4 h and an absence of BEC injury in ~35% of the major portal tracts indicated that this dose produced only mild BEC injury by 6 h.
Other evidence supports our theory that DAPM-induced BEC injury is followed by or concurrent with loosening of BEC TJs. Studies using isolated segments of the rat bile duct have demonstrated that inulin can enter bile by diffusion through bile ducts/ ductules (Smith and Boyer, 1982). Perfusate to plasma ratios for solutes determined in the rat bile duct were comparable to those determined in isolated perfused livers (Lake et al., 1985; Lorenzini et al., 1986) or livers of anesthetized rats (Shanker and Hogben, 1961), which suggests that bile duct/ ductular TJs have similar permeability characteristics for inert solutes as canalicular TJs. Pi and glucose are believed to enter bile via TJs (Handler et al., 1994; Krell et al., 1982), but solute movement through the paracellular route is restricted by both size and charge (Kan and Coleman, 1986; Smith and Boyer, 1982). DAPM-induced increases in biliary Pi (MW 95) were tightly correlated with increases in glucose (MW 180) (Fig. 8) which is consistent with limited movement of Pi through TJs due to its negative charge (Kan and Coleman, 1986). In addition, the temporally later elevations in the B:P ratios of inulin than biliary Pi and glucose are consistent with the greater size of inulin (MW ~5000) which suggests that BEC TJ permeability was increasing with time after DAPM treatment. Finally, DAPM-induced elevations in B:P ratios of inulin occurred in the absence of cholestasis. Previously, xenobiotic-induced increases in B:P ratios of solutes have been observed (Jaeschke et al., 1983; 1987a; Krell et al., 1987) when cholestasis was manifest and ultrastructural alterations in canalicular tight junctions were apparent (Krell et al., 1987).
Studies with α-naphthylisothiocyanate (ANIT) also support our theory that cholangiodestructive toxicants initially induce TJ leakiness between BEC prior to canalicular TJs. Ultrastructural studies following ANIT administration demonstrated a complete opening of TJs between BEC by 6 h (Connolly et al., 1988). Other studies have established that significant cholestasis occurs between 9 and 11 h after ANIT treatment (Jaeschke et al., 1987a; Krell et al., 1982; Krell et al., 1987) when ultrastructural alterations in canalicular TJs can be observed (Krell et al., 1987). In bile collected immediately after isolation of livers from rats treated previously with ANIT, concentrations of Pi, 32P-orthophosphate and 14C-sucrose show moderate increases through 6 h but reach perfusate levels by 9 to 11 h (Krell et al., 1982). Similarly, biliary inulin concentrations were increased ~50% by 6 h of ANIT treatment but dramatically increased ~300% between 10 and 12 h of ANIT treatment (Kan and Coleman, 1986). These observations indicate that movement of inert solutes and Pi into bile is modest through 6 h after large doses of ANIT during which time TJs between BEC become damaged (Connolly et al., 1988), and that movement of solutes and Pi increases substantially during establishment of cholestasis. Thus, the earliest TJ leakage is likely to be due to alterations in paracellular pathways between BEC.
In this study, we used a continuous infusion protocol which generated steady-state levels of plasma inulin in rats whose excretory functions were intact. This infusion protocol induced minor alterations in biliary parameters in DAPM-treated rats, which included an attenuation of the mild choleresis typically observed in the first hour following treatment (Fig. 6A) (Kanz et al., 1998; 1992) and a marginal increase in bilirubin excretion (Fig. 6B). The manner in which inulin could modulate either bile flow or bilirubin excretion following DAPM administration is presently unknown. However, we do not consider that the constant infusion and excretion of inulin appreciably altered pathways of bile formation because B:P ratios of control rats in our study were comparable to those observed in isolated perfused rat livers with recirculating perfusate (Lake et al., 1985; Krell et al., 1987) as well as in anesthetized rats with ligated renal pedicles and bolus injections of inulin (Shanker and Hogben, 1961; Lorenzini et al., 1986; Smith and Boyer, 1982). Furthermore, we consider the minor alterations in biliary parameters caused by constant inulin infusion to be insufficient to invalidate the DAPM-induced increases in inulin B:P ratios which occurred hours later (Fig. 7).
We had previously reported that exposure of BEC to DAPM-Bile (1st Hr) for 120 min decreased TERs and increased solute leakage from apical to basolateral media, which indicated TJ impairment (Santa Cruz et al., 2005). In this study, we determined that TJs between BEC are Na+ selective with little permeability to anions (Fig. 9). These observations are consistent with other epithelial cell types where TJs have been reported to contain pores or channels with a distinct preference for cations and molecules between 8 to 18 angstroms (Barry et al., 1971; Claude, 1978). In assessing the effects of DAPM-Bile on TJ selectivity, we found a decrease in basal TER by ~35% and a loss of Na+-selectivity through TJs, as indicated by increased permeability to TMA+ (Fig. 9). Furthermore, the slight decreases in Vt observed when Cl- was replaced with GA− following exposure to DAPM-Bile (1st Hr) indicated increased TJ permeability to Cl−. Our observations of cation selectivity of BEC TJs and impairment of this selectivity by DAPM are original. Moreover, our results extend prior studies which demonstrated that canalicular TJs are cation selective (Bradley and Herz, 1978; Hardison et al., 1989) and that charge selectivity is altered by hormones such as vasopressin (Hardison et al., 1991) and xenobiotics such as ANIT (Enderle et al., 1995). Our observations of DAPM-induced alterations in the charge selectivity of BEC TJs thus expand our basic understanding of possible functional alterations within the biliary tree.
Very few studies have examined the structure and function of BEC TJs. Exposure of immortalized mouse cholangiocytes to tumor necrosis factor-α and interferon-γ on the basolateral but not the apical surface decreased TERs in a dose- and time-dependent manner which was accompanied by increased inulin permeability from the apical to basolateral media (Hanada et al., 2003). In contrast, severe metabolic depletion of ATP levels (~5% of control) in normal rat cholangiocytes decreased TERs by ~70% without effects on TJ permeability (Doctor et al., 1999). We have previously reported that exposure of BEC monolayers to DAPM Bile (1st Hr) for 1 h decreases ATP levels by ~85% which is temporally followed by increases in paracellular permeability and decreases in TER (Santa Cruz et al., 2005). Results reported herein also demonstrate that exposure of BEC to DAPM-Bile for 1 h results in decreased TERs and impairment of TJ cation selectivity. Our observations are highly analogous to studies in human intestinal epithelial cells where 60 min of ATP depletion rapidly decreased TERs while slowly increasing paracellular permeability to mannitol (MW 182) but not to inulin (MW 5000). Furthermore, this ATP depletion markedly reduced junctional charge selectivity (Matthews et al., 1994). Based on these findings, DAPM-induced impairments in BEC TJs may be associated with its early alterations in BEC mitochondrial structure (swelling, translucent matrices) and function (depolarization, diminished ATP levels) (Santa Cruz et al., 2005). This possibility will require more in-depth studies of DAPM-induced effects on BEC mitochondria.
In summary, we have developed a DAPM model in which BEC injury but not hepatocellular injury is apparent. This model allowed us to examine the temporal movement of endogenous solutes (Pi and glucose) and an inert solute (inulin) from plasma to bile. Our findings suggest that increased paracellular permeability of BEC TJs occurs following or concurrently with BEC injury while canalicular TJs are maintained. Evidence in support of our theory that TJs in one area of the biliary tree can be altered without concomitant effects on the remainder of the biliary tree is provided by the study of Kawaguchi et al. (1999). These authors report that extrahepatic cholestasis (bile duct ligation [BDL]) produced a different pattern of alterations in TJ-associated proteins than intrahepatic cholestasis (ethinyl estradiol [EE] treatment) and thus, BDL and EE induce different lobular distributions of increased paracellular permeability. Additional support for our theory is provided by our in vitro findings that exposure of BEC monolayers to DAPM-Bile results in TER decreases and impairment of cation selectivity by BEC TJs. Our in vivo and in vitro models therefore should be useful for clarifying the mechanistic basis for injury by DAPM and other cholangiodestructive toxicants.
Acknowledgments
This work was supported by NIH grants R01 ES06348 (to M.F.K.), F31 ES05831 (to V.S.C.), T32 ES07254 and by a grant from the UTMB Centennial Center for Environmental Toxicology (to V.S.C.). We would like to acknowledge Dr. Guillermo Altenberg for helpful discussions regarding bi-ionic potentials, and Drs. Mary Treinen Moslen and Tammy Dugas for constructive suggestions.
Footnotes
Publisher's Disclaimer: This is a PDF file of an unedited manuscript that has been accepted for publication. As a service to our customers we are providing this early version of the manuscript. The manuscript will undergo copyediting, typesetting, and review of the resulting proof before it is published in its final citable form. Please note that during the production process errors may be discovered which could affect the content, and all legal disclaimers that apply to the journal pertain.
References
- Bailie MB, Mullaney TP, Roth RA. Characterization of acute 4,4’-methylene dianiline hepatotoxicity in the rat. Environ Health Perspect. 1993;101:130–133. doi: 10.1289/ehp.93101130. [DOI] [PMC free article] [PubMed] [Google Scholar]
- Ballatori N, Truong AT. Glutathione as a primary osmotic driving force in hepatic bile formation. Am J Physiol. 1992;263:G617–G624. doi: 10.1152/ajpgi.1992.263.5.G617. [DOI] [PubMed] [Google Scholar]
- Barry PH. Ionic permeation mechanisms in epithelia: biionic potentials, dilution potentials, conductances and streaming potentials. Methods Enzymol. 1989;171:678–715. doi: 10.1016/s0076-6879(89)71038-7. [DOI] [PubMed] [Google Scholar]
- Barry PH, Diamond JM, Wright EM. The mechanism of cation permeation in rabbit gallbladder: Dilution potentials and biionic potentials. J Membr Biol. 1971;4:358–394. doi: 10.1007/BF02431979. [DOI] [PubMed] [Google Scholar]
- Bastien PG. Occupational hepatitis caused by methylenedianiline. Med J Aust. 1984;141:533–535. doi: 10.5694/j.1326-5377.1984.tb132915.x. [DOI] [PubMed] [Google Scholar]
- Bradley SE, Herz R. Permselectivity of biliary canalicular membrane in rats: clearance probe analysis. Am J Physiol Endocrinol Metab Gastrointest Physiol. 1978;235:E570–E576. doi: 10.1152/ajpendo.1978.235.5.E570. [DOI] [PubMed] [Google Scholar]
- Claude P. Morphologic factors influencing transepithelial permeability: A model for resistance of the zona occludens. J Membr Biol. 1978;39:219–232. doi: 10.1007/BF01870332. [DOI] [PubMed] [Google Scholar]
- Connolly AK, Price SC, Connelly JC, Hinton RH. Early changes in bile duct lining cells and hepatocytes in rats treated with α-naphthylisothiocyanate. Toxicol Appl Pharmacol. 1988;93:208–219. doi: 10.1016/0041-008x(88)90121-4. [DOI] [PubMed] [Google Scholar]
- Do Luu HM, Hutter JC. Pharmacokinetic modeling of 4,4’-methylenedianiline released from reused polyurethane dialyzer potting materials. J Biomed Mater Res. 2000;53:276–286. doi: 10.1002/(sici)1097-4636(2000)53:3<276::aid-jbm13>3.0.co;2-e. [DOI] [PubMed] [Google Scholar]
- Doctor RB, Dahl RH, Salter KD, Fitz JG. Reorganization of cholangiocyte membrane domains represents an early event in rat liver ischemia. Hepatology. 1999;29:1364–1374. doi: 10.1002/hep.510290514. [DOI] [PubMed] [Google Scholar]
- Dugas TR, Santa Cruz V, Liu H, Kanz MF. Evaluation of the gender differences in 4,4'-methylenedianiline toxicity, distribution, and effects on biliary parameters. J Toxicol Environ Health (A) 2001;62:467–483. doi: 10.1080/00984100150501187. [DOI] [PubMed] [Google Scholar]
- Enderle GJ, Delabar U, Krell H. Different pathomechanisms of altered biliary leukotriene C4 elimination in isolated perfused rat livers. Biochem Pharmacol. 1995;49 :297–304. doi: 10.1016/0006-2952(94)00461-t. [DOI] [PubMed] [Google Scholar]
- Forker EL. Hepatocellular uptake of inulin, sucrose and mannitol in rats. Am J Physiology. 1970;219:1568–1573. doi: 10.1152/ajplegacy.1970.219.6.1568. [DOI] [PubMed] [Google Scholar]
- Hanada S, Harada M, Koga H, Kawaguchi T, Taniguchi E, Kumashiro R, Ueno T, Ueno Y, Ishii H, Sakisaka S, Sata M. Tumor necrosis factor-α and interferon-γ directly impair epithelial barrier function in cultured mouse cholangiocytes. Liver Int. 2003;23:3–11. doi: 10.1034/j.1600-0676.2003.01707.x. [DOI] [PubMed] [Google Scholar]
- Handler JA, Kossor DC, Goldstein RS. Assessment of hepatobiliary function in vivo and ex vivo in the rat. J Pharmacol Toxicol Methods. 1994;31:11–19. doi: 10.1016/1056-8719(94)90024-8. [DOI] [PubMed] [Google Scholar]
- Hardison WGM, Dalle-Molle E, Gosink E, Lowe PJ, Steinbach JH, Yamaguchi Y. Function of rat hepatocyte tight junctions: studies with bile acid infusions. Am J Physiol Gastrointest Liver Physiol. 1991;260:G167–G174. doi: 10.1152/ajpgi.1991.260.1.G167. [DOI] [PubMed] [Google Scholar]
- Hardison WGM, Lowe PJ, Shanahan M. Effect of molecular charge on para- and transcellular access of horseradish peroxidase into rat bile. Hepatology. 1989;9:866–871. doi: 10.1002/hep.1840090613. [DOI] [PubMed] [Google Scholar]
- IARC. IARC monographs on the evaluation of carcinogenic risk of chemicals to humans. Vol. 39. Lyon; France: 1986. pp. 347–365. [PubMed] [Google Scholar]
- Jaeschke H, Krell H, Pfaff E. No increase of biliary permeability in ethinylestradiol-treated rats. Gastroenterology. 1983;85:808–814. [PubMed] [Google Scholar]
- Jaeschke H, Krell H, Pfaff E. Quantitative estimation of transcellular and paracellular pathways of biliary sucrose in isolated perfused rat liver. Biochem J. 1987a;241:635–640. doi: 10.1042/bj2410635. [DOI] [PMC free article] [PubMed] [Google Scholar]
- Jaeschke H, Trummer E, Krell H. Increase in biliary permeability subsequent to intrahepatic cholestasis by estradiol valerate in rats. Gastroenterology. 1987b;93:533–538. doi: 10.1016/0016-5085(87)90916-4. [DOI] [PubMed] [Google Scholar]
- Kamisako T, Kobayashi Y, Takeuchi K, Ishihara T, Higuchi K, Tanaka Y, Gabazza EC, Adachi Y. Recent advances in bilirubin metabolism research: the molecular mechanism of hepatocyte bilirubin transport and its clinical relevance. J Gastroenterol. 2000;35:659–664. doi: 10.1007/s005350070044. [DOI] [PubMed] [Google Scholar]
- Kan KS, Coleman R. 1-Naphthylisothiocyanate-induced permeability of hepatic tight junctions to proteins. Biochem J. 1986;238:323–328. doi: 10.1042/bj2380323. [DOI] [PMC free article] [PubMed] [Google Scholar]
- Kanz MF, Gunasena GH, Kaphalia L, Hammond DK, Syed YA. A minimally toxic dose of methylene dianiline injures biliary epithelial cells in rats. Toxicol Appl Pharmacol. 1998;150:414–426. doi: 10.1006/taap.1998.8382. [DOI] [PubMed] [Google Scholar]
- Kanz MF, Kaphalia L, Kaphalia BS, Romagnoli E, Ansari GA. Methylene dianiline: acute toxicity and effects on biliary function. Toxicol Appl Pharmacol. 1992;117:88–97. doi: 10.1016/0041-008x(92)90221-d. [DOI] [PubMed] [Google Scholar]
- Kawaguchi T, Sakisaka S, Sata M, Mori M, Tanikawa K. Different lobular distributions of altered hepatocytes tight junctions in rat models of intrahepatic and extrahepatic cholestasis. Hepatology. 1999;29:205–216. doi: 10.1002/hep.510290115. [DOI] [PubMed] [Google Scholar]
- Kopelman H, Scheuer PJ, Williams R. The liver lesion of the Epping jaundice. Q J Med. 1966;140:553–564. [Google Scholar]
- Koss FW, Mayer D, Haindl H. Bile acids. Methods Enzymol Anal. 1974;4:1886–1888. [Google Scholar]
- Krell H, Hoke H, Pfaff E. Development of intrahepatic cholestasis by alpha-naphthylisothiocyanate in rats. Gastroenterology. 1982;82:507–514. [PubMed] [Google Scholar]
- Krell H, Metz J, Jaeschke H, Hoke H, Pfaff E. Drug-induced intrahepatic cholestasis: Characterization of different pathomechanisms. Arch Toxicol. 1987;60:124–130. doi: 10.1007/BF00296964. [DOI] [PubMed] [Google Scholar]
- Lake JR, Licko V, Van Dyke RW, Scharschmidt BF. Biliary secretion of fluid-phase markers by the isolated perfused rat liver. Role of transcellular vesicular transport. J Clin Invest. 1985;76:676–684. doi: 10.1172/JCI112021. [DOI] [PMC free article] [PubMed] [Google Scholar]
- LaRusso NF. Proteins in bile: how they get there and what they do. Am J Physiol Gastrointest Liver Physiol. 1984;247:G199–G205. doi: 10.1152/ajpgi.1984.247.3.G199. [DOI] [PubMed] [Google Scholar]
- Lazaridis KN, Pham L, Vroman B, de Groen PC, LaRusso NF. Kinetic and molecular identification of sodium-dependent glucose transporter in normal rat cholangiocytes. Am J Physiol. 1997;272:G1168–G1174. doi: 10.1152/ajpgi.1997.272.5.G1168. [DOI] [PubMed] [Google Scholar]
- Lira M, Schteingart CD, Steinbach JH, Lambert K, McRoberts JA, Hofmann AF. Sugar absorption by the biliary ductular epithelium of the rat: evidence for two transport systems. Gastroenterology. 1992;102:563–571. doi: 10.1016/0016-5085(92)90104-7. [DOI] [PubMed] [Google Scholar]
- Lorenzini I, Sakisaka S, Meier PJ, Boyer JL. Demonstration of a transcellular vesicle pathway for biliary excretion of inulin in rat liver. Gastroenterology. 1986;91:1278–1288. doi: 10.1016/s0016-5085(86)80028-2. [DOI] [PubMed] [Google Scholar]
- Matthews JB, Smith JA, Tally KJ, Menconi MJ, Nguyen H, Fink MP. Chemical hypoxia increases junctional permeability and activates electrogenic ion transport in human intestinal epithelial monolayers. Surgery. 1994;116:150–158. [PubMed] [Google Scholar]
- Moore WM. Methylenedianiline. In: Mark HF, Othmer DF, Overgerger CG, Seagorg GT, editors. Kirk-Othmer Encyclopedia of Chemical Technology. 3. Vol. 2. John Wiley & Sons; New York: 1978. pp. 338–348. [Google Scholar]
- Moslen MT, Kanz MF, Bhatia J, Catarau EM. Two cannula method for parenteral infusion and serial blood sampling in the freely moving rat. J Parenter Enteral Nutr. 1988a;12:633–637. doi: 10.1177/0148607188012006633. [DOI] [PubMed] [Google Scholar]
- Moslen MT, Kanz MF, Ferguson AE. A stable colorimetric assay to measure toxin elevation of inorganic phosphate in bile. Anal Biochem. 1988b;168:405–410. doi: 10.1016/0003-2697(88)90336-3. [DOI] [PubMed] [Google Scholar]
- Santa Cruz V, Dugas TR, Kanz MF. Mitochondrial dysfunction occurs before transport or tight junction deficits in biliary epithelial cells exposed to bile from methylenedianiline-treated rats. Toxicol Sci. 2005;84:129–138. doi: 10.1093/toxsci/kfi061. [DOI] [PubMed] [Google Scholar]
- Smith ND, Boyer JL. Permeability characteristics of bile duct in the rat. Am J Physiol. 1982;242:G52–G57. doi: 10.1152/ajpgi.1982.242.1.G52. [DOI] [PubMed] [Google Scholar]
- Smith PK, Krohn RI, Hermanson GT, Mallia AK, Gartner FH, Provenzano MD, Fujimoto EK, Goeke NM, Olson BJ, Klenk DC. Measurement of protein using bicinchoninic acid. Anal Biochem. 1985;150:76–85. doi: 10.1016/0003-2697(85)90442-7. [DOI] [PubMed] [Google Scholar]
- Tietze F. Enzymatic method for quantitative determination of nanogram amounts of total and oxidized glutathione. Anal Biochem. 1969;27:502–515. doi: 10.1016/0003-2697(69)90064-5. [DOI] [PubMed] [Google Scholar]
- Tillmann HL, van Pelt FN, Martz W, Luecke T, Welp H, Dorries F, Veuskens A, Fischer M, Manns MP. Accidental intoxication with methylene dianiline p,p'-diaminodiphenylmethane: acute liver damage after presumed ecstasy consumption. J Toxicol Clin Toxicol. 1997;35:35–40. doi: 10.3109/15563659709001163. [DOI] [PubMed] [Google Scholar]
- Trauner M, Boyer JL. Bile salt transporters: Molecular characterization, function, and regulation. Physiol Rev. 2002;83:633–671. doi: 10.1152/physrev.00027.2002. [DOI] [PubMed] [Google Scholar]


