

Abstract
Nephron reduction is an important factor in the development of glomerulosclerosis. In a study of the oligosyndactyly (Os) mutation that causes a congenital 50% reduction in nephron number, we previously found that ROP Os/+ mice developed glomerulosclerosis whereas C57B1/6J Os/+ mice did not. We concluded that the predisposition to glomerulosclerosis depended largely on the genetic background, the ROP being sclerosis-prone whereas the C57 strain was sclerosis-resistant. In the current experiments we asked whether the intensity of the sclerotic response to nephron reduction in the ROP strain was related to the time at which it occurred, ie, a pre- or post-natal event. We also determined whether the absence of lesions in C57 Os/+ mice was caused by a higher threshold for the induction of a sclerotic response in C57 mice. We further examined the relationship between glomerular hypertrophy and sclerosis. C57 +/+, C57 Os/+, ROP +/+, and ROP Os/+ mice were uninephrectomized (NX) at age 10 weeks and followed for 8 weeks. We found no sclerotic changes in NX C57 +/+ and C57 Os/+ mice, despite a 75% reduction in nephron number in the latter. In contrast, both NX ROP +/+ and NX ROP Os/+ mice had glomerulosclerosis, which was more severe in the NX ROP Os/+ mice. Examination of extracellular matrix synthesis and degradation at the mRNA level revealed that synthesis exceeded degradation in ROP Os/+ mice. The lesions in NX ROP +/+ were less severe than in sham-operated ROP/Os mice, suggesting that the timing of nephron reduction affected the amplitude of the sclerotic response in this strain. Following NX, an increase in glomerular volume was found in C57 +/+, ROP +/+, and ROP Os/+ mice. However, NX did not lead to a further increase in glomerular volume in C57 Os/+ mice. We make three conclusions: 1) sclerosis was more severe in the ROP strain when nephron reduction occurred in utero; 2) the absence of glomerulosclerosis in C57 mice was not related to a higher threshold for a sclerosis response in this strain; and 3) whereas glomerular size continued to increase as nephron number decreased in ROP mice, it reached a plateau in C57 mice.
Because the shortage of cadaver kidneys has prompted an increase in the use of kidneys from living donors for transplantation, 1 it is important to know whether this practice places donors at risk. 2-6 Many, 5,6 but not all, 2-4 retrospective studies have demonstrated that adult donors do not have a significant decline of renal function in follow-up periods of up to 45 years. It is possible that the risk to the donor depends on their susceptibility to a reduction in renal mass. In fact, patients undergoing unilateral nephrectomy who have a family history of renal disease and hypertension appear to carry a higher risk of long-term renal insufficiency than those without familial antecedents. 7 There is increasing evidence that genetic factors play an important role in the development of a large number of glomerular diseases. 8-10 Furthermore, we recently found that the renal response to an inborn deficit in nephron number was strain-dependent. 11 We studied renal lesions in sclerosis-prone (ROP) and sclerosis-resistant (C57) mice carrying a radiation-induced mutation associated with a 50% reduction in nephron number and oligosyndactyly (the Os mutation). 11 ROP Os/+ mice had glomerular hypertrophy and glomerulosclerosis at age 3 months with an increase in both cell turnover rate and extracellular matrix (ECM) synthesis. 12 In contrast, C57 Os/+ mice developed only minimal glomerulosclerosis, despite an identical reduction in nephron number and an equal increase in both glomerular size and glomerular cell-labeling index. 11 These data suggested that whereas hypertrophy and increased cell turnover were common responses to congenital nephron reduction, the development of glomerulosclerosis was largely dependent upon the genetic background. In the current study, we asked whether nephrectomy in adulthood induced an equal sclerotic response in ROP and C57 mice, whether the sclerotic response in ROP mice to nephron reduction in adults resembled that in utero, if the lack of a sclerotic response in C57 mice was because the threshold for sclerosis-induction had not been reached in our previous experiments, and if there was a relationship between glomerular hypertrophy and glomerulosclerosis.
Materials and Methods
Experimental Design
Female ROP Os/+ (ROP/Le-Os Es1b/+ Es1a), ROP +/+, C57 Os/+ (C57BL/6J-Os +/+ Cchalatg-la) and C57 +/+ mice were obtained from Jackson Laboratories (Bar Harbor, Maine). ROP +/+ and C57 +/+ littermates served as controls for ROP Os/+ and C57 Os/+ mice. The left kidney was removed at age 10 weeks in each group as described. 13 Control mice matched for age, sex, and strain were sham operated. Nephrectomized (NX) and sham-operated mice were fed standard diet throughout the experimental period. Each group consisted of six animals, and they were sacrificed according to NIH approved procedures either 2 weeks or 8 weeks after NX, at which time they were 12 weeks or 18 weeks old. After removing one pole for light microscopy, the remainder of the solitary kidney was perfused with a buffer containing 0.1% collagenase and RNase inhibitors for glomerular microdissection and molecular analysis as described previously. 14
Light Microscopy
Kidney sections were fixed in Carnoy’s fixative, embedded in glycol methacrylate, cut at a thickness of 2 μm and stained with hematoxylin/eosin (H&E) and periodic acid-Schiff (PAS). One investigator examined the sections without knowledge of the experimental groups to eliminate experimental bias. Mesangial sclerosis was graded using a scale from 0 to 4+ as described previously. 10 Forty glomeruli per section were examined in six mice from each group, and the mean of scores for individual glomeruli was recorded. Arteries were examined, and the number affected was expressed as a percent of the total. The interstitial changes were mild and not quantitated.
Light Microscopic Morphometry
Glomerular volume was assessed by examining plastic-embedded sections using a digitizing tablet and video camera, as described previously. 15 The mean glomerular volume was derived from the harmonic mean of the glomerular equatorial surface area.
Glomerular Cell Number and Turnover (18-Week Mice Only)
The nuclei of 50 consecutive glomerular profiles were counted by scanning H&E-stained tissue sections in a serpentine fashion. The relative glomerular cell number was calculated as described previously. 15 The labeling index was determined using [3H]thymidine incorporation and autoradiography. A cell was considered labeled when the number of grains per nucleus exceeded 3 to 4. The glomerular-labeling index was calculated by counting 50 successive glomeruli per section and expressed as the percentage of labeled cells (excluding Bowman’s capsular cells) divided by the total glomerular cell number.
Isolation of Glomeruli and Reverse Transcription in Situ
Glomeruli were isolated by microdissection at 4°C in a solution containing RNase inhibitors. 14 After sonication, cDNA was obtained by in situ reverse transcription.
Competitive Polymerase Chain Reaction (PCR)
The primers for mouse α1 type IV collagen, laminin β1, tenascin, β-actin, and 72 kd collagenase were previously described. 14,16 The expected PCR products were 484 bp for α1 type IV collagen, 443 bp for laminin β1, 460 bp for β-actin, 701 bp for 72 kd collagenase, and 548 bp for tenascin. Decreasing amounts of mutant template competed for specific primers with a fixed amount of the test glomerular cDNA during PCR amplification. The ratio of mutant to cDNA band density was calculated by laser densitometry and plotted as a function of the initial amount of mutant template added to the reaction. The amount of glomerular cDNA was derived from linear regression analysis. Duplicate or triplicate assays were performed. The mean values obtained for all mice were expressed as attomol ×10−4/glomerulus. All reverse transcription (RT)-PCR data were normalized to β-actin and the results expressed as ratios.
Statistical Analysis
All values were expressed as mean ± SD. The two-tailed unpaired Student’s t-test was used to evaluate differences between means for corresponding sets of data obtained from oligosyndactyly (Os) and control mice. As level of significance P < 0.05 was chosen.
Results
Body Weight and Glomerular Volume (Table 1) ▶
Table 1.
Body Weight and Glomerular Volume
| Age | ROP +/+ | C57 +/+ | ROP Os/+ | C57 Os/+ | |
|---|---|---|---|---|---|
| 12 weeks (2 weeks after NX) | |||||
| Body weight (g) | Sham | 19.9 ± 1.2 | 19.7 ± 0.4 | 20.6 ± 0.97 | 18.9 ± 2.1 |
| NX | 19.9 ± 1.6 | 19.1 ± 0.7 | 18.8 ± 0.8 | 18.0 ± 1.1 | |
| GV (×105 μm3) | Sham | 2.19 ± 0.35 | 2.01 ± 0.34 | 4.31 ± 0.26† | 4.02 ± 0.81† |
| NX | 2.83 ± 0.6* | 2.85 ± 0.3* | 4.32 ± 0.76† | 4.34 ± 0.28† | |
| 18 weeks (8 weeks after NX) | |||||
| Body weight (g) | Sham | 20.3 ± 1.3 | 21.3 ± 0.89 | 22.3 ± 1.7 | 22.9 ± 1.6 |
| NX | 21.9 ± 1.8 | 22.4 ± 0.94 | 23.1 ± 1.1 | 23.5 ± 1.3 | |
| GV (×105 μm3) | Sham | 2.54 ± 0.34 | 2.17 ± 0.29 | 6.20 ± 0.81† | 6.75 ± 0.72† |
| NX | 3.75 ± 0.3* | 2.82 ± 0.5* | 9.5 ± 1.4*†‡ | 7.15 ± 0.83*† |
Body weight was measured before sacrifice. Glomerular volume was measured as described. There were six experimental mice in each group.
*P < 0.05, nephrectomized mice versus sham controls.
†P < 0.01, C57 Os/+ sham versus C57 +/+ sham (either at 2 weeks and at 2 months), C57 Os/+ NX versus C57 +/+ NX (either at 2 weeks and at 2 months), ROP Os/+ sham versus ROP +/+ sham (either at 2 weeks and at 2 months), ROP Os/+ NX versus ROP +/+ NX (either at 2 weeks and at 2 months).
‡P < 0.01, ROP Os/+ NX versus C57 Os/+ NX.
Body weight did not differ between nephrectomized and sham-operated mice at either 2 weeks or 8 weeks post-NX. There was a significant increase (30 to 40%) in glomerular volume in ROP +/+ and C57 +/+ mice 2 weeks and 8 weeks post-NX (P < 0.01). There was no change in glomerular volume 2 weeks post-NX in either ROP Os/+ or C57 Os/+ mice. Whereas there was an increase in glomerular volume in ROP Os/+ mice (54%) 8 weeks post-NX, there were no differences between sham and NX C57 Os/+ mice 8 weeks post-NX.
Light Microscopy (Table 2) ▶
Table 2.
Histological Score
| Age | ROP +/+ | C57 +/+ | ROP Os/+ | C57 Os/+ | |
|---|---|---|---|---|---|
| 12 weeks (2 weeks after NX) | |||||
| Glomeruli | Sham | 0.6 ± 0.3 | 0.35 ± 0.2 | 2.23 ± 0.26† | 1.2 ± 0.5‡ |
| NX | 0.64 ± 0.2 | 0.33 ± 0.1 | 2.80 ± 0.6† | 1.2 ± 0.5‡ | |
| Blood vessels | Sham | 0.15 ± 0.1 | 0.08 ± 0.1 | 0.32 ± 0.2 | 0.25 ± 0.08 |
| NX | 0.13 ± 0.11 | 0.12 ± 0.11 | 0.25 ± 0.18 | 0.21 ± 0.12 | |
| Interstitium | Sham | 0.15 ± 0.1 | 0.17 ± 0.2 | 0.31 ± 0.2 | 0.2 ± 0.18 |
| NX | 0.16 ± 0.1 | 0.2 ± 0.1 | 0.24 ± 0.08 | 0.3 ± 0.2 | |
| 18 weeks (8 weeks after NX) | |||||
| Glomeruli | Sham | 0.85 ± 0.2 | 0.35 ± 0.2 | 2.7 ± 0.2* | 1.2 ± 0.5‡ |
| NX | 0.9 ± 0.15 | 0.33 ± 0.1 | 3.75 ± 0.1† | 1.32 ± 0.6‡ | |
| Blood vessels | Sham | 0.2 ± 0.09 | 0.18 ± 0.1 | 1.1 ± 0.3† | 0.29 ± 0.18 |
| NX | 0.19 ± 0.13 | 0.13 ± 0.1 | 1.2 ± 0.25† | 0.34 ± 0.16 | |
| Interstitium | Sham | 0.16 ± 0.17 | 0.16 ± 0.1 | 0.35 ± 0.2 | 0.2 ± 0.18 |
| NX | 0.17 ± 0.15 | 0.21 ± 0.15 | 0.31 ± 0.16 | 0.3 ± 0.2 |
Glomerular, vascular, and tubulointerstitial lesions were graded on a scale from 0 to 4 according to the extent of the involvement. Six mice were studied for each group.
*P < 0.001, ROP Os/+ 2 months sham versus ROP +/+ 2 months NX.
†P < 0.001, ROP Os/+ 2 weeks sham versus C57 Os/+ 2 weeks sham, ROP Os/+ 2 weeks NX versus C57 Os/+ 2 weeks NX. ROP Os/+ 2 months sham versus C57 Os/+ 2 months sham, ROP Os/+ 2 months NX versus C57 Os/+ 2 months NX.
‡P < 0.05, C57 Os/+ sham and C57 Os/+ NX versus C57 +/+ sham and C57 +/+ NX respectively.
C57 +/+ Mice
There were no glomerular, tubulointerstitial, or vascular changes in sham or nephrectomized mice except for the increase in size in the NX group.
ROP +/+ Mice
Sham operated mice had a slight increase in the amount of PAS-stained material in the mesangial areas of 50% of glomeruli, which was most noticeable in the vicinity of the vascular pole 8 weeks post-NX (score: 0.6 ± 0.4). Two weeks after nephrectomy, the mesangial sclerosis was unchanged in ROP +/+ mice. Eight weeks post-NX, the mesangial matrix score was 0.9 ± 0.15. The sclerotic glomeruli were found distributed throughout the cortex. There were no tubulointerstitial or vascular lesions (Figure 1) ▶ .
Figure 1.

Light microscopy. Methacrylate-embedded sections were stained by periodic acid-Schiff methenamine (×400). Sections of C57 +/+ and ROP +/+ mice sacrificed 2 months after NX are shown.
C57 Os/+ Mice
As reported previously, there was a minimal increase in the mesangial matrix in sham-operated mice (score: 1.2 ± 0.5), similar to values found in non-nephrectomized control mice. 11 There was no significant change in mice post-NX (score: 1.3 ± 0.6).
ROP Os/+ Mice
Twelve- and 18-week-old sham-operated ROP Os/+ mice had glomerular lesions (score 2.23 ± 0.26 and 2.7 ± 0.2, respectively), similar to nonoperated mice previously described. 12 At 8 weeks post-NX most glomeruli exhibited increased mesangial sclerosis. In the more severely affected glomeruli there was a marked decrease in the patency of the vascular loops, apparently caused by the presence of large subendothelial masses of hyalin material (score: 3.75 ± 0.1). A small number of arterioles showed smooth muscle and intimal cell proliferation with reduction of the lumen. There were no tubulointerstitial lesions (Figure 2) ▶ .
Figure 2.
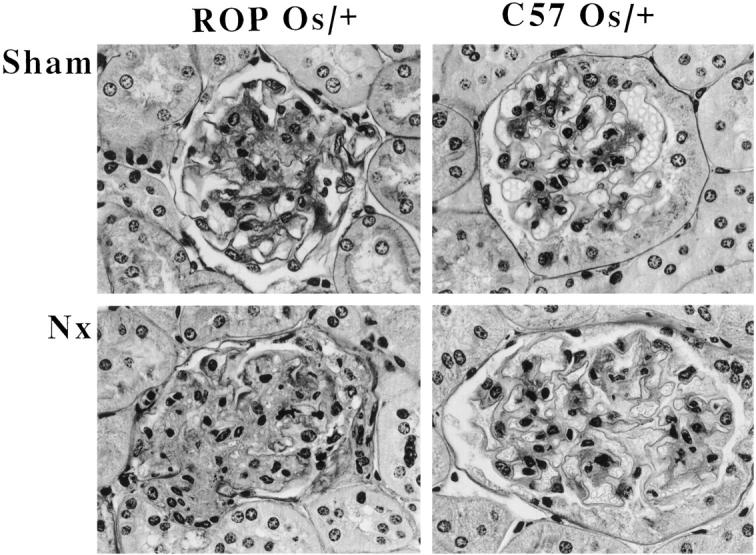
Light microscopy. Methacrylate-embedded sections were stained by periodic acid-Schiff methenamine (×400). Sections of C57 Os/+ and ROP Os/+ mice sacrificed 2 months after NX are shown.
Glomerular Cell Number and Turnover
Glomerular cell number and labeling index were determined 8 weeks post-NX (Table 3) ▶ .
Table 3.
Glomerular Cell Number and Labeling Index
| Age: 18 weeks (8 weeks after NX) | ROP +/+ | C57 +/+ | ROP Os/+ | C57 Os/+ | |
|---|---|---|---|---|---|
| Cells/50 glomeruli | Sham | 2429 ± 181 | 2599 ± 319 | 3276 ± 411† | 3139 ± 400 |
| NX | 2396 ± 223 | 2379 ± 123 | 3132 ± 146† | 3403 ± 101† | |
| Labeled cells (%) | Sham | 0.26 ± 0.06 | 0.29 ± 0.03 | 0.78 ± 0.25† | 0.76 ± 0.28† |
| NX | 0.64 ± 0.1* | 0.54 ± 0.1* | 0.84 ± 0.18 | 0.80 ± 0.05 |
Glomerular cell number and labeling index were measured as described. Data are means of six experimental mice per group.
*P < 0.001; ROP +/+ NX and C57 +/+ NX versus sham-operated littermates.
†P < 0.001; ROP Os/+ NX versus ROP +/+ NX, ROP Os/+ sham versus ROP +/+ sham, C57 Os/+ NX versus C57 +/+ NX, C57 Os/+ sham versus C57 +/+ sham.
ROP +/+ and C57 +/+ Mice
There was no change in the mean cell number per glomerulus between nephrectomized and sham-operated mice, despite an increase in glomerular volume in both groups of mice. Approximately 30% of the labeled cells were situated on the external surface of the glomerular tufts. It was not possible to differentiate between mesangial and endothelial cell labeling within the tufts.
ROP Os/+ and C57 Os/+ Mice
Sham-operated ROP Os/+ and C57 Os/+ mice had a higher labeling index than ROP +/+ and C57 +/+ mice. As noted above, approximately 30% of the labeled cells were situated on the external surface of the glomerular tufts. There was no increase in the labeling index post-NX in either ROP Os/+ or C57 Os/+ mice.
While there was an increased number of cells in the enlarged glomeruli of both ROP Os/+ and C57 Os/+ mice compared with littermates without the Os gene, no further increase was found post-NX. Glomerular cell number did not change in ROP Os/+ mice post-NX, despite a further increase in glomerular volume (Table 1) ▶ .
Glomerular mRNA Levels
Glomerular α1 IV collagen, laminin β1, tenascin, and 72 kd collagenase mRNAs, measured by competitive PCR, were normalized to β-actin mRNA levels (Table 4) ▶ .
Table 4.
Glomerular mRNA Levels (Competitive PCR)
| Age | ROP +/+ | C57 +/+ | ROP Os/+ | C57 Os/+ | |
|---|---|---|---|---|---|
| 12 weeks (2 weeks after NX) | |||||
| α1-IV collagen | Sham | 0.61 ± 0.16 | 0.66 ± 0.30 | 1.38 ± 0.27 | 0.87 ± 0.17 |
| NX | 1.13 ± 0.3* | 0.84 ± 0.1* | 1.29 ± 0.21 | 1.02 ± 0.10 | |
| Laminin β1 | Sham | 0.19 ± 0.17 | 0.10 ± 0.04 | 0.26 ± 0.08† | 0.13 ± 0.04 |
| NX | 0.23 ± 0.07 | 0.12 ± 0.04 | 0.26 ± 0.05† | 0.12 ± 0.03 | |
| Tenascin | Sham | 1.00 ± 0.10 | 1.75 ± 0.44 | 2.38 ± 0.3†‡§ | 1.80 ± 0.23 |
| NX | 1.25 ± 0.20 | 1.48 ± 0.26 | 2.88 ± 0.56‡ | 2.27 ± 0.30 | |
| 72 kd collagenase | Sham | 0.44 ± 0.19 | 0.56 ± 0.16 | 0.60 ± 0.23 | 0.71 ± 0.14 |
| NX | 0.45 ± 0.12 | 0.47 ± 0.13 | 0.77 ± 0.22 | 0.63 ± 0.17 | |
| 18 weeks (8 weeks after NX) | |||||
| α1 IV collagen | Sham | 0.66 ± 0.08 | 0.51 ± 0.160 | 1.23 ± 0.1†‡ | 0.78 ± 0.20 |
| NX | 1.2 ± 0.14* | 0.80 ± 0.16* | 2.17 ± 0.4*‡ | 0.97 ± 0.13 | |
| Laminin β1 | Sham | 0.21 ± 0.02 | 0.13 ± 0.03 | 0.29 ± 0.07 | 0.19 ± 0.04 |
| NX | 0.28 ± 0.07 | 0.16 ± 0.06 | 0.58 ± 0.1*†‡ | 0.25 ± 0.07 | |
| Tenascin | Sham | 1.40 ± 0.05 | 1.81 ± 0.45 | 1.88 ± 0.25‡ | 1.87 ± 0.15 |
| NX | 1.52 ± 0.23 | 1.42 ± 0.22 | 3.02 ± 0.1*†‡ | 2.01 ± 0.26‡ | |
| 72 kd collagenase | Sham | 0.35 ± 0.03 | 0.35 ± 0.09 | 0.59 ± 0.09‡ | 0.61 ± 0.16‡ |
| NX | 0.54 ± 0.1* | 0.52 ± 0.1* | 0.75 ± 0.16‡ | 0.90 ± 0.15‡ |
Competitive PCR was performed as described. The means of six experimental mice for each group are shown. Data represent means of the ratio of the indicated molecule to β-actin.
*P < 0.05; when NX mice were compared with sham control mice and when ROP +/+ NX mice were compared with C57 +/+ NX mice at 2 months.
†P < 0.05; ROP Os/+ 2 weeks sham versus C57 Os/+ 2 weeks sham, ROP Os/+ 2 weeks NX versus C57 Os/+ 2 weeks NX, ROP Os/+ 2 months sham versus C57 Os/+ 2 months sham, ROP Os/+ 2 months NX versus C57 Os/+ 2 months NX.
‡P < 0.05; when ROP Os/+ and C57 Os/+ mice were compared with ROP +/+ and C57 +/+, respectively.
§P < ROP Os/+ 2 weeks sham versus ROP +/+ 2 weeks NX.
ROP +/+ and C57 +/+ Mice
There was a significant increase in α1 IV collagen mRNA at both 2 and 8 weeks post-NX in ROP +/+ and C57 +/+ mice. The levels were higher in ROP +/+ than in C57 +/+ mice at 8 weeks post-NX (P < 0.05). There was no significant change observed in laminin β1 and tenascin mRNA levels at either 2 or 8 weeks post-NX. There was a significant increase in 72 kd collagenase mRNA levels 8 weeks post-NX in both groups of mice.
ROP Os/+ and C57 Os/+ Mice
The levels of α1 IV collagen mRNA were higher in both groups of mice compared with their non-Os littermates, as we had previously found. 11 In addition, the laminin β1 and tenascin mRNA levels were higher in ROP Os/+ compared with ROP +/+ mice, as shown previously. 12 There was a significant increase in α1 IV collagen, laminin, and tenascin mRNAs in ROP Os/+ mice but not in C57 Os/+ mice 8 weeks post-NX. 72 kd collagenase mRNA levels were slightly but significantly increased in both ROP Os/+ and C57 Os/+ mice at 8 weeks post-NX.
Discussion
We previously studied mice with a mutation (Os) causing a 50% reduction in nephron number during development and showed that glomerulosclerosis occurred in sclerosis-prone mice (ROP +/+), but not in sclerosis-resistant mice (C57). 11 In the current study we show that when a 50% reduction in nephron number was induced by uninephrectomy in adult mice, glomerulosclerosis occurred only in the sclerosis-prone mouse strain. This finding was independent of the presence of the Os gene. Interestingly, ROP Os/+ mice had more severe lesions than ROP +/+ mice, which had been nephrectomized as adults, despite the fact that both had a 50% reduction in nephron number. The cause of this difference is not known, but it has been previously found that the response to nephrectomy is age dependent. 17 The fact that glomerulosclerosis was found only in the sclerosis-prone strain carrying the Os gene, provided evidence that this mutation was not directly associated with the sclerotic lesions.
We found that the lack of a sclerotic response in the resistant strain (C57) was not a threshold effect, because even a 75% reduction in nephron number did not induce sclerosis. Although nephrectomy did not induce significant sclerosis in C57 mice at either the histological or ECM mRNA levels, glomerular volume and labeling index were both increased. Thus, cell turnover, glomerular hypertrophy, and the accumulation of ECM were not tightly linked. This is consistent with our previous in vivo and in vitro data and that of others. 11,18,19 There was an increase in α1 IV collagen mRNA in both C57 +/+ and ROP +/+ mice at both 2 and 10 weeks NX, the increase being higher in the ROP +/+ mice at 10 weeks.
Glomerular hypertrophy has been proposed to be an important factor in the development of glomerulosclerosis in rats and mice. 9,13,20,21 In mice transgenic for bovine growth hormone (bGH) we found that glomerular size was greater than expected for body size and that it continued to increase as glomerulosclerosis progressed. 22,23 These mice die in renal failure. 22 In the current study we found that glomerular hypertrophy occurred in both sclerosis-prone and sclerosis-resistant mice. However, there was a sharp difference between the two strains in the degree of hypertrophy ultimately attained. Whereas glomerular size increased by approximately 50% in nephrectomized adult C57 +/+ mice, nephrectomy of littermate C57 Os/+ mice resulted in no further increase in glomerular size even though there was a 75% decrease in nephron number. However, there was a substantial increase in glomerular size in ROP Os/+ mice after adult nephrectomy. This relationship between continuously increasing glomerular size and glomerulosclerosis is in agreement with our observations in mice transgenic for bGH. The data from these two animal models suggest that glomerular size does not exceed a certain size in sclerosis-resistant mice following nephron reduction. However, in sclerosis-prone mice glomerular size continues to increase as nephron number decreases, and this is associated with the development of progressive glomerulosclerosis. It is not possible, at present, to determine whether there is a causal link between the progressive glomerular lesion and the lack of a plateau in glomerular size in sclerosis-prone mice. A similar relationship between glomerular size and susceptibility to glomerulosclerosis was noted in diabetic mice following the induction of hyperglycemia. 24
There was an increase in α1 IV collagen mRNA in both ROP +/+ (1.8 fold) and C57 +/+ (1.6 fold) mice (P < 0.05) 8 weeks after nephrectomy, and the levels were higher in ROP +/+ mice. The 72-kd collagenase mRNA levels were similar in sham-operated ROP +/+ and C57 +/+ mice. Although the levels were increased 8 weeks post-NX, they were not significantly different from one another. There was a further increase in α1 IV collagen, laminin β1, and tenascin mRNA levels in ROP Os/+ mice 8 weeks after NX but not in C57 Os/+ mice. There was an increase in 72-kd collagenase mRNA levels of similar magnitude in both ROP Os/+ mice and C57 Os/+ mice 8 weeks after nephrectomy. These data show that there was an increase in the synthesis of several matrix components in the NX ROP Os/+ mice, relative to the other groups. Furthermore, the changes in 72-kd collagenase mRNA levels were parallel in all groups, providing evidence that the cause of the glomerulosclerosis could have been a relative imbalance in matrix turnover, favoring deposition.
Genetic factors have been reported to be important in determining the response to adult nephrectomy. Dahl salt sensitive rats with 5/6 renal ablation had significantly more severe hypertension and focal glomerulosclerosis than salt-resistant rats.25 Male Wistar rats and several other rat strains developed glomerulosclerosis after adult uninephrectomy, 19 whereas male PVG/c rats did not. 8
In summary, these data show that nephrectomy in adulthood resulted in a sclerotic response only in a susceptible mouse strain and that in this strain, a 50% reduction in nephron number during development resulted in more prominent glomerulosclerosis than did an equal reduction occurring during adulthood. The data also show that a 75% reduction in nephron number in the sclerosis-resistant strain did not induce sclerosis, suggesting that the different responses between the two strains was not simply a difference in a threshold. Finally, the data show that glomerular hypertrophy in response to nephron reduction in the sclerosis-resistant strain was limited, reaching a plateau at a 50% reduction in number. However, glomerular size continued to increase in the sclerosis-prone strain as nephron number decreased.
Footnotes
Address reprint requests to Dr. Liliane J. Striker, Renal Cell Biology Laboratory, Department of Medicine, University of Miami, P.O. Box 016960 (R126), Miami, FL 33101.
C. Esposito and C-J. He contributed equally to this work.
References
- 1.Bay WH, Hebert LA: The living donor in kidney transplantation. Ann Int Med 1987, 106:719-727 [DOI] [PubMed] [Google Scholar]
- 2.Kasiske BL, Ma JZ, Louis TA, Swan SK: Long-term effects of reduced renal mass in humans. Kidney Int 1995, 48:814-819 [DOI] [PubMed] [Google Scholar]
- 3.Narkun-Burgess DM, Nolan CR, Norman JE, Page WF, Miller PL, Meyer TW: Forty-five year follow-up after uninephrectomy. Kidney Int 1993, 43:1110-1115 [DOI] [PubMed] [Google Scholar]
- 4.Liu PL, Gallery ED, Mahony JF, Gyory AZ: Renal function in unilateral nephrectomy subjects. J Urol 1992, 147:337-339 [DOI] [PubMed] [Google Scholar]
- 5.Lent V, Harth J: Nephropathy in remnant kidneys: pathological proteinuria after unilateral nephrectomy. J Urol 1994, 152:312-316 [DOI] [PubMed] [Google Scholar]
- 6.Ladefoged J: Renal failure 22 years after kidney donation. Lancet 1992, 339:124-125 [DOI] [PubMed] [Google Scholar]
- 7.Brown DM, Provoost AP, Daly MJ, Lander ES, Jacob HJ: Renal disease susceptibility and hypertension are under independent genetic control in the fawn-hooded rat. Nat Genet 1996, 12:44-51 [DOI] [PubMed] [Google Scholar]
- 8.Ohishi A, Suzuki H, Nakamoto H, Katzumata H, Ayashi K, Riuzaki M, Kumagai K, Furukawa T, Ichihara A, Saruta T, Higashi F, Marumo K: Status of patients who underwent uninephrectomy in adulthood more than 20 years ago. Am J Kidney Dis 1995, 26:889-897 [DOI] [PubMed] [Google Scholar]
- 9.Grond J, Beukers JY, Schilthuis MS, Weening JJ, Elema JD: Analysis of renal structural and functional features in two rat strains with a different susceptibility to glomerular sclerosis. Lab Invest 1986, 54:77-83 [PubMed] [Google Scholar]
- 10.Bidani AK, Griffin KA, Plott W, Schwartz MM: Genetic predisposition to hypertension and microvascular injury in the remnant kidney model. J Lab Clin Med 1993, 121:284-291 [PubMed] [Google Scholar]
- 11.He CJ, Esposito C, Phillips C, Zalups KR, Henderson DA, Striker GE, Striker LJ: Dissociation of glomerular hypertrophy, cell proliferation, and glomerulosclerosis in mouse strain heterozygous for a mutation (Os) which induces a 50% reduction in nephron number. J Clin Invest 1996, 97:1242-1249 [DOI] [PMC free article] [PubMed] [Google Scholar]
- 12.He CJ, Zalups RK, Henderson DA, Striker GE, Striker LJ: Molecular analysis of spontaneous glomerulosclerosis in Os/+ mice, a model with reduced nephron mass. Am J Physiol 1995, 269:F266-F273 [DOI] [PubMed] [Google Scholar]
- 13.MacKay K, Striker LJ, Stauffer JW, Agodoa LY, Striker GE: Relationship of glomerular hypertrophy and sclerosis: studies in SV40 transgenic mice. Kidney Int 1990, 37:741-748 [DOI] [PubMed] [Google Scholar]
- 14.Peten EP, Garcia-Perez A, Terada Y, Woodrow D, Martin BM, Striker GE, Striker LJ: Age-related changes in a1- and a2-chain type IV collagen mRNAs in adult mouse glomeruli: competitive PCR. Am J Physiol 1992, 263:F951-F957 [DOI] [PubMed] [Google Scholar]
- 15.Pesce CM, Striker LJ, Peten E, Elliot SJ, Striker GE: Glomerulosclerosis at both early and late stages is associated with increased cell turnover in mice transgenic for growth hormone. Lab Invest 1991, 65:601-605 [PubMed] [Google Scholar]
- 16.Yang CW, Hattori M, Vlassara H, He CJ, Carome MA, Yamato E, Elliot S, Striker GE, Striker LJ: Overexpression of TGF-β1 mRNA is associated with upregulation of glomerular tenascin and laminin gene expression in diabetic NOD mice. J Am Soc Nephrol 1995, 5:1610-1617 [DOI] [PubMed] [Google Scholar]
- 17.O’Donnell MP, Kasiske BL, Raij L, Keane WF: Age is a determinant of the glomerular morphologic and functional responses to chronic nephron loss. J Lab Clin Med 1985, 106:308-313 [PubMed] [Google Scholar]
- 18.He CJ, Striker LJ, Tsokos M, Yang CW, Peten EP, Striker GE: Relationship between mesangial cell proliferation and types I and IV collagen mRNA levels in vitro. Am J Physiol 1995, 269:C554-C562 [DOI] [PubMed] [Google Scholar]
- 19.Floege J, Alpers CE, Burns MW, Pritzl P, Gordon K, Couser WG, Johnson RJ: Glomerular cells, extracellular matrix accumulation, and the development of glomerulosclerosis in the remnant kidney model. Lab Invest 1992, 66:485-497 [PubMed] [Google Scholar]
- 20.Brenner BM: Nephron adaptation to renal injury or ablation. Am J Physiol 1995, 249:F324-F337 [DOI] [PubMed] [Google Scholar]
- 21.Feld LG, Van Liew JB, Galaske RG, Boylan JW: Selectivity of renal injury and proteinuria in the spontaneously hypertensive rat. Kidney Int 1977, 12:332-343 [DOI] [PubMed] [Google Scholar]
- 22.Doi T, Striker LJ, Gibson CC, Agodoa LY, Brinster RL, Striker GE: Glomerular lesions in mice transgenic for growth hormone and insulin-like growth factor-1. Am J Pathol 1990, 137:541-552 [PMC free article] [PubMed] [Google Scholar]
- 23.Yang CW, Striker GE, Chen WY, Kopchick JJ, Striker LJ: Differential expression of glomerular extracellular matrix and growth factor mRNA in rapid and slowly progressive glomerulosclerosis: studies in mice transgenic for native or mutated growth hormone. Lab Invest 1997, 76:467-476 [PubMed] [Google Scholar]
- 24.Zheng F, Striker GE, Esposito C, Lupia E, Striker LJ: Strain differences rather than hyperglycemia determine the severity of glomerulosclerosis in mice. Kidney Int 1998, 54:1999-2007 [DOI] [PubMed] [Google Scholar]