

Abstract
Acid α-glucosidase (GAA) cleaves the α1-4 and α1-6 glycosidic linkages of glycogen and related α-glucosyl substrates within lysosomes. Its deficiency results in glycogen storage disease type II (GSDII) variants including Pompe disease. To gain insight into the tissue patterns of involvement by glycogen storage in GSDII, GAA mRNA expression in mouse tissues was evaluated by Northern blot and in situ hybridization analyses. Extensive temporal and spatial variation of GAA mRNA was observed. During preterm maturation, GAA mRNA levels of whole mice progressively increased as assessed by Northern analysis. By in situ hybridization with GAA antisense mRNA, low signals were detected in most tissues throughout gestation. However, increased expression in specific cell types of different tissues was observed beginning at 16 days post coitum in developing brain neurons, primitive inner ear cells, and seminiferous tubular epithelium. In adult mice, whole-organ GAA mRNA levels were highest in brain, moderate in heart, liver, and skeletal muscle, and lowest in the series kidney > lung > testis > spleen. By in situ hybridization, the highest-intensity signals were in neurons of the central and peripheral nervous systems whereas neuroglial cells had only low-level signal. Signals of moderate intensity were in cardiomyocytes whereas low signals were in hepatocytes and skeletal muscle myocytes and very low in cells of the lungs, thymus, pancreas, spleen, and adrenal glands. However, testicular Sertoli cells and kidney tubular epithelial cells had significant signals even though surrounding cells had very low signals. The discrete temporal and spatial variations of GAA mRNA during development indicate different physiological roles for this enzyme in various cell types and developmental stages.
Acid α-glucosidase or acid maltase (GAA; EC 3.2.1.3) is an essential lysosomal enzyme that cleaves α1-4 and α1-6 glycosidic bonds of glycogen, maltose, and intermediate oligosaccharides yielding glucose. 1,2 Recessively inherited GAA deficiencies lead to glycogen storage disease type II (GSDII) variants that are characterized by lysosomal glycogen accumulation in many tissues (reviewed in Ref. 3 ). The GSDII clinical variants differ in age of onset, tissue involvement, and severity. In the fatal infantile variant, Pompe disease, progressive massive glycogen accumulation is predominant in heart, skeletal muscle, and liver and leads to death from cardiorespiratory failure by 1 or 2 years of age 1 (reviewed in Ref. 3 ). Glycogen accumulation occurs in neurons and glial cells of the central nervous system (CNS) and Schwann cells of the peripheral nervous system (PNS) of the patients. 4-8 These pathological findings have not been emphasized recently but suggest a neural component to the Pompe disease pathogenesis. Later-onset forms of the disease are clinically heterogeneous and present as muscular dystrophies primarily affecting skeletal muscles. 1,3,9,10 In these cases, the slower progressive glycogen accumulation leads to a limb-girdle-like myopathy with minor cardiac involvement. Frequently, death results from respiratory failure. Although the pathophysiological bases of these diseases are not well understood, most signs and symptoms have been attributed to primary muscle deterioration and dysfunction related to glycogen accumulation.
The human GAA gene maps to chromosome 17q25, 11 spans ∼20 kb, and has 20 exons. 12 Characterization of its promoter region revealed characteristics of a housekeeping gene. 13,14 The human cDNA, ∼3.4 kb in length, encodes a 952-amino-acid polypeptide. 13,15,16 A high degree of conservation between mouse and human cDNAs is evidenced by a 75% nucleotide identity and 79% identity of their predicted amino acid sequences. Numerous mutations of the GAA gene have been described, and many result in absent or abnormal mRNAs. 17-19 In general, correlation exists between residual levels of enzyme activity and phenotype. 3 Infantile-onset variants of GSDII have low to undetectable enzyme activity levels in skeletal muscle and cultured skin fibroblasts, whereas in later-onset variants these are higher.
GAA enzyme activity levels vary among tissues and throughout development. 5,20-24 In human fetuses, GAA activity peaks toward the end of gestation in many tissues (liver and kidney > skeletal muscle and lung > spleen and heart). 22 The brain has the lowest enzyme activity and this remains relatively constant throughout prenatal development. In adult humans, the highest GAA activities are in the kidney and prostate. 20 Relative to kidney GAA activity, that in liver, spleen, and adrenal glands is ∼10% to 30%, and that in skin, skeletal muscle, and heart is ∼2% to 5%. From pathological studies in Pompe disease patients, the greatest glycogen storage is present in liver, spleen, and adrenals that also have low enzyme activity. 22 In mice, the highest GAA activity levels are in intestine, brain, liver, kidney, and testis with only ∼10% to 20% of these levels present in lungs and cardiac and skeletal muscle and intermediate levels in the thymus. 21,24 To date, GAA knockout mouse models have variably mild phenotypes, but glycogen storage is predominant in skeletal and cardiac muscle. 24,25
To gain insight into the physiological role of GAA, tissue-specific pathology in GSDII deficiency, and pathogenesis of the disease, the GAA mRNA expression was characterized in murine tissues and cells. These studies show discrete temporal and cellular specific GAA mRNA expression in regions of the CNS and some non-neural tissues.
Materials and Methods
Northern Blot Analysis
A 1.36-kb 32P-labeled mouse GAA cDNA fragment (nucleotides 634 to 1997 from the ATG) was hybridized to BALB/c adult mice poly A+ RNA (2 μg) from a variety of tissues (Clontech Laboratories, Palo Alto, CA). Hybridization with a human β-actin cDNA probe was used for RNA quality control. Quantitation of probe binding was by scanning densitometry of autoradiograms of 24 hours of exposure (LKB, Pharmacia, Uppsala, Sweden).
In Situ Hybridization Analysis
Mouse GAA 35S-labeled sense and antisense riboprobes were synthesized by in vitro transcription 26 from linearized templates containing ∼1 kb (nucleotides 634 to 1635 from the ATG). In situ hybridization of B6C3F1/J (C57BL/6J × C3H/HeJ) mouse tissues (Harland Animal, Indianapolis, IN) was performed essentially as described. 26 Briefly, cryosections of 4% paraformaldehyde-fixed and embedded tissues were post-fixed and prepared for in situ hybridization as described. 26 The sections were first hybridized with [35S]UTP-labeled 1-kb sense or antisense GAA riboprobes under high-stringency conditions in a mixture containing 50% formamide. Hybridization was followed by ribonuclease A/T1 digestion and washes under progressively higher-stringency conditions, including 0.1× SSC at 55°C. This was followed by dehydration in graded ethanol solutions, dipping in Kodak NTB2 emulsion, and exposure at 4°C for 10 to 15 days. Slides were developed and stained with hematoxylin and eosin (H&E). Positive signal, obtained with the antisense probe, appears as white or light pink grains under dark-field microscopy. Duplicate sections hybridized with the sense probe were used as negative controls.
Results
Expression Studies in Adult Mouse Tissues
Differential expression of GAA mRNA was observed by Northern blot analysis and in situ hybridization. Multiple Northern blots with mRNA from whole tissues showed a single 3.8-kb GAA band with the highest levels in the brain (100%), intermediate levels in skeletal muscle, liver, and heart (50% to 35%), and low to very low levels in lung and kidney (15%) (Figure 1A) ▶ . In spleen and testis (3% to 1.6%), 10 times longer exposures were required to develop signals of similar intensity to those of lung and kidney (not shown). Rehybridization of this membrane to a cDNA β-actin probe verified integrity of the mRNA samples. The characteristic β-actin 2.0-kb band was present in all tissues at relatively high levels (Figure 1B) ▶ . Faster migrating bands of ∼1.8 kb, prominent in heart and skeletal muscle, are due to hybridization of the probe to the α or γ forms of actin (Figure 1B) ▶ .
Figure 1.
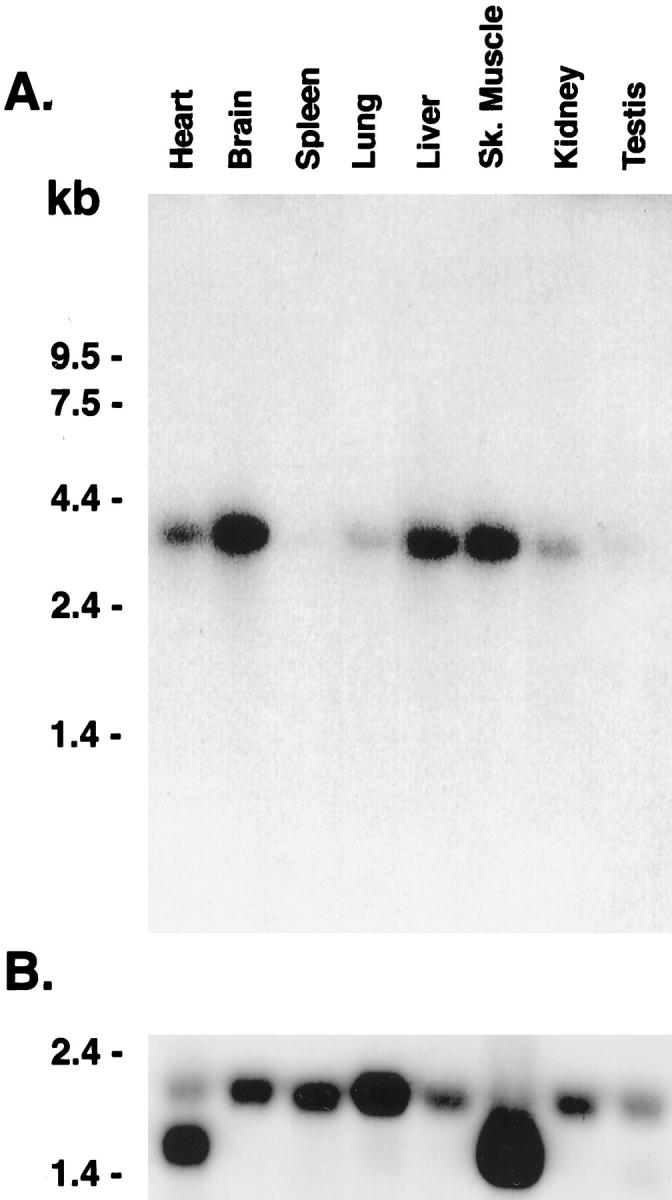
Northern blot analysis of acid α-glucosidase mRNA. A: Membranes containing BALB/c mice poly A+ RNA (2 μg) were hybridized with a 32P-labeled mouse GAA cDNA fragment (see Materials and Methods). A 3.8-kb species of variable levels was present in heart, brain, spleen, lung, liver, skeletal muscle, kidney, and testis. B: The β-actin 2.0- and/or 1.8-kb specific signal(s) are present in all lanes. This demonstrates mRNA integrity and is a reference for quantitative comparisons. RNA size markers are indicated on the left margin. Exposure time in A and B was 24 hours.
Cell-specific GAA mRNA expression was evaluated by in situ hybridization (Figure 2 ▶ and Table 1 ▶ ). The highest-intensity signal for GAA mRNA in adult animals was in neurons throughout the neuraxis (Figure 2, B–E) ▶ . In sagittal sections of the neocortex (Figure 2, A and B) ▶ the signals were more prominent in layers of the gray matter enriched in neuronal cell bodies. Very low-level signal was detected in the molecular layer of the cerebral cortex. In this layer, composed mainly of unmyelinated fibers and cell processes, scattered high-intensity signals corresponded to isolated neuronal cell bodies. Deeper cerebral neuronal groups also had high to moderate levels of signal, eg, those in the hippocampus (Figure 2C) ▶ and the basal ganglia (not shown) and those around the third ventricle and the cerebral aqueduct of Silvius (Figure 2D) ▶ . Moderate GAA mRNA expression levels also were observed in meningeal cells of the pia mater-arachnoid (Figure 2, A and B) ▶ . Although epithelial cells of the choroid plexuses also showed a moderate level of signal (Figure 2C) ▶ , GAA mRNA signal in ependymal lining was very low (Figure 2D) ▶ . Additional cells with high-intensity signal were neurons of the midbrain (Table 1) ▶ , the brain stem (Figure 2E) ▶ , and the anterior horns of the spinal cord (Table 1) ▶ . High-intensity signals were also in neurons of the sympathetic ganglia (Table 1) ▶ . In the cerebellum (Figure 2E) ▶ , Purkinje cells had the highest signals whereas neurons of the granular and the molecular cell layers had moderate to low signals (Table 1) ▶ . GAA mRNA signals were very low in CNS white matter areas, including those of the cerebral subcortex (Figure 2D) ▶ , cerebellum (not shown), and brain stem and spinal cord fiber tracts (Table 1) ▶ . Low signals were detected in glial cells interspersed between neurons in the gray matter. At higher magnifications (×400) the highest signal levels were in neurons and the lowest in glial cells (not shown). In the eye, very low-level signals were in the ganglion cell, inner nuclear and outer nuclear layers of the retina, and extraocular myocytes (Table 1) ▶ .
Figure 2.
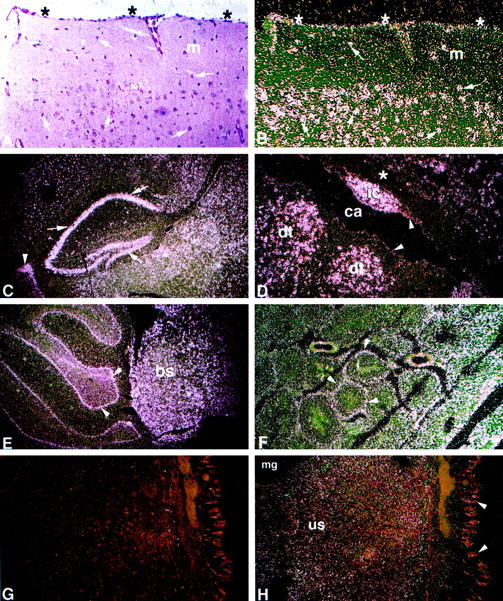
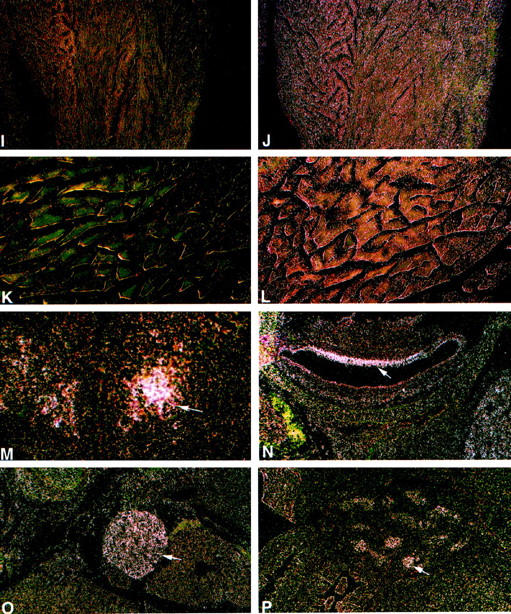
Spatial and temporal expression of the mouse GAA mRNA by in situ hybridization. A: Bright-field image with H&E. B to K: Dark-field images for the sense (G, I, and K) and for the antisense (B–F, H, J, and L–P) 35S-labeled riboprobes. A to L: Adult tissues. High-intensity signal is present in neurons throughout the neuraxis (B–E). A and B: Cerebral cortex. Pyramidal and granule neurons (arrows) have large purple nuclei by H&E (A) and show high-intensity signal (B). Signal of lower intensity is in the molecular layer (m). Moderate-intensity signal is in meningeal cells of the pia mater-arachnoid (*). C: Cerebral sagittal section. Highest-intensity signals are in neurons of the hippocampus (arrows), cells lining the choroid plexus (arrowhead), and surrounding neuronal layers. D: Cerebrum/aqueduct of Sylvius. High-intensity signal is in neurons adjacent to the cerebral aqueduct (ca) located in the inferior colliculus nucleus (ic) and dorsal tegmental nuclei (dt). Low- to very-low-intensity signal is in glial cells of the white matter (*) and ependymal lining cells (arrowheads). E: Hindbrain. High-intensity signal is in neurons of the cerebellar Purkinje cell layer (arrowheads) and neurons of the brainstem (bs). F: Testis. Signal of moderate intensity is in seminiferous tubules (arrowheads). G and H: Uterus. Uterine stromal mucosal cells (us), negative with the sense riboprobe (G), show diffuse low signal with the antisense riboprobe (H). Very low signal is in mucosal glandular (mg) and epithelial cells (arrowheads). I and J: Heart/ventricle. Diffuse signal of moderate intensity relative to background levels in the sense control (I) is in cardiomyocytes (J). K and L: Paraspinal muscle. Low level signal above background levels (K) is in myocytes (L). M to P: Embryonic tissues, 16 day. M: Hypothalamus. Moderate level signal is in differentiating neurons (arrow). N: Inner ear. Moderate level signal is in the epithelial lining cells (arrow). O: Sympathetic ganglia. Moderate signal is in neurons (arrow). P: Testis. Moderate signal is in epithelial cells of the seminiferous tubules (arrow). Counterstaining is with H&E. Magnification, ×200 (A and B), ×100 (D and F–P), and ×40 (C and E).
Table 1.
Relative GAA mRNA Signal Intensity in Adult Tissues by in Situ Hybridization
| Tissue | mRNA | Cell type |
|---|---|---|
| Cerebrum | +++/++++ | Neurons throughout |
| +++ | Pia mater-arachnoid meningeal cells | |
| +++ | Choroid plexus lining epithelial cells | |
| + | Ependymal cells | |
| +/++ | Glial cells/white matter | |
| Midbrain | +++/++++ | Neurons/colliculus and tegmental nuclei |
| +/++ | Glial cells/white matter | |
| Cerebellum | ++++ | Purkinje cells |
| ++/+++ | Other neurons | |
| +/++ | Glial cells/white matter | |
| Brain stem | +++/++++ | Neurons |
| +/++ | Glial cells/white matter | |
| Spinal cord | ++++ | Neurons/mostly anterior horns |
| +/++ | Glial cells/white matter | |
| Sympathetic ganglia | ++++ | Neurons |
| Eye | + | Cells of ganglion, internuclear, and outer layers |
| + | Extraocular myocytes | |
| Testis | +++ | Sertoli cells |
| + | Spermatogonial and interstitial cells | |
| Epididymis | +++ | Epididymal lining cells |
| Uterus | ++ | Stromal mucosal cells |
| + | Smooth muscle cells | |
| + | Glandular and mucosal epithelial cells | |
| Vagina | ++ | Stromal cells |
| + | Glandular epithelial cells | |
| Kidney | ++ | Cortical tubular epithelial cells |
| + | Medullar tubular epithelial cells | |
| Intestine | + | Stromal cells/colon lamina propria |
| + | Mucosal epithelial cells | |
| − | Mucosal epithelial cells | |
| ++ | Neurons/intestinal ganglia | |
| Liver | ++ | Hepatocytes |
| − | Cells of ducts and portal area | |
| Stomach | + | All cell layers |
| Heart | ++ | Cardiomyocytes/atrium, ventricle |
| − | Cells of cardiac valves | |
| Skeletal muscle | +/++ | Myocytes |
| Other tissues | + | Diffuse throughout lungs, thymus, pancreas, spleen, and adrenal glands |
The mRNA signal intensity was scored as follows: −, negative; +, very low; ++, low; +++, moderate; ++++, high.
In situ hybridizations of non-neural tissues showed generally lower GAA mRNA signals than those in the CNS and PNS (Table 1) ▶ . GAA expression was found in specific cells of several organs. In the testis, discrete signals of moderate intensity in Sertoli cells appeared as ring-like patterns (Figure 2F) ▶ . Epithelial cells of the epididymis were moderately positive (Table 1) ▶ . Signals of very low intensity were present in spermatogonia or interstitial cells (Table 1) ▶ . The uterine stromal mucosa (Figure 2, G and H) ▶ had low-intensity signals, but very low-intensity signals were in cells of smooth muscle, mucosa epithelia, or glands (Table 1) ▶ . In the vagina (Table 1) ▶ , low-intensity signals were in stromal cells of the lamina propria, and very low signals were detected in glandular epithelial cells.
In the kidney, a gradient of signal was detected in the tubular epithelial cells with low signals in the renal cortex and barely detectable signals in the medulla (Table 1) ▶ . In the intestine, GAA mRNA signals were undetectable in duodenal, jejunal, or ileal cells even after long-term 20- to 30-day exposures. Using similar exposure times, the colon showed very low-level signals in stromal cells of the lamina propria (Table 1) ▶ . In addition, low-level signals were detected in neurons of the intestinal ganglia (Table 1) ▶ . Differential expression was apparent in the liver. Low-intensity GAA mRNA signals were in hepatocytes, but no signals were appreciated in cells of the portal ducts or sinusoids (Table 1) ▶ . The stomach showed low signals throughout (Table 1) ▶ . GAA mRNA signals in cells of other visceral organs, including the lungs, thymus, pancreas, adrenal glands, and spleen, were slightly above background levels (Table 1) ▶ .
Analysis of cardiac and skeletal muscles showed uniformly distributed low signals in myocytes (Figure 2, I–L) ▶ . Prolonged exposures (20 to 30 days) were needed to discern distinct signals. Cardiac myocytes of the atria and ventricles showed low-intensity signals (Figure 2J) ▶ . No significant signals above background were detected in cardiac interstitial or valvular cells (Table 1) ▶ . Skeletal muscle evaluation included sections of the quadriceps, anterior tibialis, triceps, biceps, diaphragm, tongue, and paraspinal (Figure 2, K and L) ▶ and extraocular muscles. Uniformly distributed low-intensity signals were detected in all muscle groups. No qualitative or quantitative differences were observed regionally within a particular muscle or among different muscle groups (Table 1) ▶ .
Developmental Studies
A single specific signal of 3.8 kb was detected throughout gestation (days 11, 15, and 17) by Northern hybridization of poly A+ RNA of whole-mouse embryos (not shown). The levels of mRNA at days 15 and 17 were three to four times greater than that at day 11. By in situ hybridization, mouse embryo sagittal sections at days 9.5, 12, 14, and 16 of gestation showed ubiquitous low-level GAA mRNA expression with slightly increasing overall levels at day 16 (Table 2) ▶ . By gestational day 16, differential expression in specific cells was evident. GAA mRNA signals of moderate and high intensity were present in clusters of differentiating neurons of the hypothalamic region (Figure 2M) ▶ and epithelial cells lining the inner ear (Figure 2N) ▶ . Higher-intensity signals also were found in neurons of the peripheral sympathetic ganglia (Figure 2O) ▶ and in cells lining the developing seminiferous tubules of the testis (Figure 2P) ▶ . The epithelial cells lining the developing intestinal tract had low-level signals. Skeletal muscles showed low-level expression in most skeletal muscle groups. Higher-intensity signals were present in developing skeletal muscles from head and neck regions (Table 2) ▶ . In the developing heart, low- and very low-intensity GAA mRNA signals were seen in myocytes of atria and ventricles (Table 2) ▶ .
Table 2.
Relative GAA mRNA Signal Intensity in Embryo Tissues by in Situ Hybridization
| Tissue | mRNA level | Cell type |
|---|---|---|
| 9.5-day embryo | + | Ubiquitous |
| 12-day embryo | + | Ubiquitous |
| 14-day embryo | ||
| CNS | ++ | Ubiquitous |
| Other tissues | +/++ | Ubiquitous |
| 16-day embryo | ||
| CNS | ++/+++ | Differentiating neurons |
| ++++ | Epithelial lining cells/inner ear | |
| +++ | Neuroepithelial cells/hypothalamus | |
| PNS | ++++ | Neurons/sympathetic ganglia |
| Testis | +++ | Epithelial lining/seminiferous tubules |
| Intestine | ++ | Epithelial cells/mucosa |
| Muscle | +/++ | Myocytes of most muscle groups |
| +++ | Myocytes of neck and head muscles | |
| Heart | + | Cardiomyocytes/atrium and ventricle |
| Other tissues | +/++ | Most cell types |
The mRNA level was scored as follows: −, negative; +, very low; ++, low; +++, moderate; ++++, high.
Discussion
The present studies delineate differential expression patterns of GAA mRNA in mouse tissues. Northern blot and in situ hybridization showed GAA mRNA expression in all tissues and cell types. These results were expected as inferred from the ubiquitous distribution of GAA activity (reviewed in Ref. 3 ) and the generalized glycogen accumulation characteristic of human and mice deficiencies. 3,24,25 However, quantitative comparisons of GAA mRNA in Northern blots revealed differences among adult tissues, and within a particular tissue, regional and cell type differences were detected by in situ hybridization. Our studies indicate regulation of the GAA gene at the transcriptional or post-transcriptional level despite the fact that its promoter structure exhibits housekeeping gene characteristics, ie, a high GC content (80%), putative Sp1 and AP2 binding sites, and absence of TATA or CCAAT boxes. 13,14 Differential expression for other lysosomal and nonlysosomal genes with housekeeping-like promoters has been previously reported, 26-29 and in some instances, these are governed by cis-acting elements not included in the promoter region. For example, high-level thymus-specific expression is conferred by enhancer elements located in the first intron of the adenosine deaminase gene, containing a housekeeping promoter, whereas upstream regulatory units direct expression to the placenta and forestomach in the mouse. 27,30,31 GAA gene structure/function studies and a thorough characterization of post-transcriptional processes in different cell types are necessary for better understanding of the regulation of differential mRNA expression of this gene.
An objective of this work was to evaluate the potential for correlations between GAA mRNA expression in particular cell types and the phenotypic involvement resulting from GAA deficiency in mice and humans. This hypothesis would be based on the commonly held concept that sites of highest expression directly correlate with sites of major pathology. Such correlation could not be established due to extreme variation in mRNA signal in tissues affected by the disease. In general, the low-level mRNA expression in normal murine cardiac and skeletal myocytes is consistent with the low GAA activities in normal mice and also in humans. 20-22,24,25 However, both cell types have major phenotypic involvement in the murine and human GSDII diseases. 3,24,25 Of possible significance, glycogen is most abundant in normal muscle and liver. The major site of normal glycogen synthesis and breakdown is the cytoplasm, not obviously involving lysosomes. Autophagy has been proposed as the mechanism whereby cytoplasmic glycogen is transferred to lysosomes for breakdown, although the precise regulation of this autophagic event is not clear. Accumulation of glycogen within lysosomes of muscle and liver, organs severely involved in the disease process, may simply reflect higher autophagic activity in tissues with normally high glycogen content.
Unexpectedly, high levels of GAA mRNA signals were observed in neurons of the CNS, and increasing GAA mRNA signal was shown with in utero maturation in mouse CNS and PNS neurons. In both cases, normal enzyme activities 20-22,25 parallel mRNA levels. The mouse GAA knockout models have glycogen accumulation in Schwann cells and some neurons in addition to liver and muscle. Interestingly, review of the neuropathology of Pompe disease reveals major lysosomal glycogen accumulation in Schwann cells of the PNS, in glial cells, and, in decreasing amounts, in neurons of spinal cord, brainstem, and cerebrum. 4,6-8 These results suggest roles for GAA in specific cell types in fetal and adult CNS tissues. The lack of clear documented CNS effects in the mouse or human GAA deficiencies suggests either a lack of toxic effects of stored glycogen in the CNS neurons or the need for more intensive efforts to document potential sequelae in the nervous system. With the recent interest in development of enzyme replacement and/or gene therapy for GSDII, intensive surveillance for CNS involvement may be essential during assessment for overall efficacy. Additionally, such examinations are critical for the full evaluations of the mice homozygous for the targeted disruption of the GAA locus. 24
The differences in histopathological changes in muscle and in functional compromise between the different GAA knockout models may reflect the known differences in their genetic background, and would be consistent with the possibility that other specific metabolic differences play a significant role in the pathophysiological mechanisms and as modifier phenotype. These differences among tissues and during the maturation process remain to be elucidated and are critical to understanding the manifestations of GAA deficiency in humans and knockout mice.
Acknowledgments
We thank Ana Bencosme, Lisa Artmayer, Pamela Groen, and Kathy Saalfeld for excellent technical support, Alicia Emley for skilled assistance with illustrations, and J.W. Ellison for providing the library for GAA cDNA screening.
Footnotes
Address reprint requests to Dr. Elvira Ponce, Research Assistant Professor, Children’s Hospital Research Foundation, Division of Human Genetics, 3333 Burnet Avenue, Cincinnati, Ohio 45229-3039. E-mail: eponce@chmcc.org.
Supported by grants from Children’s Hospital Research Foundation (E. Ponce), March of Dimes National Foundation (R. Hirschhorn), Muscular Dystrophy Association (R. Hirschhorn), and NIH grant DK36729 (G. A. Grabowski).
References
- 1.Hers HG: α-Glucosidase in generalized glycogen-storage disease (Pompe’s disease). Biochem J 1963, 86:11-1613954110 [Google Scholar]
- 2.Brown BI, Brown DH: The subcellular distribution of enzymes in type II glycogenosis and the occurrence of oligo α-1,4-glucan glucohydrolase in human tissues. Biochim Biophys Acta 1981, 110:124-133 [DOI] [PubMed] [Google Scholar]
- 3.Hirschhorn R: Glycogen storage disease type II: acid α-glucosidase (acid maltase) deficiency. Scriver CR Beaudet AL Sly WL Valle D eds. The Metabolic and Molecular Bases of Inherited Disease. 1995, :pp 2443-2464 McGraw Hill, New York [Google Scholar]
- 4.Mancall EL, Aponte GE, Berry RG: Pompe’s disease (diffuse glycogenosis) with neuronal storage. J Neuropathol Exp Neurol 1965, 24:85-96 [DOI] [PubMed] [Google Scholar]
- 5.Hug G, Schubert WK: Glycogenosis type II. Arch Pathol 1967, 84:141-152 [PubMed] [Google Scholar]
- 6.Hogan GR, Gutmann L, Schmidt R, Gilbert E: Pompe’s disease. Neurology 1969, 19:894-900 [DOI] [PubMed] [Google Scholar]
- 7.Gambetti P, Dimauro S, Baker L: Nervous system in Pompe’s disease: ultrastructure and biochemistry. J Neuropathol Exp Neurol 1971, 30:412-430 [DOI] [PubMed] [Google Scholar]
- 8.Martin JJ, Barsy T, de Hoof F, van Palladini G: Pompe’s disease: an inborn lysosomal disorder with storage of glycogen: a study of brain and striated muscle. Acta Neuropathol 1973, 23:229-244 [DOI] [PubMed] [Google Scholar]
- 9.Martin JJ, de Barsy T, den Tandt WR: Acid maltase deficiency in non-identical adult twins: a morphological and biochemical study. J Neurol 1976, 213:105-118 [DOI] [PubMed] [Google Scholar]
- 10.Dimauro S, Stern LZ, Mehler M, Nagle RB, Payne C: Adult-onset acid maltase deficiency: a postmortem study. Muscle Nerve 1978, 1:27-36 [DOI] [PubMed] [Google Scholar]
- 11.Kuo WL, Hirschhorn R, Huie ML, Hirschhorn K: Localization and ordering of acid α-glucosidase (GAA) and thymidine kinase (TK1) by fluorescence in situ hybridization. Hum Genet 1996, 97:404-406 [DOI] [PubMed] [Google Scholar]
- 12.Hoefsloot LH, Hoogeveen-Westerveld M, Reuser AJ, Oostra BA: Characterization of the human lysosomal α-glucosidase gene. Biochem J 1990, 272:493-497 [DOI] [PMC free article] [PubMed] [Google Scholar]
- 13.Martiniuk F, Mehler M, Tzall S, Meredith G, Hirschhorn R: Sequence of the cDNA and 5′-flanking region for human acid α-glucosidase, detection of an intron in the 5′ untranslated leader sequence, definition of 18-bp polymorphisms, and differences with previous cDNA and amino acid sequences. DNA Cell Biol 1990, 9:85-94 [DOI] [PubMed] [Google Scholar]
- 14.Hoefsloot LH, Willemsen R, Kroos MA, Hoogeveen-Westerveld M, Hermans MM, van der Ploeg AT, Oostra BA, Reuser AJ: Expression and routing of human lysosomal α-glucosidase in transiently transfected mammalian cells. Biochem J 1990, 272:485-492 [DOI] [PMC free article] [PubMed] [Google Scholar]
- 15.Martiniuk F, Mehler M, Pellicer A, Tzall S, La Badie G, Hobart C, Ellenbogen A, Hirschhorn R: Isolation of a cDNA for human acid α-glucosidase and detection of genetic heterogeneity for mRNA in three α-glucosidase-deficient patients. Proc Natl Acad Sci USA 1986, 83:9641-9644 [DOI] [PMC free article] [PubMed] [Google Scholar]
- 16.Hoefsloot LH, Hoogeveen-Westerveld M, Kroos MA, van Beeumen J, Reuser AJ, Oostra BA: Primary structure and processing of lysosomal α-glucosidase: homology with the intestinal sucrase-isomaltase complex. EMBO J 1988, 7:1697-1704 [DOI] [PMC free article] [PubMed] [Google Scholar]
- 17.van der Ploeg AT, Hoefsloot LH, Hoogeveen-Westerveld M, Petersen EM, Reuser AJ: Glycogenosis type II: protein and DNA analysis in five South African families from various ethnic origins. Am J Hum Genet 1989, 44:787-793 [PMC free article] [PubMed] [Google Scholar]
- 18.Martiniuk F, Mehler M, Tzall S, Meredith G, Hirschhorn R: Extensive genetic heterogeneity in patients with acid α-glucosidase deficiency as detected by abnormalities of DNA and mRNA. Am J Hum Genet 1990, 47:73-78 [PMC free article] [PubMed] [Google Scholar]
- 19.Zhong N, Martiniuk F, Tzall S, Hirschhorn R: Identification of a missense mutation in one allele of a patient with Pompe disease, and use of endonuclease digestion of PCR-amplified RNA to demonstrate lack of mRNA expression from the second allele. Am J Hum Genet 1991, 49:635-645 [PMC free article] [PubMed] [Google Scholar]
- 20.Steinitz K, Rutenberg A: Tissue α-glucosidase activity and glycogen content in patients with generalized glycogenosis. Isr J Med Sci 1967, 3:411-421 [PubMed] [Google Scholar]
- 21.Johnson WG, Hong JL, Knights SM: Variation in ten lysosomal hydrolase enzyme activities in inbred mouse strains. Biochem Genet 1986, 24:891-909 [DOI] [PubMed] [Google Scholar]
- 22.Shin-Buehring YS, Dallinger M, Osang M, Rahm P, Schaub J: Lysosomal enzyme activities of human fetal organs during development. Biol Neonate 1980, 38:300-308 [DOI] [PubMed] [Google Scholar]
- 23.Tibbot BK, Skadsen RW: Molecular cloning and characterization of a gibberellin-inducible, putative α-glucosidase gene from barley. Plant Mol Biol 1996, 30:229-241 [DOI] [PubMed] [Google Scholar]
- 24.Bijvoet AG, van de Kamp EH, Kroos MA, Ding JH, Yang BZ, Visser P, Bakker CE, Verbeet MP, Oostra BA, Reuser AJ, van der Ploeg AT: Generalized glycogen storage and cardiomegaly in a knockout mouse model of Pompe disease. Hum Mol Genet 1998, 7:53-62 [DOI] [PubMed] [Google Scholar]
- 25.Raben N, Nagaraju K, Lee E, Kessler P, Byrne B, Lee L, LaMarca M, King C, Ward J, Sauer B, Plotz P: Targeted disruption of the acid α-glucosidase gene in mice causes an illness with critical features of both infantile and adult human glycogen storage disease type II. J Biol Chem 1998, 273:19086-19092 [DOI] [PubMed] [Google Scholar]
- 26.Sun Y, Witte DP, Grabowski GA: Developmental and tissue-specific expression of prosaposin mRNA in murine tissues. Am J Pathol 1994, 145:1390-1398 [PMC free article] [PubMed] [Google Scholar]
- 27.Aronow B, Lattier D, Silbiger R, Dusing M, Hutton J, Jones G, Stock J, McNeish J, Potter S, Witte D: Evidence for a complex regulatory array in the first intron of the human adenosine deaminase gene. Genes Dev 1989, 3:1384-1400 [DOI] [PubMed] [Google Scholar]
- 28.Ohshima T, Murray GJ, Nagle JW, Quirk JM, Kraus MH, Barton NW, Brady RO, Kulkarni AB: Structural organization and expression of the mouse gene encoding α-galactosidase A. Gene 1995, 166:277-280 [DOI] [PubMed] [Google Scholar]
- 29.Du H, Witte DP, Grabowski GA: Tissue and cellular specific expression of murine lysosomal acid lipase mRNA and protein. J Lipid Res 1996, 37:937-949 [PubMed] [Google Scholar]
- 30.Winston JH, Hanten GR, Overbeek PA, Kellems RE: 5′ Flanking sequences of the murine adenosine deaminase gene direct expression of a reporter gene to specific prenatal and postnatal tissues in transgenic mice. J Biol Chem 1992, 267:13472-13479 [PubMed] [Google Scholar]
- 31.Shi D, Winston JH, Blackburn MR, Datta SK, Hanten G, Kellems RE: Diverse genetic regulatory motifs required for murine adenosine deaminase gene expression in the placenta. J Biol Chem 1997, 272:2334-2341 [PubMed] [Google Scholar]