

Abstract
T lymphocytes have a central regulatory role in the pathogenesis of asthma. We delineated the participation of lymphocytes in the acute allergic and chronic tolerant stages of a murine model of asthma by characterizing the various subsets of lymphocytes in bronchoalveolar lavage and lung tissue associated with these responses. Acute (10-day) aerosol challenge of immunized C57BL/6J mice with ovalbumin resulted in airway eosinophilia, histological evidence of peribronchial and perivascular airway inflammation, clusters of B cells and TCRγδ cells in lung tissue, increased serum IgE levels, and airway hyperresponsiveness to methacholine. In mice subjected to chronic (6-week) aerosol challenge with ovalbumin, airway inflammation and serum IgE levels were significantly attenuated and airway hyperresponsiveness was absent. The marked increases in lung B and T cell populations seen in the acute stage were also significantly reduced in the chronic stage of this model. Thus, acute ovalbumin challenge resulted in airway sensitization characteristic of asthma, whereas chronic ovalbumin challenge elicited a suppressed or tolerant state. The transition from antigenic sensitization to tolerance was accompanied by shifts in lymphocyte profiles in the lung and bronchoalveolar lavage fluid.
Asthma is the most common chronic illness in developed countries. Our current understanding of the pathophysiology of allergic asthma is that it occurs from a breakdown of the normal tolerance to inhaled antigens, as a result of complex interactions between host and environmental factors. Emerging evidence suggests that the development of clinical sensitivity versus normal tolerance to inhaled antigens involves the establishment of a dominant population of CD4+ T lymphocytes that are either classified as Th2-like (sensitization) or Th1-like (tolerance). 1 Th2 responses are characterized by secretion of the cytokines interleukin (IL)-4 and IL-13, which induce the production of IgE by B cells, 2-5 and IL-5, which regulates the growth, differentiation, and activation of eosinophils. 6 Conversely, Th1 responses are characterized by secretion of IL-2, tumor necrosis factor (TNF)-β, and interferon (IFN)-γ. IFN-γ has been shown to stimulate low-level IgG production and to potently inhibit IL-4-mediated IgE responses both in vivo and in vitro. 7 The mechanisms that control CD4+ T lymphocyte polarization into either Th1 or Th2 phenotypes are incompletely understood but appear to involve genetic predispositions, local factors such as existing cytokine concentrations and inflammation, and antigenic factors such as the potency, dose, and duration of exposure of the eliciting antigen. In susceptible individuals, antigen sensitization results in specific local and systemic IgE production and airway eosinophilia, which in turn induce the airway inflammation, airway hyperresponsiveness, and reversible airway obstruction characteristic of asthma.
The factors influencing antigen sensitization or tolerance can be better studied in mice, given their well defined immune system, the creation of genetically altered animals, and the availability of reagents to various cellular receptors and cytokines. Furthermore, the mouse is a suitable model for allergic responses in the lungs because the major antibody in murine allergic pulmonary inflammation is IgE. 8 Thus, several investigators have employed mouse models to investigate the mechanisms of allergic airway sensitization. 10-15 In addition, mice have been used to study the chronic tolerant state to airway exposure to antigen. 16, 17 Nevertheless, murine models have not been used to assess the natural history of antigen sensitization and the re-establishment of the tolerant state in allergic airway disease. In this study, we have characterized the inflammatory and physiological responses to chronic inhaled ovalbumin (OVA) administration in C57BL/6J mice. With initial immunization and aerosol challenge, we have developed a murine model of allergic sensitization with similar characteristics to human asthma, such as increased IgE production, increased pulmonary eosinophils, increased pulmonary B and T lymphocytes, and airway hyperresponsiveness. We also have found that chronically challenged mice can develop antigenic tolerance, as characterized by diminished IgE levels and loss of airway eosinophilia and hyperreactivity. These pathophysiological changes were accompanied by profound alterations in lymphocyte profiles within the airways.
Materials and Methods
Animals
Male and female C57BL/6J mice were purchased from Jackson Laboratory, Bar Harbor, ME, and housed conventionally in plastic cages with corncob bedding. The animal room was maintained at 22 to 24°C with a daily light/dark cycle (light from 0600 to 1800 hours). Chow and water were supplied ad libitum. Mice were 3 to 6 months of age and weighed 18 to 30 g. All animal manipulations were approved by the Animal Care Committee at the University of Connecticut Health Center.
Ovalbumin Exposure Protocol
Mice were initially immunized with three weekly intraperitoneal (i.p.) injections of a suspension containing 8 μg of OVA (grade V, Sigma Chemical Co., St. Louis, MO) and 2 mg of aluminum hydroxide (alum) in 0.5 ml of saline. One week after the last injection the mice were exposed either to 1% aerosolized OVA, 1 hour/day, for 1 to 10 days (acute stage) or to 3 to 6 weeks at 1 hour/day for 5 days/week (chronic stage). The mice were placed in plastic restraint tubes (Research and Consulting Co., Basel, Switzerland) for nose-only exposures. The aerosols were generated by a Lovelace nebulizer (In-Tox Products, Albuquerque, NM) into a 7.6-L inhalation exposure chamber to which restraint tubes were attached. Chamber airflow was 10 L/minute. Aerosol particle size of OVA was determined by gravimetric analysis, with a Mercer cascade impactor (In-Tox Products). The mass median aerodynamic diameter and geometric standard deviations (GSDs) were 1.4 and 1.6 μm, respectively. The estimated daily inhaled OVA dose approximated 80 μg/mouse. Twenty-four hours after the final aerosol exposure, the mice were sacrificed by ketamine/xylazine overdose and exsanguination, and analyses of bronchoalveolar lavage (BAL), lung tissue, and blood samples were performed.
BAL Analysis
The lungs from each animal were lavaged in situ with five 1-ml aliquots of sterile saline, with 3 to 4 ml of BAL fluid recovered from each animal. The BAL was centrifuged, and resulting cell pellets were resuspended in 250 μl of saline. Total leukocytes were counted with a hemocytometer using trypan blue dye exclusion as a measure of viability. Cytospin slides were made and stained with May-Grunwald/Giemsa to determine the BAL cell differential. The remaining cells were analyzed by fluorescence flow cytometry. BAL protein concentrations were measured in the supernatants using bovine serum albumin as a standard. 18
Flow Cytometry and Immunofluorescence
Monoclonal antibodies (MAbs) purchased from PharMingen (San Diego, CA) were directed against the following antigens: CD45 (clone 30-F11), TCRβ (H57-597), 19 TCRδ (GL3), 20 CD3ɛ (500A2), CD8 (53-6.7), and B220 (RA3-6B2). These were conjugated with biotin, phycoerythrin (PE), fluorescein isothiocyanate (FITC), allophycocyanine (APC), or Cychrome. Anti-CD4-PE (clone GK1.5) was purchased from Becton-Dickinson Collaborative Technologies, Bedford, MA. Anti-CD8α-FITC (clone 3.168) was conjugated to FITC in our laboratory. 21 Biotin-conjugated antibodies were detected with streptavidin-PE or -Cy5 (Jackson ImmunoResearch Laboratories, West Grove, PA) or -Cychrome (PharMingen). For fluorescence flow cytometry, BAL samples were washed in PBS containing 0.2% bovine serum albumin and 0.1% NaN3. Aliquots containing 10 4 to 10 5 cells were incubated with 100 μl of appropriately diluted antibodies for 30 minutes at 4°C. After staining, the cells were washed twice with the above PBS solution, and relative fluorescence intensities were determined on a 4-decade log scale by flow cytometric analysis using a FACScan or FACScalibur (Becton Dickinson, San Jose, CA).
Tissue immunofluorescence was assessed for distribution of cells using the above stated antibodies to B cells and to TCRαβ and TCRγδ lymphocytes and was correlated with standard hematoxylin and eosin (H&E) histological assessment. Unmanipulated lungs (not exposed to BAL or methacholine) were excised, cut into small pieces, and rapidly frozen in optimal cutting temperature embedding media (OCT). The pieces were then cut into 5-μm frozen sections using a Hacker cryostat, mounted onto microscope slides (Clay Adams Gold Seal), and stored at −20°C. For immunofluorescence staining, the slides were fixed in acetone (−20°C) for 5 minutes, dried, and blocked with 1% ChromPure IgG solution (Jackson ImmunoResearch) for 30 minutes at room temperature. After two washes with PBS plus 0.1% NaN3, specific PE-mouse antibody was added to the tissue and incubated for 1 hour in a humidity chamber. Slides were then washed twice with PBS plus 0.1% NaN3. Sections were mounted in PBS/glycerol (1:1) and viewed with a Zeiss LSM 410 confocal microscope.
Histology
After sacrifice, the unmanipulated lungs were removed, fixed with 10% buffered formalin, and processed in a standard manner. Tissue sections were stained with H&E. 22
Measurement of Airway Hyperreactivity: Lung Resistance
Measurements of pulmonary resistance (RL) were obtained in anesthetized, mechanically ventilated mice via standard protocol. 23 OVA-immunized mice were exposed to 1% aerosolized OVA, 1 hour/day, for 1 to 10 days. Mice were studied 24 hours after the last inhalation and compared with naive mice. After anesthetizing the animals with pentobarbital (75 mg/kg i.p. injection), the abdominal inferior vena cava was cannulated, and a tracheostomy catheter was placed. The chest was opened by a small anterior incision, and the animal was placed in a whole-body plethysmograph. Mechanical ventilation was established with a small rodent respirator (model 683, Harvard Apparatus, Natick, MA) delivering a 10 ml/kg tidal volume at 140 breaths/minute, with a positive end-expiratory pressure (PEEP) of 3 cm H2O. Values for RL were calculated by analysis of electrical signals proportional to lung volume, airflow, and transpulmonary pressure. Changes in lung volume were determined from the measured changes in plethysmographic pressure and were differentiated over time to obtain flow measurements. Transpulmonary pressure was obtained from the difference between measured pressures at the airway opening and within the plethysmograph. After the establishment of baseline lung function, the animal received sequentially increasing intravenous doses of methacholine (Sigma; 3 to 3000 μg/ml in 1 ml/kg body weight increments). Maximal RL responses were determined from measurements averaged over 6-second intervals. Pulmonary function was allowed to return to baseline before each subsequent dose.
Measurement of Airway Hyperreactivity: Excised Lung Gas Volume
In a separate series of experiments, air trapping in response to aerosolized methacholine was measured by excised lung gas volume (ELGV). This technique is based on Archimedes’ principle and is a sensitive index of airway obstruction in small rodents. 24-26 Twenty-four hours after the last OVA aerosol challenge, acute-stage and chronic-stage mice were exposed to aerosolized methacholine using the same chamber and nebulizer as in the sensitization protocol. Airflow was 10 L/minute, and nebulizer methacholine concentration ranged from 1 to 300 mg/ml. After an 8-minute exposure, mice were sacrificed via exsanguination after an i.p. ketamine/xylazine injection. The lungs and trachea were removed and trimmed of nonpulmonary tissue. ELGV was measured as previously described 26 and compared with values in control, unexposed mice.
IgE Analysis
Blood was obtained by cardiac puncture just before sacrifice, and serum IgE levels were measured by ELISA. Total IgE was captured using Immunlon 2 microtiter plates (Dynatech Laboratories, Chantilly, VA) coated with anti-mouse IgE (clone R35-72 at 2 μg/ml in PBS). Duplicate twofold dilutions of serum (1:10, 1:20, and 1:40) were added and incubated for 1 hour at room temperature. Detection was with biotinylated anti-mouse IgE (clone R35-92 at 2 μg/ml; antibodies from PharMingen, San Diego, CA) and avidin-conjugated horseradish peroxidase (1:2000 dilution; Zymed Laboratories, San Francisco, CA). Development was typically for 10 minutes (the time when the A405 was less than 1.0 for the 400 μg/ml IgE standard).
Statistical Analysis
Student’s unpaired t-test and Bonferronis’ adjustment for multiple comparisons were used for data analysis. Dose-response data were compared by repeated-measures analysis of variance (ANOVA) using StatView 4.5 (Abacus Concepts, Berkeley, CA).
Results
Acute Exposure to Aerosol OVA (1 to 10 Days) Increased BAL Leukocytes up to 36-Fold in Sensitized Mice
Mice immunized with three weekly injections of i.p. OVA/alum and then acutely challenged to OVA aerosol displayed significant increases in the numbers of BAL macrophages, eosinophils, and lymphocytes compared with control (unexposed) mice (Table 1) ▶ . The numbers of BAL cells began to increase by day 3 of aerosol challenge and peaked at 7 to 10 days of continued exposure. Total leukocytes per mouse increased from 3.7 × 10 4 in control, unexposed animals to a maximum of 133 × 10 4 in acute OVA challenged mice at day 10. The ratios of cell types changed dramatically during the acute OVA challenge. In the unexposed mice, over 99% of the BAL cells were macrophages, but this fraction dropped to 8% after 10 days of OVA aerosol. Eosinophils and lymphocytes increased from less than 1% in unexposed mice to 73% and 19%, respectively. BAL protein content was significantly higher at days 5, 7, and 10 versus control protein BAL (P < 0.05). There were no differences in total and differential cell counts or protein content among control unexposed mice, mice that received only 3 weeks of i.p. OVA/alum immunizations without aerosol exposure, or mice that received the 10-consecutive-day OVA aerosols without preceding i.p. immunization (data not shown). The combination of i.p. immunization and aerosol challenge was necessary to see the inflammatory response.
Table 1.
BAL Analysis of Protein and Leukocytes in Control, Acute-OVA, and Chronic-OVA Challenged Mice
| Exposure | Protein (μg/ml) | Total leukocytes × 104 | Macrophages × 104 (%) | Eosinophils × 104 (%) | Lymphocytes × 104 (%) |
|---|---|---|---|---|---|
| Control (unexposed) | 130 ± 10 | 3.7 ± 0.6 | 3.7 ± 0.6 | 0 | 0 |
| (>98) | (<1) | (<1) | |||
| Acute | |||||
| 1 day | 155 ± 21 | 5.3 ± 0.4 | 5.1 ± 0.5 | 0 | 0 |
| (96 ± 2) | (<1) | (<1) | |||
| 3 days | 136 ± 18 | 13 ± 2* | 6.5 ± 1.0* | 5 ± 2* | 1.3 ± 0.3 |
| (54 ± 12*) | (34 ± 10*) | (10 ± 2*) | |||
| 5 days | 232 ± 25* | 48 ± 9* | 7.0 ± 5.0* | 30 ± 5* | 9.4 ± 2.0* |
| (20 ± 5*) | (60 ± 7*) | (19 ± 2*) | |||
| 7 days | 305 ± 89* | 132 ± 7* | 13 ± 2* | 91 ± 9* | 28 ± 5* |
| (10 ± 1*) | (68 ± 4*) | (21 ± 5*) | |||
| 10 days | 280 ± 17* | 147 ± 10* | 11 ± 5* | 106 ± 20* | 32 ± 10* |
| (8 ± 2*) | (73 ± 2*) | (19 ± 3*) | |||
| Chronic | |||||
| 3 weeks | 203 ± 29* | 124 ± 16* | 56 ± 11* | 28 ± 9* | 39 ± 13* |
| (45 ± 10*) | (22 ± 6*) | (31 ± 5*) | |||
| 6 weeks | 178 ± 19 | 6.4 ± 1.7 | 4.5 ± 1.0 | 0 | 1.9 ± 1* |
| (71 ± 2*) | (<1) | (29 ± 1*) |
For acute exposure, as described in Materials and Methods, mice were immunized with i.p. OVA/alum weekly for 3 weeks and were then exposed to aerosolized OVA for 1 to 10 days. Twenty-four hours after the last aerosol OVA challenge, mice were sacrificed. For chronic exposure, mice were immunized with 3 weekly i.p. OVA/alum injections as above and then were exposed to aerosolized OVA 5 days/week for 3 to 6 weeks. Twenty-four hours after the last aerosol OVA challenge, mice were sacrificed. BAL cells were counted, and cytospin preparations were stained to obtain the differential leukocyte count. Data represent mean ± SEM values; n = 4 to 8 mice/time point.
*P < 0.05 versus control mice.
Chronic Exposure to OVA Aerosol (3 and 6 Weeks) Drastically Reduced Total BAL Leukocytes
Mice immunized with three weekly i.p. injections of OVA/alum and then exposed to daily OVA aerosol for 6 weeks had no significant difference in total BAL leukocytes as compared with control mice (Table 1) ▶ . There was a significant increase in the percentage of lymphocytes (29%) versus the acute challenged state at day 10 (19%), but the total number of lymphocytes was much less in the chronic stage than in the 10-day acute stage (P < 0.0001). The remaining BAL cells in the chronically challenged animals were macrophages. Eosinophils were completely absent in these chronic mice. Immunized mice exposed to 3 weeks of OVA aerosol had total and differential BAL cell counts that were intermediate between those of the 10-day acute allergic and 6-week chronic tolerant stages. Of note, although the 3-week OVA aerosol-exposed mice still had a significant increase in BAL eosinophils, these cells were markedly decreased as compared with the 10-day acute-stage animals.
Relative Distributions of BAL B and T Lymphocytes Differed between the Acute and Chronic Stages
Along with the 17-fold decrease in total lymphocytes in the chronic- versus acute-stage animals, the proportions of lymphocytes in BAL also changed dramatically (Table 2 ▶ ; Figure 1 ▶ ). In the 10-day acute OVA challenge stage, 53% of BAL lymphocytes were B cells, compared with 11% in the 6-week chronic OVA challenged mice. Regarding the T lymphocytes, in the acute OVA challenge stage, 34% of total BAL lymphocytes were TCRαβ cells and 12% were TCRγδ cells. These fractions changed to 82% and 7%, respectively, in the chronic OVA challenged animals. Thus, TCRγδ cells comprised 26% of the T lymphocytes in the acute stage but only 7% of T cells in the chronic stage. In addition, the ratio of CD4/CD8 αβ T cells shifted in BAL fluid in acute- versus chronic-stage animals (Table 3 ▶ ; Figure 1 ▶ ). In acute OVA challenged mice, the ratio of CD4+ to CD8+ TCRαβ cells was 2.4, in contrast to the ratio of 0.6 in chronic OVA challenged animals. This change was due to a lesser reduction of CD8+ TCRαβ cells relative to the decreases in CD4+ TCRαβ cells and B cells in the airways of chronic-stage animals.
Table 2.
BAL Analysis of B and T Lymphocytes from Acute (10 Days) and Chronic (6 Weeks) OVA Challenged Mice
| B cells (%) | T cells | ||
|---|---|---|---|
| % TCRαβ | % TCRγδ | ||
| Acute OVA | 53 ± 4 | 34 ± 3 | 12 ± 2 |
| Chronic OVA | 11 ± 1* | 82 ± 2* | 7 ± 1 |
BAL lymphocyte subset distributions were quantitated by fluorescence flow cytometry. Values are mean ± SEM for five to eight mice/group.
*Significant difference from acute challenged mice at P < 0.05.
Figure 1.
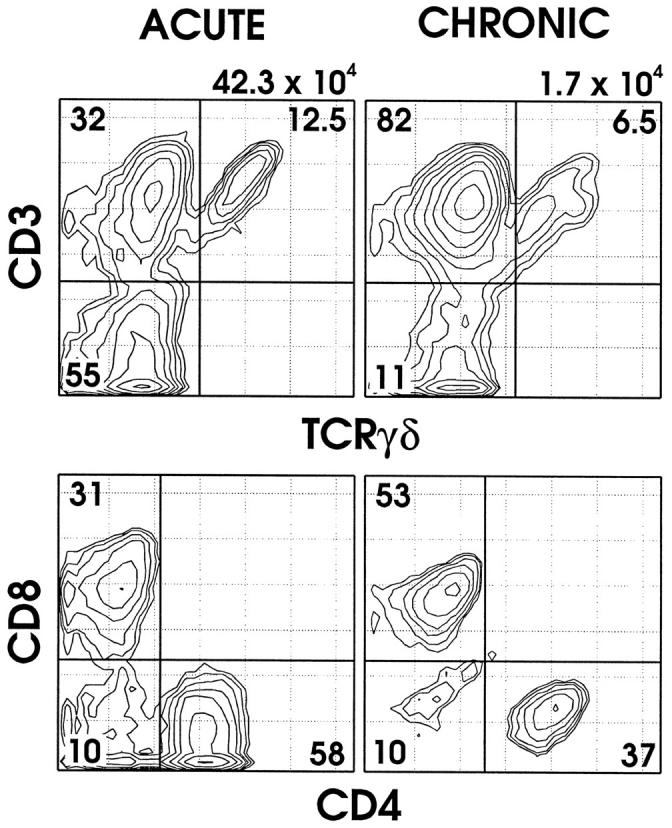
Flow cytometric analysis of BAL T cells in representative 10-day acute (left column) and 6-week chronic (right column) ovalbumin (OVA) challenged mice. Top panels: BAL cells were stained with MAb directed against CD45, TCRβ, TCRδ, and CD3ɛ and analyzed by fluorescence flow cytometry. CD45+ lymphocytes were positively gated and analyzed for TCR expression. Cells in the lower left quadrant represent B cells as confirmed by B220 expression. Note the relative increase in TCRαβ cells and the decreases in TCRγδ cells and B cells in the chronic state. Lower panels: BAL cells were stained with MAb directed against CD45, TCRβ, CD4, and CD8 and analyzed by fluorescence flow cytometry. CD45+TCRβ+ lymphocytes were positively gated and analyzed for expression of CD4 or CD8. Note the change in distributions of TCRαβ CD8+ and CD4+ cells between acute- and chronic-stage animals. The numbers above each column represent the total number of BAL hematopoietic cells (CD45+) within the FSC versus SSC lymphocyte gate from each mouse; numbers within each quadrant represent the percentage of cells of the indicated phenotype.
Table 3.
BAL Analysis of TCRαβ Cells from Acute (10 Days) and Chronic (6 Weeks) OVA Challenged Mice
| % CD4+ | % CD8+ | % CD4− CD8− | CD4:CD8 ratio | |
|---|---|---|---|---|
| Acute OVA | 61 ± 2 | 27 ± 2 | 11 ± 1 | 2.4 ± 0.3 |
| Chronic OVA | 34 ± 2* | 56 ± 4* | 10 ± 1 | 0.6 ± 0.1* |
Values are mean ± SEM for five to eight mice/group.
*Significant difference from acute challenged mice at P < 0.05.
Lung Tissue Immunofluorescence Demonstrated Increased TCRγδ Cells and B Cells in the Lungs of Acute-Stage Mice
In contrast to the absence of detectable TCRγδ cells in unexposed mice (Figure 2a) ▶ , clusters of positive staining TCRγδ cells (Figure 2b) ▶ and B cells (Figure 2c) ▶ were regularly found in the lungs of acute OVA challenged mice. These clusters of cells were localized to peribronchial and perivascular areas of inflammation. Such clusters of TCRγδ or B lymphocytes were not seen in the lungs of control animals that received either the i.p. immunizations alone or the 10-consecutive-day inhalations alone. Of interest, we were unable to detect clusters of TCRγδ cells or B cells in the chronic OVA challenged animals (not shown).
Figure 2.
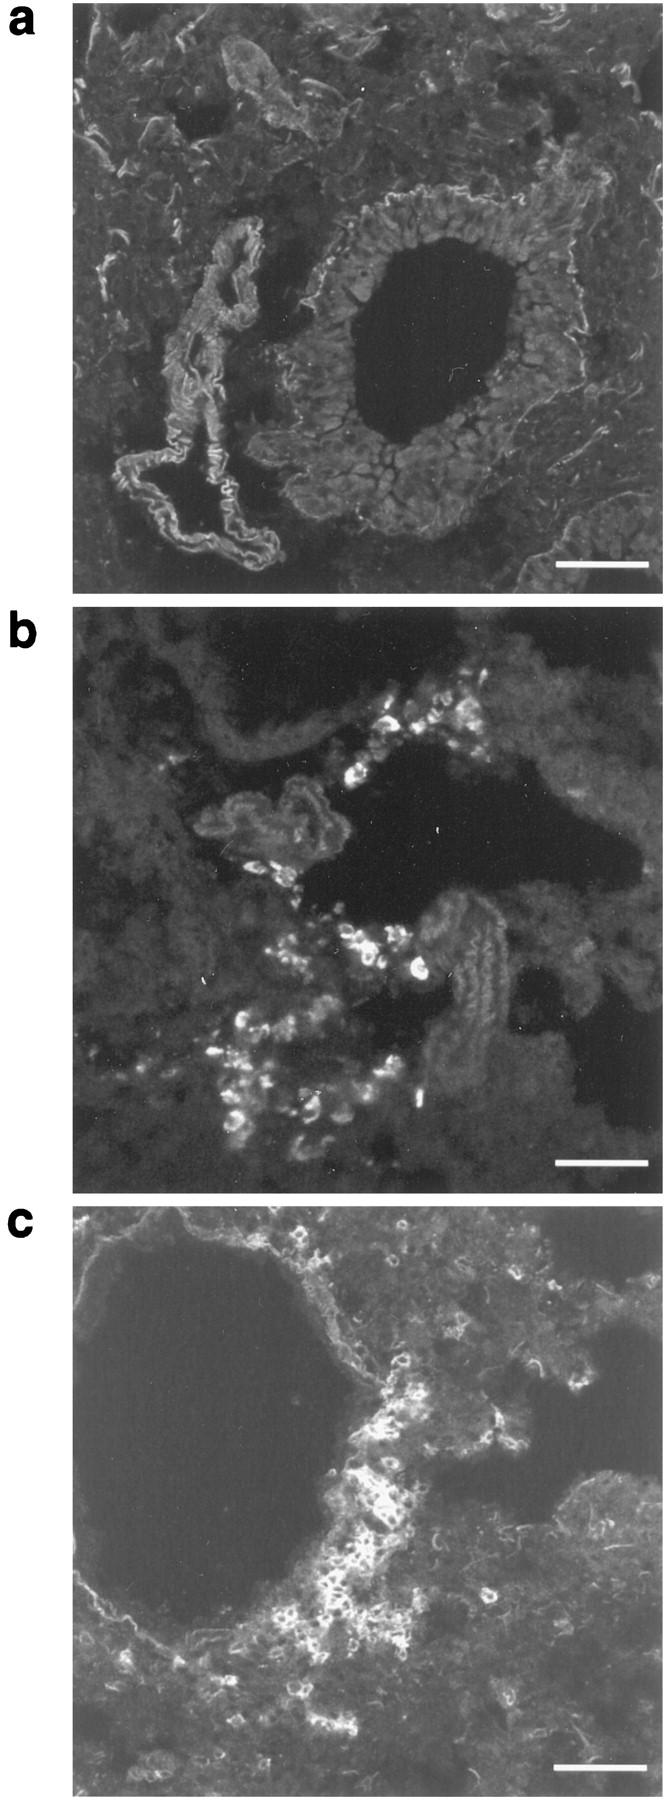
Immunofluorescence analysis of TCRγδ cells and B cells in lung tissue from representative unexposed mice and 10-day acute OVA exposed mice. Frozen lung sections were stained to detect TCRγδ cells (GL3-PE) and B cells (Ra3-6B2-PE) as described in Materials and Methods. Unexposed mice showed no TCRγδ cells (a) or B cells (not shown). In contrast, acute OVA challenged mice demonstrated clusters of TCRγδ cells (b) and B cells (c) in areas of peribronchial inflammation. Scale bars, 50 μm.
Chronic OVA Challenged Mice Showed Less Histological Evidence of Lung Injury Than Acute Challenged Mice
No histological evidence of lung damage was found in unexposed control animals, animals that received only the i.p. immunization protocol, or animals that received only the 10-consecutive-day inhalations (Figure 3 ▶ , top panel). In contrast, the acute OVA challenge stage was characterized by dense peribronchial inflammation consisting primarily of lymphoplasmacytic cells and eosinophils (Figure 3 ▶ , middle panel). There were also areas of perivascular inflammation and slight peribronchial muscle hypertrophy noted in the acute-stage animals. These histological findings are consistent with the pathophysiology of allergic asthma. The chronic-stage animals had qualitatively less peribronchial lymphoplasmacytic inflammation, mild peribronchial muscle hypertrophy, and slight to mild bronchial lining cell hyperplasia. Eosinophils were notably absent in lungs from these chronic-stage animals (Figure 3 ▶ , lower panel).
Figure 3.
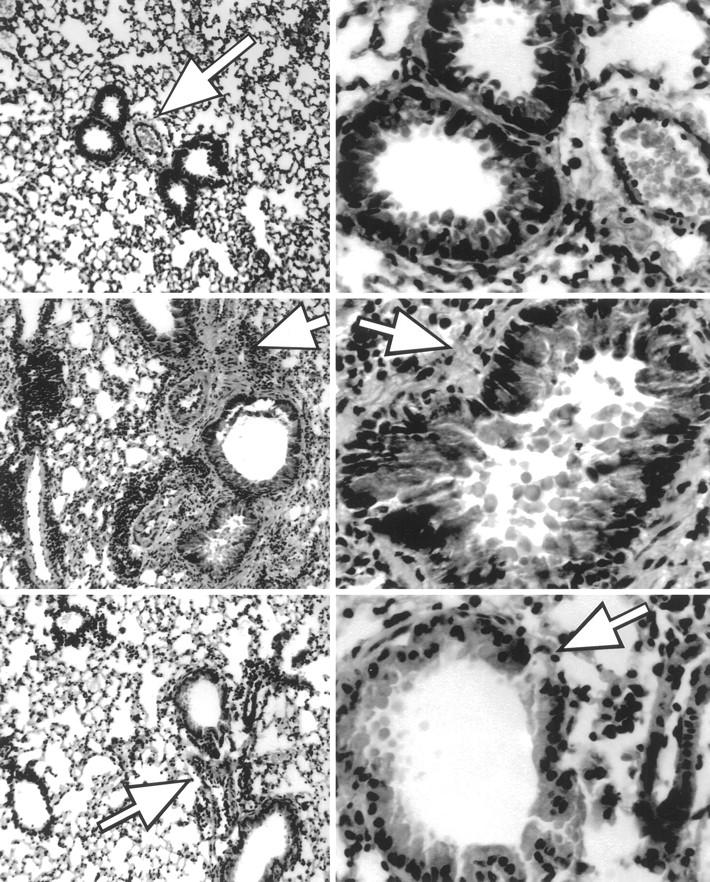
Lung histology from unexposed, 10-day acute OVA challenged, and 6-week chronic OVA challenged mice. Top panels: No evidence of histological damage was found in control unexposed animals or animals that received only the i.p. immunization protocol or the 10-consecutive-day inhalation protocol alone. Middle panels: The 10-day acute stage was characterized by dense peribronchial mixed inflammation consisting primarily of lymphoplasmacytic cells and eosinophils. Peribronchial muscle hypertrophy was also noted. Lower panels: The chronic-stage animals had mild to moderate peribronchial lymphoplasmacytic inflammation, mild peribronchial muscle hypertrophy, and slight to mild bronchial lining cell hyperplasia. Left panels are ×100 exposure; arrows demonstrate peribronchial areas. Right panels are ×400 exposures; arrows illustrate varied thickness of peribronchial smooth muscle between acute- and chronic-stage specimens.
Acute OVA Challenge Resulted in Airway Hyperresponsiveness to Methacholine, but This Response Resolved in the Chronic OVA Challenge Stage
Intravenous administration of methacholine elicited dose-dependent increases in RL measurements (Figure 4) ▶ over the dose range of 30 to 3000 μg/kg. This response was significantly potentiated by acute OVA challenge (P = 0.002 by repeated-measures ANOVA). Baseline resistance measurements did not vary among naive mice and mice exposed to OVA aerosols for 3, 5, 7, or 10 days, and maximal RL responses were similar in naive, 3-day, and 5-day OVA challenged animals. In contrast, the maximal RL response to methacholine was significantly increased after 7 and 10 days of exposure (12.5 ± 1.6 and 9.5 ± 0.7 cm H2O/ml/second, respectively; P < 0.01 each) compared with the control response in naive animals (6.7 ± 0.9 cm H2O/ml/second; Figure 4 ▶ ). Sensitivity to methacholine, as depicted by the interpolated concentration associated with RL equaling 270% of baseline, 23 increased nearly threefold with acute OVA challenge; however, sensitivity increased earlier than maximal responsiveness and returned to control values by 10 days of OVA aerosol challenge (Figure 5) ▶ .
Figure 4.

Lung resistance (RL) dose-response relationships in response to intravenous methacholine in naive, 7-day and 10-day OVA challenged mice. Anesthetized, mechanically ventilated mice received serially increasing concentrations of intravenous methacholine, and RL responses were recorded as described in the text. Methacholine elicited dose-dependent increases in RL in all mice. The response was significantly potentiated in 7-day OVA challenged mice (▵) and 10-day OVA challenged mice (□) relative to naive control mice (○). Data represent mean ± SEM values, with four to seven mice in each group.
Figure 5.

Sensitivity to intravenous methacholine in control and acute OVA challenged mice. Pulmonary sensitivity to methacholine was defined as the concentration eliciting an RL response 270% of baseline. Relative to the response in control animals (day 0), sensitivity significantly increased (lower provocative dose) in mice exposed to OVA aerosols for 3, 5, and 7 days. Sensitivity returned to control levels with 10 days of OVA aerosol challenge. Data represent mean + SEM values of three to seven animals/group; **significantly different response from day 0 (P < 0.01).
Aerosolized methacholine induced dose-dependent gas trapping in naive mice not exposed to OVA (Figure 6) ▶ . In unexposed mice, the ELGV value was significantly increased at nebulized methacholine concentrations of 30 mg/ml and 300 mg/ml versus deionized water alone. There was no significant difference in baseline lung volumes between the OVA exposed and unexposed mice. The 10-day OVA challenged mice had significant airway hyperreactivity relative to control animals, as evidenced by increased ELGV values at methacholine concentrations of 3 and 10 mg/ml (Figure 7) ▶ . The maximal ELGV response was observed at 10 mg/ml methacholine in the 10-day OVA challenged mice versus 30 mg/ml in unexposed mice. Sensitivity to methacholine, as characterized by the interpolated concentration of methacholine associated with an ELGV value 200% of baseline (an increase of >3 SDs), was increased over fivefold in 10-day OVA challenged mice (3.3 ± 0.6 mg/ml) compared with unexposed mice (17.5 ± 4.9 mg/ml; P < 0.05). An absence of airway hyperreactivity was noted in the chronic OVA challenged mice, in which gas trapping was not significantly different from control mice.
Figure 6.

Dose-response curve of excised gas lung volume (ELGV) in response to aerosolized methacholine in control (unexposed to ovalbumin) mice. Mice inhaled a single concentration of methacholine, and measurements of retained air were made on their excised lungs. Methacholine elicited dose-dependent air trapping in control mice, with significantly increased ELGV values at 30 and 300 mg/ml (P < 0.01). ELGV is expressed in terms of mg of air/kg of body weight; data represent mean ± SEM values, with three to six mice in each group.
Figure 7.

Excised gas lung volume (ELGV) in response to aerosolized methacholine in control, acute (10-day), and chronic (6-week) OVA challenged mice. Acute OVA mice (solid bars) had significantly increased ELGV values to 3 and 10 mg/ml methacholine, whereas chronic OVA mice (striped bars) were not different from control animals. Data represent mean + SEM values of three to five animals/group; *significantly different response (P < 0.05).
Changes in Airway Hyperreactivity between Acute and Chronic OVA Challenged Mice Were Paralleled by Differences in Serum IgE Levels
Serum IgE levels in nonimmunized control mice were <400 ng/ml and were significantly increased by the i.p. OVA immunization. An additional increase in serum IgE occurred during the acute OVA challenge period (Figure 8) ▶ . When compared with 1 day of aerosol exposure, significant differences in IgE concentrations were noted at days 5, 7, and 10 of acute OVA aerosol exposures. In contrast, total serum IgE levels in mice subjected to chronic exposure (35 days) was not significantly different from mice exposed to OVA for 1 day.
Figure 8.

Serum IgE concentrations in OVA immunized and challenged mice. Serum IgE was measured using a capture ELISA, as described in Materials and Methods. When compared with either unexposed (<400 ng/ml) or day 1 of aerosol ovalbumin exposure, significant increases in IgE levels were noted at days 5, 7, and 10 of acute exposure (**P ≤ 0.005; *P ≤ 0.05). Total serum IgE in mice subjected to chronic aerosol exposure (35 days) was not significantly different from mice exposed to OVA for 1 day. Data represent mean + SEM values for five to seven mice in each group.
Discussion
The pathophysiology of asthma has been extensively investigated and is now fairly well established. Nevertheless, mechanisms leading to the initial development of the asthmatic state and later to its spontaneous resolution remain to be elucidated. With this murine model, we have studied the natural progression of allergic airway disease, from acute exposure with inflammatory and hyperreactive airway disease to chronic exposure with diminished inflammation and normal airway responsiveness. In mice primed for a Th2 allergic response by intraperitoneal OVA immunization, the acute administration of OVA aerosols elicited progressive airway inflammation over a 10-day period. This inflammation included increased eosinophils and lymphocytes in BAL fluid, histological evidence of peribronchial and perivascular inflammation, and clustering of B and TCRγδ lymphocytes around airways. These histological findings were accompanied by elevations in serum IgE levels and the development of nonspecific airway hyperreactivity, as assessed both by lung resistance responses to intravenous methacholine and air trapping responses to aerosolized methacholine. Our findings are consistent with observations in other acute allergic murine models. 10-15 Levels of IL-4, IL-5, and IFN-γ were generally below detectable limits in unconcentrated BAL samples from our mice, as assayed by specific ELISA methods. Such allergen-induced eosinophilic inflammation and airway hyperreactivity have been shown to depend upon allergen-specific IgE, 13, 27 CD4+ T cells, 8, 9, 28 and the cytokines IL-4 29, 30 and IL-5. 8, 15, 31 However, this acute inflammatory response diminished over 3 to 6 weeks of continuous inhaled OVA exposure in our model. At 3 weeks, there were still significant BAL eosinophilia and IgE elevations. By 6 weeks, the BAL eosinophilia and airway hyperreactivity had resolved. Serum IgE was significantly decreased and approached naive levels in 75% of the mice. Thus, whereas acute OVA challenge elicited allergic inflammatory responses, chronic OVA challenge induced a suppressed or tolerant state in the mice.
The mechanisms underlying this progression of allergic to tolerant states are unknown. Our data show that the progression is associated with shifts in lymphocyte populations in the lung. Tissue immunofluorescence revealed clustering of both B and TCRγδ lymphocytes within peribronchial inflammatory lesions in the lungs of acute-stage animals. Although the contribution of B cells to allergic responses is well appreciated, this is the first direct demonstration that lung TCRγδ cells acutely increase upon allergen challenge. We were unable to identify either B or TCRγδ lymphocytes in inflammatory sites in chronic-stage animals. Based on their epitheliotropism, it has been suggested that TCRγδ cells may act as first responders in the lung to inhaled antigens. 32 Intraepithelial TCRγδ lymphocytes have been observed in increased number in the nasal mucosa of humans with allergic rhinitis 33 and in BAL fluid of severe asthmatic patients. 34 As TCRγδ cells have been shown to synthesize either Th2 or Th1 cytokines, 35 it is unclear whether they are playing a pro-inflammatory or suppressor role in these mice or in individuals with allergic airway disease. Recent observations of attenuated allergic airway inflammation in TCRγδ cell-deficient mice would support a pro-inflammatory role for these lymphocytes in the acute stage of this model. 36, 37 In contrast, Holt and colleagues 16 have demonstrated that TCRγδ lymphocytes isolated from the spleens of tolerant animals can suppress serum IgE responses to intraperitoneal antigen when transferred to naive recipient animals. Their studies suggest a suppressive role for TCRγδ cells in allergic diseases. At present, the specific contributions of TCRγδ lymphocytes in the acute allergic and chronic tolerant stages of inhaled antigen exposure remain to be elucidated.
In correlation with the tissue immunofluorescence, BAL lymphocyte profiles shifted between the acute allergic and chronic tolerant stages. In acute-stage (10-day) BAL fluid, the lymphocyte profile was 53% B cells, 12% TCRγδ cells, 21% CD4+ TCRαβ cells, and 9% CD8+ TCRαβ cells. Our CD4+:CD8+ T cell ratio of 2.3:1 is similar to the 3:1 to 4:1 ratio observed by others in acute OVA challenged C57BL/6J mice. 11 These BAL profiles changed dramatically with chronic (6-week) OVA challenge, such that the lymphocyte profile was 11% B cells, 7% TCRγδ cells, 28% CD4+ TCRαβ cells, and 46% CD8+ TCRαβ cells. It should be noted that the total number of lymphocytes was 17-fold less in the chronic than acute animals, reflecting the lesser degree of airway inflammation in these mice. Nevertheless, the establishment of chronic tolerance was associated with a dramatic change in the distribution of lymphocytes, with a fivefold increase in CD8+ TCRαβ cells and a fivefold decrease in B cells. These shifts occurred concurrently with a decrease in serum IgE levels.
The attenuation of serum IgE with chronic aerosol exposure in immunized mice is comparable to what has been observed in naive mice, in which repeated exposure to low levels of aerosolized OVA abrogates an IgE response to subsequent systemic OVA challenge. 16, 17 The mechanisms underlying this inhalational tolerance are unclear, as the process has been found to be both dependent 16,38 and independent 17 of IFN-γ, CD8+ lymphocytes, and TCRγδ cells. Genetic factors are likely involved, related to the ability of differing animal strains to mount IgE responses. 39 Far more work has been done regarding the analogous process of oral tolerance to ingested antigens. Oral tolerance probably occurs via multiple distinct mechanisms, 40 but at least one of these involves preferential stimulation of enteric CD8+ T cells. 41, 42 Our demonstration of an increase in the relative proportion of CD8+ TCRαβ lymphocytes in BAL of chronic OVA challenged animals suggest that these cells may also mediate the down-regulation of allergic airway responses. It may be that the persistence of TCRγδ cells in chronic BAL samples was associated with similar shifts in their CD4+:CD8+ ratios. Additional studies with mice lacking CD8+ or TCRγδ lymphocytes will further define the factors of airway inflammation and tolerance to repeated OVA exposure.
It should be emphasized that our mouse model, and specifically the chronic stage, is fundamentally different from those previously used to assess inhalational tolerance. Previous models were designed to promote tolerance and assessed the ability of inhaled antigen exposure to inhibit systemic IgE responses to subsequently administered intraperitoneal antigen. 16, 17 In contrast, our murine model characterizes the initial development of allergic airway sensitization to inhaled antigen in the presence of previous IgE generation with intraperitoneal antigen. It then goes on to determine the kinetics of this sensitization and the redevelopment of antigen tolerance with chronic inhalational exposure. Previous studies have relied solely upon immunoglobulin responses to detect sensitization or tolerance. We have extended these observations and have correlated IgE levels to airway eosinophil and lymphocyte profiles, lung inflammation, and airway hyperreactivity in an allergic pulmonary process similar to asthma.
Thus, we have followed the natural history of allergic airway inflammation in a murine model of asthma. We found that systemic immunization followed by aerosolized antigen challenge resulted in a breaking of normal homeostasis and the creation of allergic airway inflammation and airway hyperreactivity. This process persisted but was subsiding at 3 weeks of aerosol exposure. By 6 weeks, mice appeared to have regained their normal, homeostatic tolerant state, as defined by the disappearance of airway eosinophilia, a marked reduction in histological peribronchial inflammation, a decrease in serum IgE levels, and the resolution of airway hyperreactivity despite continued antigen exposure. This observation suggests that local regulatory mechanisms and/or other factors such as antigen redistribution can influence systemic sensitization to re-establish airway homeostasis. Coinciding with the acute inflammatory changes and their resolution was the sequential appearance and disappearance of peribronchial clusters of B cells and TCRγδ cells. We speculate that these clusters represent clonal expansion of B cells and pro-inflammatory TCRγδ cells with Th2-like cytokine characteristics. As the model progresses to the chronic stage, these lymphocytes disappear, perhaps through apoptotic mechanisms, leaving the lung with primarily suppressive lymphocyte populations. The persistence of CD8+ TCRαβ cells and TCRγδ cells in BAL of chronic challenged animals implicates these lymphocytes as mediators of the re-established airway homeostasis.
This study represents the first comprehensive characterization of the sequential progression of acute allergic airway inflammation and its subsequent resolution to a chronic antigen-tolerant state. This murine model allows us to study the mechanisms of the natural history of asthma, including the initial breaking of normal homeostasis, the peak allergic response, and the redevelopment of the normal tolerant state. Our observations provide an essential framework for additional, more mechanistic investigations focused on the association of various cells with pathophysiological events in the development and resolution of asthma. Most human subjects sensitized to an inhalational antigen remain sensitized for many years, often for life. Current asthma therapies are aimed at controlling airway inflammation and hyperresponsiveness, but at present we lack the ability to re-establish normal antigen homeostasis in asthmatic patients. Insights into the mechanisms of airway sensitization and tolerance gained with further use of this murine model may lead to the development of novel treatment strategies for the prevention or eradication of allergic airway disease and asthma.
Acknowledgments
We thank Ms. Sarah Fabian for technical assistance, Ms. Elizabeth G. Lingenheld for performing ELISAs, and Dr. John Morris, University of Connecticut (Storrs, CT) for determining our nebulizer aerosol size and output.
Footnotes
Address reprint requests to Dr. Roger S. Thrall, Department of Medicine, MC 1225, University of Connecticut Health Center, 263 Farmington Avenue, Farmington, CT 06030. E-mail: thrall@nso2.uchc.edu.
Supported by Career Investigator Award, American Lung Association (C.M. Schramm), Faculty Research Grant, University of Connecticut Health Center (C.M. Schramm), and grant DK51505 from the National Institutes of Diabetes and Digestive Diseases (L. Puddington).
Preliminary findings were presented at the American Thoracic Society International Conference and published in abstract form: Puddington L, Schramm CM, Yiamouyiannis CA, Thrall RS: Changes in gamma/delta T cell distributions in the acute allergic and chronic tolerant stages of an ovalbumin mouse model of asthma. Am J Respir Crit Care Med 1998, 157:A832.
References
- 1.Holt PG: Immunoregulation of the allergic reaction in the respiratory tract. Eur Respir J 1996, 9(Suppl 22):85s-89s [PubMed] [Google Scholar]
- 2.Coffman RL, Carty J: A T cell activity that enhances polyclonal IgE production and its inhibition by interferon-γ. J Immunol 1986, 136:949-954 [PubMed] [Google Scholar]
- 3.Vercelli D, Geha RS: Regulation of IgE synthesis in humans. J Clin Immunol 1989, 9:75-83 [DOI] [PubMed] [Google Scholar]
- 4.Kay AB: “Helper” (CD4+) T cells and eosinophils in allergy and asthma. Am Rev Respir Dis 1992, 145:S22-S26 [DOI] [PubMed] [Google Scholar]
- 5.Defrance T, Carayon P, Billian G, Guillemot JC, Minty A, Caput D, Ferrara P: Interleukin 13 is a B cell stimulating factor. J Exp Med 1994, 179:135-143 [DOI] [PMC free article] [PubMed] [Google Scholar]
- 6.Coffman RL, Seymour BWP, Lebman DA, Hiraki DD, Christiansen JA, Shrader B, Cherwinski HM, Savelkoul HF, Finkelman FD, Bond MW, Mosmann TR: The role of helper T cell products in mouse B cell differentiation and isotype regulation. Immunol Rev 1988, 102:5-28 [DOI] [PubMed] [Google Scholar]
- 7.McMenamin C, Holt PG: The natural immune response to inhaled soluble protein antigens involves major histocompatability complex (MHC) class I-restricted CD8+ T cell-mediated but MHC class II-restricted CD4+ T cell-dependent immune deviation resulting in selective suppression of immunoglobulin E production. J Exp Med 1993, 178:889-899 [DOI] [PMC free article] [PubMed] [Google Scholar]
- 8.Nakajima H, Iwamoto I, Tomoe S, Matsumura R, Tomioka H, Takatsu K, Yoshida S: CD4+ T-lymphocytes and interleukin-5 mediate antigen induced eosinophil infiltration into the mouse trachea. Am Rev Respir Dis 1992, 146:374-377 [DOI] [PubMed] [Google Scholar]
- 9.Gavett SH, Chen X, Finkelman F, Wills-Karp M: Depletion of murine CD4+ T lymphocytes prevents antigen-induced airway hyperreactivity and pulmonary eosinophilia. Am J Respir Cell Mol Biol 1994, 10:587-593 [DOI] [PubMed] [Google Scholar]
- 10.Kung TT, Jones H, Adams GK, III, Umland SP, Kreutner W, Egan RW, Chapman RW, Watnick AS: Characterization of a murine model of allergic pulmonary inflammation. Int Arch Allergy Immunol 1994, 105:83-90 [DOI] [PubMed] [Google Scholar]
- 11.Kennedy JD, Hatfield CA, Fidler SF, Winterrowd GE, Haas JV, Chin JE, Richards IM: Phenotypic characterization of T lymphocytes emigrating into lung tissue and the airway lumen after antigen inhalation in sensitized mice. Am J Respir Cell Mol Biol 1995, 12:613-623 [DOI] [PubMed] [Google Scholar]
- 12.Gonzalo J-A, Lloyd CM, Kremer L, Finger E, Martinez-A C, Siegelman MH, Cybulsky M, Gutierrez-Ramos J-C: Eosinophil recruitment to the lung in a murine model of allergic inflammation: the role of T cells, chemokines, and adhesion receptors. J Clin Invest 1996, 98:2332-2345 [DOI] [PMC free article] [PubMed] [Google Scholar]
- 13.Hamelmann E, Vella AT, Oshiba A, Kappler JW, Marrack P, Gelfand EW: Allergic airway sensitization induces T cell activation but not airway hyper-responsiveness in B cell-deficient mice. Proc Natl Acad Sci USA 1997, 94:1350-1355 [DOI] [PMC free article] [PubMed] [Google Scholar]
- 14.Ohkawara Y, Lei X-F, Stämpfli MR, Marshall JS, Xing Z, Jordana M: Cytokine and eosinophil responses in the lung, peripheral blood, and bone marrow components in a murine model of allergen-induced airways inflammation. Am J Respir Cell Mol Biol 1997, 16:510-520 [DOI] [PubMed] [Google Scholar]
- 15.Blyth DI, Pedrick MS, Savage TJ, Hessel EM, Fattah D: Lung inflammation and epithelial changes in a murine model of atopic asthma. Am J Respir Cell Mol Biol 1996, 14:425-438 [DOI] [PubMed] [Google Scholar]
- 16.McMenamin C, Pimm C, McKersey M, Holt PG: Regulation of IgE responses to inhaled antigen in mice by antigen-specific γδ T cells. Science 1994, 265:1869-1871 [DOI] [PubMed] [Google Scholar]
- 17.Seymour BWP, Gershwin LJ, Coffman RL: Aerosol-induced immunoglobulin (Ig)-E unresponsiveness to ovalbumin does not require CD8+ or T cell receptor (TCR)-γδ+ T cells or interferon (IFN)-γ in a murine model of allergic sensitization. J Exp Med 1998, 187:721-731 [DOI] [PMC free article] [PubMed] [Google Scholar]
- 18.Lowry OH, Rosebrough NJ, Farr AL, Randall RJ: Protein measurement with the Folin phenol reagent. J Biol Chem 1951, 193:265-275 [PubMed] [Google Scholar]
- 19.Kubo RT, Born W, Kappler JW, Marrack P, Pigeon M: Characterization of a monoclonal antibody which detects all murine αβ T cell receptors. J Immunol 1989, 142:2736-27422467936 [Google Scholar]
- 20.Goodman T, Lefrançois L: Intraepithelial lymphocytes. Anatomical site, not T cell receptor form, dictates phenotype and function. J Exp Med 1989, 170:1569-1581 [DOI] [PMC free article] [PubMed] [Google Scholar]
- 21.Sarmiento M, Glasebrook AL, Fitch FW: IgG or IgM monoclonal antibodies reactive with different determinants on the molecular complex bearing Lyt 2 antigen block T cell-mediated cytolysis in the absence of complement. J Immunol 1980, 125:2665-2672 [PubMed] [Google Scholar]
- 22.Thrall RS, Barton RW, D’Amato DA, Sulavik SB: Differential cellular analysis of bronchoalveolar lavage fluid obtained at various stages during the development of bleomycin-induced pulmonary fibrosis in the rat. Am Rev Respir Dis 1982, 126:488-492 [DOI] [PubMed] [Google Scholar]
- 23.Wolyniec WW, De Sanctis GT, Nabozny G, Torcellini C, Haynes N, Joetham A, Gelfand EW, Drazen JM, Noonan TC: Reduction of antigen-induced airway hyperreactivity and eosinophilia in ICAM-1-deficient mice. Am J Respir Cell Mol Biol 1998, 18:777-785 [DOI] [PubMed] [Google Scholar]
- 24.Stengel PW, Silbaugh SA: Reversal of A23187-induced airway constriction in the guinea pig. J Pharmacol Exp Ther 1989, 248:1084-1090 [PubMed] [Google Scholar]
- 25.Yiamouyiannis CA, Stengel PW, Cockerham SL, Silbaugh SA: Effect of bronchoconstrictive aerosols on pulmonary gas trapping in the A/J mouse. Respir Physiol 1995, 102:97-104 [DOI] [PubMed] [Google Scholar]
- 26.Stengel PW, Yiamouyiannis CA, Obenchain RL, Cockerham SL, Silbaugh SA: Methacholine-induced pulmonary gas trapping in guinea pigs, hamsters, mice, and rats. J Appl Physiol 1995, 79:2148-2153 [DOI] [PubMed] [Google Scholar]
- 27.Coyle AJ, Wagner K, Bertrand C, Tsuyuki S, Bews J, Heusser C: Central role of immunoglobin (Ig) E in the induction of lung eosinophil infiltration and T helper 2 cell cytokine production: inhibition by a non-anaphylactogenic anti-IgE antibody. J Exp Med 1996, 183:1303-1310 [DOI] [PMC free article] [PubMed] [Google Scholar]
- 28.Lambert LE, Berling JS, Kudlacz EM: Characterization of the antigen-presenting cell and T cell requirements for induction of pulmonary eosinophilia in a murine model of asthma. Clin Immunol Immunopathol 1996, 81:307-311 [DOI] [PubMed] [Google Scholar]
- 29.Lukacs N, Strieter R, Chensue S, Kunkel S: Interleukin-4 dependent pulmonary eosinophil infiltration in a murine model of asthma. Am J Respir Cell Mol Biol 1994, 10:526-532 [DOI] [PubMed] [Google Scholar]
- 30.Kips JC, Brusselle GG, Joos GF, Peleman RA, Devos RR, Tavernier JH, Pauwels RA: Importance of interleukin-4 and interleukin-12 in allergen-induced airway changes in mice. Int Arch Allergy Immunol 1995, 107:115-118 [DOI] [PubMed] [Google Scholar]
- 31.Foster PS, Hogan SP, Ramsay AG, Matthaei KI, Young IG: Interleukin 5 deficiency abolishes eosinophilia, airways hyperreactivity, and lung damage in a mouse asthma model. J Exp Med 1996, 183:195-201 [DOI] [PMC free article] [PubMed] [Google Scholar]
- 32.Spinozzi F, Agea E, Bistoni O, Forenza N, Bertotto A: γδ T cells, allergen recognition and airway inflammation. Immunol Today 1998, 19:22-26 [DOI] [PubMed] [Google Scholar]
- 33.Pawankar RU, Okuda M, Suzuki K, Okumura K, Ra C: Phenotypic and molecular characteristics of nasal mucosal γ/δ T cells in allergic and infectious rhinitis. Am J Respir Crit Care Med 1996, 153:1655-1665 [DOI] [PubMed] [Google Scholar]
- 34.Spinozzi F, Agea E, Bistoni O, Forenza N, Monaco A, Bassotti G, Nicoletti I, Riccardi C, Grignani F, Bertotto A: Increased allergen specific, steroid-sensitive γ/δ T cells in bronchoalveolar lavage from patients with asthma. Ann Intern Med 1996, 124:223-227 [DOI] [PubMed] [Google Scholar]
- 35.Ferrick DA, Schrenzel MD, Mulvania T, Hsieh B, Ferlin WG, Lepper H: Differential production of interferon-γ and interleukin-4 in response to Th1 and Th2 stimulating pathogens by γ/δ T cells in vivo. Nature 1995, 373:255-257 [DOI] [PubMed] [Google Scholar]
- 36.Yiamouyuannis C, Schramm CM, Lefrançois L, Stengel P, Thrall RS: γδ-T cell knock-out mice exhibit reduced airway eosinophilia in an asthma model. Am J Respir Crit Care Med 1997, 155:A736 [Google Scholar]
- 37.Zuany-Amorim C, Ruffié C, Hailé S, Vargaftig BB, Pereira P, Pretolani M: Requirement for γδ T cells in allergic airway inflammation. Science 1998, 280:1265-1267 [DOI] [PubMed] [Google Scholar]
- 38.McMenamin C, McKersey M, Kühnlein P, Hünig T, Holt PG: γδ T cells down-regulate primary IgE responses in rats to inhaled soluble protein antigens. J Immunol 1995, 154:4390-4394 [PubMed] [Google Scholar]
- 39.Holt PG, Britten D, Sedgwick JD: Suppression of IgE responses by antigen inhalation: studies on the role of genetic and environmental factors. Immunology 1987, 60:97-102 [PMC free article] [PubMed] [Google Scholar]
- 40.Strobel S, Mowat AMcl: immune responses to dietary antigens: oral tolerance. Immunol Today 1998, 19:173–181 [DOI] [PubMed]
- 41.Bland P: MHC class II expression by the gut epithelium. Immunol Today 1988, 9:174-178 [DOI] [PubMed] [Google Scholar]
- 42.Mayer L, Panja A, Li Y, Siden E, Pizzimenti A, Gerardi F, Chandswang N: Unique features of antigen presentation in the intestine. Ann NY Acad Sci 1992, 664:39-46 [DOI] [PubMed] [Google Scholar]