

Abstract
T cell immunodeficiency plays an important role in the pathogenesis of posttransplant lymphoproliferative disease (PTLD) by permitting the unbridled expansion of Epstein-Barr virus (EBV)-infected B lymphocytes. However, factors other than T cell function may contribute to PTLD pathogenesis because PTLD infrequently develops even in the context of severe T cell immunodeficiency, and athymic mice that are T-cell-immunodeficient can reject EBV-immortalized cells. Here we report that PTLD tissues express significantly lower levels of IL-18, interferon-γ (IFN-γ), Mig, and RANTES compared to lymphoid tissues diagnosed with acute EBV-induced infectious mononucleosis, as assessed by semiquantitative RT-PCR analysis. Other cytokines and chemokines are expressed at similar levels. Immunohistochemistry confirmed that PTLD tissues contain less IL-18 and Mig protein than tissues with infectious mononucleosis. IL-18, primarily a monocyte product, promotes the secretion of IFN-γ, which stimulates Mig and RANTES expression. Both IL-18 and Mig display antitumor activity in mice involving inhibition of angiogenesis. These results document greater expression of IL-18, IFN-γ, Mig, and RANTES in lymphoid tissues with acute EBV-induced infectious mononucleosis compared to tissues with PTLD and raise the possibility that these mediators participate in critical host responses to EBV infection.
Epstein-Barr virus (EBV) is a ubiquitous herpesvirus that infects asymptomatically most adults.1,2 Primary EBV infection is occasionally associated with acute infectious mononucleosis, a syndrome of lymphadenopathy, sore throat, and fatigue that usually resolves rapidly. After primary infection, EBV infection persists, probably for life. Both during primary infection and the subsequent long-lasting carrier state, EBV infection is mostly limited to the B lymphocyte compartment, where infection is latent, and the oropharyngeal epithelium, where some level of viral replication occurs. Over the last two decades, considerable evidence has accumulated supporting a critical role of T lymphocytes in the control of EBV infections.3,4 Immune T cells can effectively kill EBV-infected B lymphocytes and endothelial cells expressing certain EBV-specific proteins, thereby reducing the pool of EBV-infected cells. They can also regulate the growth and survival of EBV-infected cells by secretion of interferons and other regulatory compounds.2 As a result, EBV infection remains circumscribed to a minority of cells, despite the high transforming capacity of the virus.
This fine balance between EBV and the immune system is subverted in the context of severe and protracted states of T cell immunodeficiency, such as those associated with solid organ or stem cell transplantation. In this context, diminished T cell immunity allows for the unbridled proliferation of EBV-transformed B lymphocytes resulting in posttransplant lymphoproliferative disease (PTLD).2 The reduction of immunosuppressive therapies and infusion of T lymphocytes have occasionally been associated with resolution of PTLD.5-9 Thus, unlike the pathogenesis of most other malignancies, for which some mechanism of cellular escape is central to the transformation process, diminished T cell immunity for the EBV-infected cells appears to be the key to the pathogenesis of PTLD.
The reported frequencies of PTLD development in severe states of protracted T cell immunodeficiency range between 0.8 and 20%.10-12 Although EBV- seronegative status of the recipient, use of OKT3 monoclonal antibodies, and cytomegalovirus infection have all been identified as risk factors for PTLD development posttransplant,13-15 our current understanding of the pathogenesis of PTLD in the context of severe T cell immunodeficiency is incomplete. Recently, we and others have investigated an in vivo model in which the subcutaneous inoculation of EBV-immortalized cells into T-cell-deficient athymic mice results in the formation of tumors that regress fully.16,17 This reproducible result suggests that even in the context of T cell deficiency, EBV-immortalized cells can be rejected by effective host responses. The murine CXC chemokines IP-10 and Mig, which are induced in the host by the EBV-immortalized cells, play an important role in promoting tumor regression in this model.18,19 Other murine cytokines and chemokines also are induced by the EBV-immortalized cells, but either have displayed minimal antitumor effects17 or their contribution to tumor regression has not been explored.
With the goal of identifying factors other than T cells that might regulate PTLD development, we compared patterns of cytokine and chemokine gene expression in lymphoid tissues from patients with acute EBV-induced infectious mononucleosis, PTLD tissues, and tissues with reactive lymph node hyperplasia. The experimental results show that IL-18 expression, as well as the expression of the downstream mediators Mig and RANTES, are significantly reduced in PTLD tissues compared to lymphoid tissues from patients with EBV-induced infectious mononucleosis.
Materials and Methods
Case Selection
Tissue specimens from patients with infectious mononucleosis and reactive lymphoid hyperplasia were obtained from the files of Dr. Jaffe at the Hematopathology Section, Laboratory of Pathology, National Cancer Institute, National Institutes of Health (Bethesda, MD). The diagnosis of infectious mononucleosis was made on the basis of compatible clinical and laboratory features, and on the detection of EBV-encoded small RNAs (EBER-1)-positive cells in lymphoid tissue specimens displaying characteristic morphology. Tissue specimens from PTLD patients were obtained from the files of Drs. N. Harris and J. Ferry at the Department of Pathology, Massachusetts General Hospital, Harvard University Medical School (Boston, MA).20,21 The diagnosis of PTLD was made in solid organ transplant patients with compatible clinical features on the basis of characteristic histological features22 and the detection of EBV (EBER-1)-positive cells. Cases included infectious mononucleosis (n = 8), reactive lymphoid hyperplasia (n = 6), and PTLD (n = 11). The PTLD cases were further classified on the basis of morphology as monomorphic (n = 6) and polymorphic (n = 5). The clinical and histological features of some of these cases have been reported in detail previously. Pertinent selected information relating to each tissue sample is listed in Table 1▶ .
Table 1.
Patient Demography, Tissue Samples and EBV Status
| Patient | Age, sex | Biopsy site | EBV | Clonality |
|---|---|---|---|---|
| Reactive Lymphoid Hyperplasia | ||||
| RLH-1 | 59 , F | LN, Neck | − | |
| RLH-2 | 38 , F | LN, Inguinal | − | |
| RLH-3 | 12 , M | LN, Neck | − | |
| RLH-4 | 57 , F | LN, Cervical | − | |
| RLH-5 | 40 , M | LN, Cervical | − | |
| RLH-6 | 16 , M | LN, Cervical | − | |
| Infectious Mononucleosis | ||||
| IM-1 | 18 , M | LN, axilla | + | Polyclonal |
| IM-2 | 28 , M | LN, R inguinal | + | Polyclonal |
| IM-3 | 4 , M | Tonsil | + | n.d. |
| IM-4 | 37 , F | Tonsil | + | Polyclonal |
| IM-5 | 6 , M | Nasopharynx | + | Polyclonal |
| IM-6 | 24 , F | Tonsil | + | Polyclonal |
| IM-7 | 19 , M | Cervical LN | + | Polyclonal |
| IM-8 | 17 , F | Tonsil | + | Polyclonal |
| Posttransplant Lymphoproliferative Disease Polymorphous | ||||
| PTLD-P1 | 60 , F | Stomach | + | Monoclonal |
| PTLD-P2 | 64 , M | CNS | + | Monoclonal w/ Polyclonal background |
| PTLD-P3 | 8 , F | Tonsils | + | Monoclonal |
| PTLD-P4 | 52 , M | Supraclavicular node | + | Monoclonal |
| PTLD-P5 | 64 , M | Soft Tissue, arm | + | Monoclonal |
| PTLD-P6 | 35 , M | LN, cervical | + | Monoclonal |
| Monomorphous | ||||
| PTLD-M1 | 56 , F | Colon | + | Monoclonal |
| PTLD-M2 | 60 , M | CNS | + | Monoclonal |
| PTLD-M3 | 8 , M | LN | + | Monoclonal |
| PTLD-M4 | 52 , F | Tonsil | + | Monoclonal |
| PTLD-M5 | 39 , M | Lung | + | Monoclonal |
LN, lymph node; n.d., not done; CNS, central nervous system.
EBV in Situ Hybridization
In situ hybridization used an EBV probe specific for EBER, using an automated system (Ventana Medical Systems, Tucson, AZ), as described previously.23
Reverse Transcriptase-Mediated Polymerase Chain Reaction (RT-PCR)
RNA extraction from paraffin-embedded tissue and subsequent PCR amplification were performed essentially as described previously.24 Briefly, RNA was extracted from paraffin-embedded tissues sections 20 mm thick that were deparaffinized in xylene and ethanol. RT-PCR was performed with appropriate modifications for highly degraded RNA obtained from paraffin-embedded tissue. Briefly, RNA samples were treated with DNase (GIBCO/BRL Life Technologies, Gaithersburg, MD), then subjected to an initial assay for amplifiable contaminating genomic DNA using primers specific for glyceradehyde-3-phosphate dehydrogenase (G3PDH) mRNA. Positive samples were re-treated with DNase. Negative samples (2–5 mg) were reverse transcribed using an RNase H-RT (Superscript, GIBCO/BRL). The resultant cDNA (25–100 ng) was amplified as previously described.24 The amount of cDNA used for each amplification reaction was based for each sample on the results of PCR for G3PDH showing equivalent amounts of product amplified from all samples. The selection of G3PDH was based on the observation that G3PDH mRNA is not known to vary in human tissues depending on disease status. Primers, listed in Table 2▶ , were designed for amplification of short amplicons (80–130 bp) from highly degraded RNA and spanned at least one splice junction. Genomic DNA could be distinguished from mRNA or cDNA. Amplifications were performed in a thermocycler (Stratagene Robocycler, La Jolla, CA) adding 1.25 U Taq polymerase (GIBCO/BRL) after heating at 94°C for 3 minutes (hot start), followed by a predetermined number of amplification cycles (94°C for 45 seconds at primer annealing temperature specified in Table 2▶ , extension at 72°C), and maintained at 4°C until analysis. The number of amplification cycles was determined experimentally for each primer pair to fit the linear part of the sigmoid curve reflecting the relationship between the number of amplification cycles and amount of PCR product. PCR products were detected by quantitating incorporated 32P-labeled nucleotides [α-32P]dCTP (specific activity of ∼3000 Ci/mmol) obtained from Amersham (Arlington Heights, IL). The entire amplification reaction (50 μl) was analyzed by electrophoresis on 8% acrylamide (Long Ranger, AT Biochem, Malvern, PA) Tris-borate EDTA gels (polyacrylamide gel electrophoresis), followed by autoradiography and quantitation by phosphorimage analysis using ImageQuant v3.3 software (Molecular Dynamics, Sunnyvale, CA). Band integrations were obtained as the sum of values for all pixels after subtraction of background (areas around each sample). Integrated values for each sample were then normalized for the results of parallel RT-PCR amplification for G3PDH expressed as pixels. The results of RT-PCR analysis are presented as absolute numbers of normalized arbitrary units (pixels)/sample. The ability of the RT-PCR assay to detect quantitative differences in mRNA for each gene product was assessed in experiments where the input cDNA derived from RNA extracted from paraffin embedded tissues was first serially diluted (100 ng-1 ng) and then subjected to PCR amplification. Using paraffin-embedded tissues positive for a given gene product along with appropriate negative controls, we verified that the intensity of the PCR product correlated with the dilution of input cDNA in the range used for PCR (25–100 ng). Variability of results from different experiments was minimized by use of standard control RNA preparations in parallel PCR. Experiments were considered evaluable only if standard control PCR results were within 15% of the mean.
Table 2.
Primers and Selected PCR Conditions
| PCR product | Genbank accession no. | Primer sequence (5′→3′) | Product size | Cycles | Temperature* (°C) |
|---|---|---|---|---|---|
| INF-γ | V00536 | GGACCCATATGTAAAAGAAGCAGA | 121 | 35 | 57 |
| TGTCACTCTCCTCTTTCCAATTCT | |||||
| Mig | X72755 | TTCCTCTTGGGCATCATCTTGCTG | 123 | 35 | 61 |
| GGTCTTTCAAGGATTGTAGGTGGA | |||||
| RANTES | M21121 | GGCACGCCTCGCTGTCATCCTCA | 130 | 35 | 65 |
| CTTGATGTGGGCACGGGGCAGTG | |||||
| IP-10 | X02530 | GGAACCTCCAGTCTCAGCACC | 108 | 35 | 57 |
| GCGTACGGTTCTAGAGAGAGGTAC | |||||
| Mip1-α | M25315 | CTCTGCACCATGGCTCTCTGCAAC | 87 | 35 | 62 |
| TGTGGAATCTGCCGGGAGGTGTAG | |||||
| TNF-α | M10988 | TCAGCTTGAGGGTTTGCTACAA | 81 | 35 | 59 |
| TCTGGCCCAGGCAGTCAGATC | |||||
| IL-6 | Y00081 | AGGAGCCCAGCTATGAACTCCTTC | 114 | 35 | 61 |
| TGGAATCTTCTCCTGGGGGTACTG | |||||
| IL-10 | U16720 | CTTCGAGATCTCCGAGATGCCTTC | 121 | 35 | 59 |
| GGATCATCTCAGACAAGGCTTGGC | |||||
| vIL10 | V01555 | ATGGAGCGAAGGTTAGTGGTCACT | 113 | 35 | 51 |
| CTTAGGTCCTCTAACATTTGGGGA | |||||
| hIL18 | D49949 | ATGGCTGCTGAACCAGTAGAAGAC | 116 | 35 | 61 |
| GCCAAAGATATCTGATTCGAAG | |||||
| IL12p35 | M65291 | GTCTGCATCCAGCGGCTCGCCCTG | 89 | 35 | 66 |
| GGGTAGCGACAAGGAGGAGGCTGC | |||||
| IL12p40 | M65290 | GGCCCAGAGCAAGATGTGTCACCA | 144 | 40 | 65 |
| TCTCCAGGGGCATCCGGATACCAA | |||||
| G3PDH | M33197 | GCCACATCGCTAAGACACCATGGG | 78 | 35 | 59 |
| CCTGGTGACCAGGCGCCCAAT |
PCR, polymerase chain reaction; G3PDH, glyceraldehyde-3-phophate dehydrogenase; IP-10, interferon-γ-inducible protein-10; Mig, monokine induced by interferon-γ; INF-γ, interferon-γ; IL12p35, interleukin-12 subunit p35; IL12p40, interleukin 12 subunit p40; MIP-1α, macrophage inflammatory protein-1 α; TNF-α, tumor necrosis factor-α; hIL6, human interleukin-6; hIL10, human interleukin-10; vIL10, viral interleukin-10; hIL18, human interleukin-18; RANTES, regulated upon activation, normal T expressed and secreted.
*Annealing temperature.
Immunohistochemistry
Immunohistochemical reactions using anti-human IL-18, anti-Mig, and anti-CD56 antibodies were performed as previously described.24 Briefly, tissue sections were first treated with Target Retrieval Solution (DAKO Corp., Carpenteria, CA) in a microwave pressure cooker (Nordic Ware, Minneapolis, MN) at maximum power (800 W) for 40 minutes and slides were placed in the hot buffer for additional 8 minutes. The sections were then washed in 0.05 mol/L Tris-HCl saline (TBS, pH 7.6) containing 5% fetal calf serum (GIBCO Laboratories, Grand Island, NY) for at least 30 minutes, and then incubated with primary antibodies overnight at room temperature. Rabbit anti-human Mig antiserum (a generous gift from Dr. J. Farber, National Institute of Allergy and Infectious Diseases, Bethesda, MD) was used at 1:320 dilution and rabbit anti-human IL-18 antibody (Peprotech, Rocky Hill, NJ) was used at 1:3200 dilution. Anti-human CD56 antibody (Novocastra, Vector Laboratories, Burlingame, CA) was used at 1:100 dilution. Antibody dilutions were made in Diluent Buffer (DAKO). Bound antibodies were detected with a biotin-conjugated universal secondary antibody formulation which recognizes rabbit and mouse immunoglobulins (Ventana Medical Systems). The slides were incubated with an avidin-horseradish peroxidase conjugate and the enzyme complex was visualized by addition of 3,3′-diaminobenzidine tetrachloride and copper sulfate.
Determination of Clonality
Ig heavy chain gene rearrangement was evaluated by PCR using primers for framework region 3 of the Ig heavy chain gene (VJ-PCR). The products were analyzed by acrylamide gel electrophoresis as described.25
Statistical Analysis
The geometric means and standard errors of the mean (SE) were derived using conventional formulas. Significance of group differences was determined by analysis of variance in three-way comparisons. When analysis of variance indicated overall significance (P < 0.05), pairwise comparisons were made using Tukey-Kramer test method. Pairwise comparisons were statistically different at the P = 0.05 level.
Results
To assess cytokine and chemokine gene expression, total RNA was extracted from formalin-fixed, paraffin-embedded tissues involved with PTLD (11 cases) or with infectious mononucleosis (8 cases). In situ hybridization for the EBERs demonstrated the presence of EBV infection in all specimens with PTLD and infectious mononucleosis (Table 1)▶ . Control RNA was extracted from formalin-fixed, paraffin-embedded tissues representative of reactive lymphoid hyperplasia (6 cases). All cases of reactive lymphoid hyperplasia tested EBV-negative by EBER-1 in situ hybridization.
Previous experiments have demonstrated that the regression of experimental human lymphomas in athymic mice is associated with increased expression of murine IL-6, TNF-α, IFN-γ, IP-10, Mig, and RANTES in the tumor tissues when compared to controls that grow progressively in this model system.17,18 Expression of murine Mip-1α, Mip-1β, and JE/MCP-1 was similar in these lymphomas, regardless of their outcome.18 Also, injection of IP-10 or Mig into progressively growing human lymphomas established in nude mice caused extensive tumor necrosis, whereas inoculation of TNF-α alone or in conjunction with IL-6 had minimal effects.17-19 Using a semiquantitative RT-PCR analysis, the PCR products of IFN-γ, Mig, RANTES, and IP-10 appeared to be more abundant in infectious mononucleosis compared to PTLD tissues. In contrast, the PCR products of Mip-1α, TNF-α, and IL-6 were variable in infectious mononucleosis and PTLD tissues (representative results shown in Figure 1▶ ). Quantitative analysis of RT-PCR test results (Figure 2A)▶ confirmed that, on average, levels of expression of IFN-γ, Mig, and RANTES were significantly higher in infectious mononucleosis tissues compared to PTLD tissues (P < 0.05). In contrast, levels of expression of IP-10, Mip1-α, TNF-α, and IL-6 (Figure 2B)▶ were not significantly different in these groups (P > 0.05).
Figure 1.

Patterns of cytokine and chemokine mRNA expression in PTLD tissues and tissues with EBV-induced infectious mononucleosis. Total cellular RNA extracted from paraffin-embedded tissues representative of PTLD and infectious mononucleosis was subjected to RT-PCR analysis using appropriate primers. The results shown for 4 PTLD and 4 infectious mononucleosis cases were selected as representative of the PTLD (n = 11) and infectious mononucleosis (n = 8) cases studied.
Figure 2.
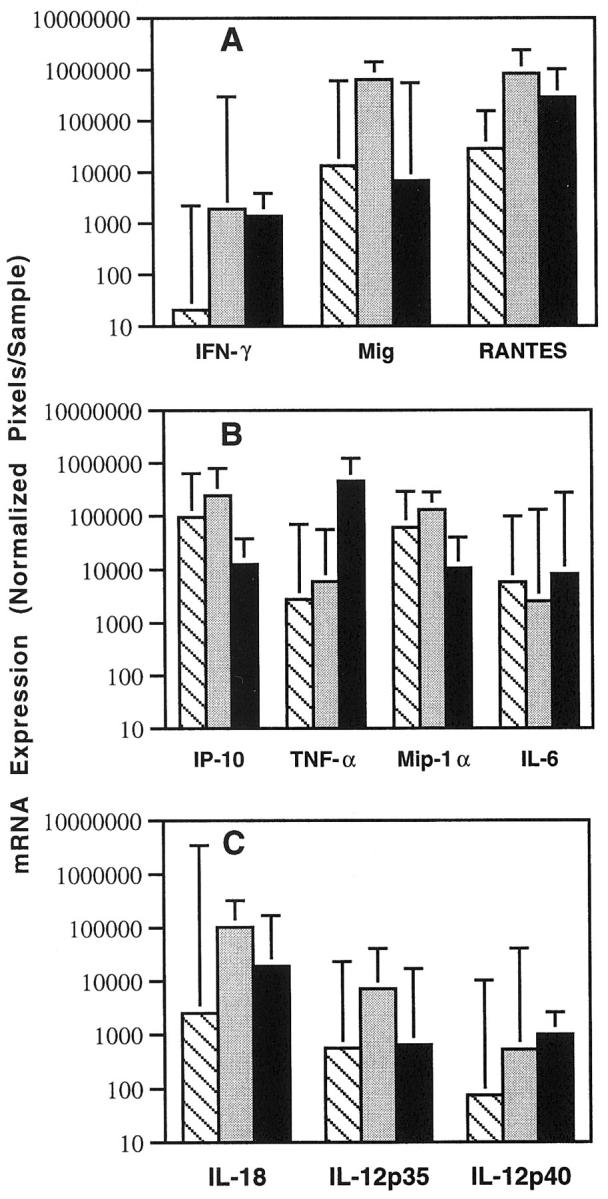
Levels of IFN-γ, cytokine, and chemokine mRNA expression in lymphoid tissues representative of PTLD, infectious mononucleosis, and reactive lymphoid hyperplasia. Total cellular RNA was extracted from 11 cases diagnosed as PTLD, 8 cases diagnosed with EBV-induced infectious mononucleosis, and 6 cases diagnosed as reactive lymphoid hyperplasia, and subjected to RT-PCR analysis for the indicated mRNAs. After normalization, the results of phosphorimage analysis were plotted logarithmically as the geometric group means (×/÷ SE) of arbitrary units (pixels) for each cytokine/chemokine. A: Results of RT-PCR analysis for IFN-γ, Mig, and RANTES mRNAs. Mean levels of expression were significantly higher in infectious mononucleosis compared to PTLD. B: Results of RT-PCR analysis for IP-10, TNF-α, Mip-1α, and IL-6 mRNAs. Mean levels of expression were not significantly different in infectious mononucleosis and PTLD. C: Results of RT-PCR analysis for IL-18, IL-12p35, and IL12p40 mRNAs. Mean levels of IL-18 were significantly higher in infectious mononucleosis compared to PTLD. ▧, PTLD; ░⃞, infectious mononucleosis; ▪, reactive lymphoid hyperplasia.
When compared to tissues with reactive lymphoid hyperplasia (Figure 2, A and B)▶ , expression of Mig and IP-10 was significantly higher in infectious mononucleosis tissues compared to tissues with reactive lymphoid hyperplasia (P < 0.05), but levels of expression of IFN-γ and RANTES were not significantly different. In addition, although infectious mononucleosis and PTLD tissues did not differ significantly from each other with respect to Mip-1α and TNF-α expression, tissues with reactive lymphoid hyperplasia expressed significantly higher levels of TNF-α and significantly lower levels of Mip-1α compared to either infectious mononucleosis or PTLD groups (P < 0.05 in each case).
Because IL-12 and IL-18 are cytokines known to promote IFN-γ expression,26-28 we tested whether higher level expression of IFN-γ and the IFN-γ-inducible chemokine Mig was associated with increased expression of these cytokines. We found that IL-18 expression was significantly higher (P < 0.05) in infectious mononucleosis compared to PTLD tissues (Figure 2C)▶ . Although IL-18 expression was somewhat higher in infectious mononucleosis compared to reactive lymphoid hyperplasia, the difference was not statistically significant. In addition, levels of IL-12 p35 and p40 expression were not different among the infectious mononucleosis, PTLD, and reactive lymphoid hyperplasia groups (P = 0.18 and P = 0.4, respectively).
Previous studies have identified human IL-10 (hIL-10) as being an autocrine growth factor for EBV-immortalized cells and an inhibitor of T cell immunity.29-31 hIL-10 and/or viral IL-10 (vIL-10), a product of the EBV lytic cycle,29 have been reported to be abnormally high in the blood of patients with acute EBV-induced infectious mononucleosis and in some patients with PTLD.32,33 We found hIL-10 expression to be significantly higher in acute infectious mononucleosis tissues compared to tissues with PTLD (P < 0.05) or reactive lymphoid hyperplasia (P < 0.05). By contrast, levels of hIL-10 expression were similar in PTLD and reactive lymphoid hyperplasia tissues (Figure 3)▶ . Consistent with results showing that vIL-10 is a product of the EBV lytic cycle29 and that EBV infection is mainly latent in lymphoid cells,2 we found levels of vIL-10 expression to be similar in lymphoid tissues positive for infectious mononucleosis and PTLD.
Figure 3.

Levels of human IL-10 and viral IL-10 mRNA expression in lymphoid tissues representative of PTLD (11 cases), infectious mononucleosis (8 cases), and reactive lymphoid hyperplasia (6 cases). The results reflect the geometric mean values (×/÷ SE) of arbitrary units (pixels). ▧, PTLD; ░⃞, infectious mononucleosis; ▪, reactive lymphoid hyperplasia.
PTLD tissues can often be distinguished into monomorphous and polymorphous subtypes based on histological criteria.22 We found levels of IL-18, IFN-γ, IP-10, Mig, RANTES, Mip-1α, IL-6, TNF-α, IL-12 p35, and IL-12 p40 expression to be somewhat higher in PTLD tissues with polymorphic as opposed to monomorphous histology (Figure 4)▶ . However, the difference reached statistical significance only for RANTES (P < 0.05), probably due to the small sample size.
Figure 4.

Levels of IFN-γ, cytokine, and chemokine mRNA expression in PTLD tissues representative of polymorphous (5 cases) and monomorphous (6 cases) PTLD. The results reflect the geometric mean values (×/÷ SE) of arbitrary units (pixels).
Paraffin-embedded sections sequential to those used for RNA extractions were stained with rabbit antisera directed at IL-18 and Mig. Staining for these cytokines was selected on the basis of RT-PCR results showing a significant difference between infectious mononucleosis and PTLD tissues in the expression of these cytokines. All infectious mononucleosis tissues studied (n = 8) stained positively for IL-18 and Mig, albeit with various levels of intensity (representative staining is depicted in Figure 5▶ ). In contrast, none of the PTLD (n = 10) or reactive lymphoid hyperplasia tissues (n = 6) stained positive for the same molecules (Figure 5)▶ . These results are consistent with those from semiquantitative RT-PCR analysis, and confirm that selective cytokines and chemokines are induced more prominently in lymphoid tissues with infectious mononucleosis as opposed to PTLD or reactive lymphoid hyperplasia.
Figure 5.
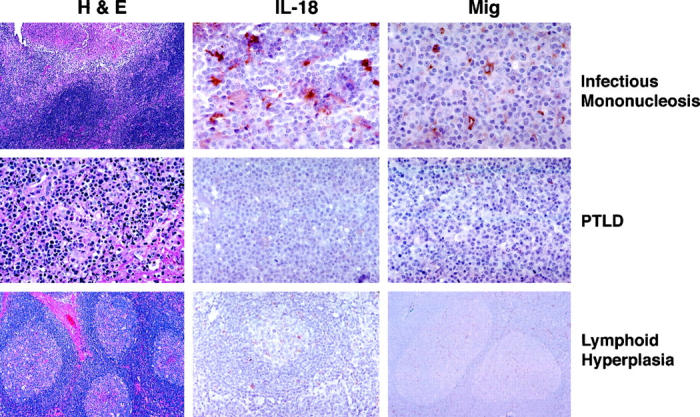
Immunohistochemical analysis of IL-18 and Mig protein expression in lymphoid tissues representative of PTLD, EBV-induced infectious mononucleosis, and reactive lymphoid hyperplasia. The left panels reflect hematoxylin-eosin stain; the middle panels reflect staining for IL-18; and the right panels reflect staining for Mig. Original magnifications: infectious mononucleosis, ×10, ×63, and ×63 (left to right); PTLD, ×40; lymphoid hyperplasia, ×20.
Because the differences in IFN-γ, Mig, and RANTES expression in PTLD lymphoid tissues and those from patients with infectious mononucleosis could be explained on the basis of a difference in NK cells residing in these tissues, we looked for NK cells. By immunohistochemistry (Figure 6)▶ , CD56-positive cells were not identified in PTLD tissues (n = 10). In contrast, 4 or 5 CD56-positive cells were identified in each high powered field from lymphoid tissues of patients with EBV-induced infectious mononucleosis (n = 9).
Figure 6.
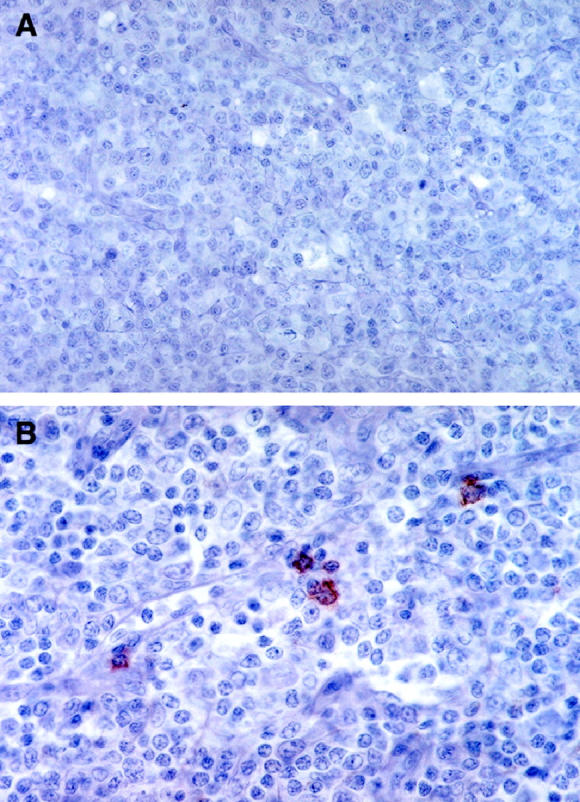
Detection of NK cells in lymphoid tissues representative of PTLD and infectious mononucleosis by immunohistochemistry with anti-CD56 antibodies. A: PTLD tissue (original magnification, ×40); B: Lymphoid tissue from a patient with infectious mononucleosis (original magnification, ×63).
Discussion
In the current study, we have examined potential differences in cytokine and chemokine expression in lymphoid tissues from acute EBV-induced infectious mononucleosis and PTLD. Both conditions reflect EBV-induced B cell lymphoproliferative diseases. Infectious mononucleosis, however, is a self-limited illness associated with a brisk T cell response, whereas PTLD is often lethal and is associated with a profound T cell immunodeficiency. The relatively rare occurrence of PTLD, with a reported frequency of 0.8 to 20% of solid organ transplant recipients,11,29,34 suggests that factors other than T cell immunodeficiency may contribute to PTLD pathogenesis. We have focused on certain cytokines and chemokines that had emerged as potentially important in regulating the growth of EBV-immortalized cells in athymic mice that are T-cell-immunodeficient. In this experimental murine model, expression of murine TNF-α, IL-6, IFN-γ, IP-10, Mig, and RANTES was significantly increased in lymphoma tissues that necrose and progressively regress, compared to those lymphomas that grow progressively and eventually kill the animal.18 However, the expression of murine IL-12 p40, Mip-1α, Mip-1β, or JE/MCP-1 was similar.18 In addition, the inoculation of IP-10 or Mig chemokines caused significant necrosis in lymphomas otherwise destined to grow progressively in athymic mice.18,19 By contrast, the inoculation of TNF-α, alone or in conjunction with IL-6, had minimal effect on tumor growth.17 Consistent with these results in the mouse, we now show that expression of IL-18, IFN-γ, Mig, and RANTES is significantly higher in lymphoid tissues from infectious mononucleosis patients compared to tissues with PTLD. We also show that expression of IL-12 p35, IL-12 p40, IP-10, Mip1-α, TNF-α, and IL-6 is not significantly different in the same groups. These results raise the possibility that increased production of certain cytokines and chemokines is part of a host response to virally infected cells that may contribute to the successful resolution of acute infectious mononucleosis. Failure to mount this response may contribute to PTLD pathogenesis.
T cell deficiency in PTLD, particularly deficiency of EBV-specific T cell immunity,35 as opposed to prominent T cell activation in infectious mononucleosis, is unlikely to account for the differences in cytokine/chemokine profiles in these conditions because IL-18, IFN-γ, Mig, and RANTES are not (or not uniquely) T cell products. IL-18, a product of activated macrophages and Kupffer cells,27 shares functional similarities with IL-12. It induces the production of IFN-γ in T cells, NK cells, and B cells,28,36 enhances NK cell function, and plays an important role in Th1-type responses.37,38 It also exerts antitumor activity involving inhibition of angiogenesis, activity that is IFN-γ-dependent.39,40 IFN-γ is produced by NK1.1/T cells (also named Vα14 NK/T cells),41 NK cells, and T cells stimulated by IL-12, IL-18, and other signals.26,38 Functionally, IFN-γ can directly stimulate NK cell function and T cell cytotoxicity and can indirectly promote the secretion of a number of chemokines, including Mig and RANTES.42,43 Mig, a product of endothelial cells, macrophages, and fibroblasts, serves as a chemoattractant for NK cells and T cells.42 It also inhibits angiogenesis and tumor growth.19,42 RANTES, produced by macrophages and epithelial cells44,45 after induction by IFN-γ and other signals, displays chemotactic function for monocytes, eosinophils, and basophils and enhances cell proliferation.46 Thus, IL-18, IFN-γ, and Mig are mediators that share anti-angiogenic and antitumor activities.
It is unlikely that the differences in cytokine/chemokine profiles between infectious mononucleosis and PTLD are attributable to the differences in biopsy sites. In 4 of 8 infectious mononucleosis cases the biopsy specimens were from tonsils, as opposed to only 2 of 11 PTLD cases. Although we cannot exclude the possibility that biopsy site could be an important variable, the results from those two PTLD tonsil biopsies were representative of the remainder of PTLD cases. It is also unlikely that the differences in cytokine/chemokine profiles between infectious mononucleosis and PTLD are attributable solely to differences intrinsic to host responses to a primary (as opposed to a chronic) EBV infection. Acute infectious mononucleosis is generally associated with a primary EBV infection, whereas PTLD can be associated with either a primary or, more frequently, a chronic EBV infection. T cells are responsible for many of the differences that distinguish immune responses to primary as opposed to chronic infections, but IL-18, IFN-γ, Mig and RANTES are not uniquely T-cell products. Also, in T-cell-immunodeficient mice, host responses leading to the rejection of EBV-immortalized cells involved IFN-γ, Mig, and RANTES but were not associated with the establishment of an immunological memory. In addition, two of the PTLD cases studied occurred in children and likely followed a primary EBV infection. The cytokine/chemokine profiles in these two cases were consistent with those of the PTLD group as a whole.
Previous studies have documented a variety of posttransplant immune deficiencies, including T cell, B cell, neutrophil, and NK cell defects.47,48 Consistent with previous reports, PTLD tissues studied here generally had few CD3-positive cells. However, in some cases as many as 15% of the cells were CD3-positive. By contrast, 35–50% of cells in lymphoid tissues from the patients with infectious mononucleosis were CD3-positive. Studies on peripheral blood described the NK cell deficiencies as transient posttransplant.49 By immunohistochemistry, we found NK cells were undetectable in PTLD tissues but consistently present in lymphoid tissues from patients with acute infectious mononucleosis at a frequency of 4–5 per high powered field. It is well established that NK cells are prominently activated during acute infectious mononucleosis.2 Because activated NK cells are an abundant source of IFN-γ, which, in turn, can promote the secretion of Mig and RANTES, the relative deficiency in IFN-γ, Mig, and RANTES expression in PTLD compared to infectious mononucleosis tissues could be explained on the basis of a relative NK cell deficiency. The higher level IL-18 expression in infectious mononucleosis compared to PTLD tissues cannot be easily explained on the basis of differences in the NK cell compartment, because these cells are not known to produce IL-18. Nor can it be explained on the basis of a broad macrophage deficiency, because expression of other macrophage products such as IL-6 and TNF-α was similar in infectious mononucleosis and PTLD tissues. Although the reasons for the different levels of IL-18 expression in PTLD and infectious mononucleosis tissues are unclear, a relative IL-18 deficiency in PTLD could be responsible for secondary deficiencies of IFN-γ, Mig, and RANTES expression.
The current study detected significantly higher levels of IL-10 expression in infectious mononucleosis tissues compared to PTLD and reactive lymphoid hyperplasia tissues. Previously, we had documented abnormally high levels of circulating IL-10 in patients with acute EBV-induced infectious mononucleosis.32 In one small study, patients with PTLD were reported to have as much as 3–4 ng/ml circulating IL-10,33 a significantly higher level than that we had detected in patients with acute infectious mononucleosis (50–300 pg/ml). IL-10 is produced constitutively by EBV-infected cells that can use it as an autocrine growth factor.29,31 Because IL-10 can also inhibit T-cell immunity and increase T-cell survival,32 it was proposed to play an important role in regulating EBV infection. The current results, showing lower level expression of IL-10 in PTLD tissues compared to infectious mononucleosis, suggest that additional studies will be needed to address a potential role of IL-10 in PTLD.
There is considerable interest in the application of cellular therapies with EBV- immune T cells to the prevention and treatment of PTLD. Initial results suggest that EBV-specific T cells can be expanded sufficiently in vitro and their infusion can reduce the number of circulating EBV-infected cells in allogeneic marrow recipients.8 Observations from the current study demonstrate the existence of a selective cytokine and chemokine deficiency in PTLD tissues relative to infectious mononucleosis. These observations, combined with the antitumor effects displayed independently by IL-18, Mig, and IP-10 in preclinical tumor models, suggest that novel strategies for the prevention and treatment of PTLD might include administration of selective cytokines or chemokines.
Acknowledgments
We thank Karen Jones, Lei Yao, Parris Burd, and Joshua Farber.
Footnotes
Address reprint requests to Dr. Elaine Jaffe, Hematopathology Section, Laboratory of Pathology, National Cancer Institute, National Institutes of Health, Building 10, Room 2A33, 10 Center Drive MSC 1500, Bethesda, MD 20892-1500. E-mail: elainejaffe@nih.gov.
References
- 1.Miller G: Epstein-Barr virus, biology, pathogenesis, and medical aspects. Epstein-Barr Virus, Biology, Pathogenesis, and Medical Aspects. B Fields, D Knipe, eds. New York, Raven Press, 1990, pp 1921–1958
- 2.Straus SE, Cohen JI, Tosato G, Meier J: NIH conference. Epstein-Barr virus infections: biology, pathogenesis, and management. Ann Intern Med 1993, 118:45-58 [DOI] [PubMed] [Google Scholar]
- 3.Rickinson AB, Lee SP, Steven NM: Cytotoxic T lymphocyte responses to Epstein-Barr virus. Curr Opin Immunol 1996, 8:492-497 [DOI] [PubMed] [Google Scholar]
- 4.Masucci MG, Ernberg I: Epstein-Barr virus: adaptation to a life within the immune system. Trends Microbiol 1994, 2:125-130 [DOI] [PubMed] [Google Scholar]
- 5.Nalesnik MA, Jaffe R, Starzl TE, Demetris TJ, Porter K, Burnham KA, Makowka L, Ho M, Locker J: The pathology of posttransplant lymphoproliferative disorders occurring in the setting of cyclosporine A-prednisone immunosuppression. Am J Pathol 1988, 133:173-192 [PMC free article] [PubMed] [Google Scholar]
- 6.Starzl TE, Nalesnik MA, Porter KA, Ho M, Iwatsuki S, Griffith BP, Rosenthal JT, Hakala TR, Shaw BW, Jr, Hardesty RL, Atchinson RW, Jaffe R, Bahnson HT: Reversibility of lymphomas and lymphoproliferative lesions developing under cyclosporin-steroid therapy. Lancet 1984, 1:583-587 [DOI] [PMC free article] [PubMed] [Google Scholar]
- 7.Papadopoulos EB, Ladanyi M, Emanuel D, Mackinnon S, Boulad F, Carabasi MH, Castro-Malaspina H, Childs BH, Gillio, Small TN, Young JW, Kernan NA, O’Reilly RJ: Infusions of donor leukocytes to treat Epstein-Barr virus-associated lymphoproliferative disorders after allogeneic bone marrow transplantation [see comments]. N Engl J Med 1994, 330:1185-1191 [DOI] [PubMed] [Google Scholar]
- 8.Heslop HE, Ng CY, Li C, Smith CA, Loftin SK, Krance RA, Brenner MK, Rooney CM: Long-term restoration of immunity against Epstein-Barr virus infection by adoptive transfer of gene-modified virus-specific T lymphocytes. Nat Med 1996, 2:551-555 [DOI] [PubMed] [Google Scholar]
- 9.Heslop HE, Rooney CM: Adoptive cellular immunotherapy for EBV lymphoproliferative disease. Immunol Rev 1997, 157:217-222 [DOI] [PubMed] [Google Scholar]
- 10.Morrison VA, Dunn DL, Manivel JC, Gajl-Peczalska KJ, Peterson BA: Clinical characteristics of post-transplant lymphoproliferative disorders. Am J Med 1994, 97:14-24 [DOI] [PubMed] [Google Scholar]
- 11.Montone KT, Litzky LA, Wurster A, Kaiser L, Bavaria J, Kotloff R, Palevsky H, Pietra GG, Tomaszewski JE: Analysis of Epstein-Barr virus-associated posttransplantation lymphoproliferative disorder after lung transplantation. Surgery 1996, 119:544-551 [DOI] [PubMed] [Google Scholar]
- 12.Chen JM, Barr ML, Chadburn A, Frizzera G, Schenkel FA, Sciacca RR, Reison DS, Addonizio LJ, Rose EA, Knowles DM, Michler RE: Management of lymphoproliferative disorders after cardiac transplantation. Ann Thorac Surg 1993, 56:527-538 [DOI] [PubMed] [Google Scholar]
- 13.Swinnen LJ, Costanzo-Nordin MR, Fisher SG, O’Sullivan EJ, Johnson MR, Heroux AL, Dizikes GJ, Pifarre R, Fisher RI: Increased incidence of lymphoproliferative disorder after immunosuppression with the monoclonal antibody OKT3 in cardiac-transplant recipients [see comments]. N Engl J Med 1990, 323:1723-1728 [DOI] [PubMed] [Google Scholar]
- 14.Cockfield SM, Preiksaitis JK, Jewell LD, Parfrey NA: Post-transplant lymphoproliferative disorder in renal allograft recipients: clinical experience and risk factor analysis in a single center. Transplantation 1993, 56:88-96 [DOI] [PubMed] [Google Scholar]
- 15.Manez R, Breinig MC, Linden P, Wilson J, Torre-Cisneros J, Kusne S, Dummer S, Ho M: Posttransplant lymphoproliferative disease in primary Epstein-Barr virus infection after liver transplantation: the role of cytomegalovirus disease. J Infect Dis 1997, 176:1462-1467 [DOI] [PubMed] [Google Scholar]
- 16.Wolf J, Draube A, Bohlen H, Jox A, Mucke S, Pawlita P, Moller M, Diehl V: Suppression of Burkitt’s lymphoma tumorigenicity in nude mice by co- inoculation of EBV-immortalized lymphoblastoid cells. Int J Cancer 1995, 60:527-533 [DOI] [PubMed] [Google Scholar]
- 17.Tosato G, Sgadari C, Taga K, Jones KD, Pike SE, Rosenberg A, Sechler JM, Magrath IT, Love LA, Bhatia K: Regression of experimental Burkitt’s lymphoma induced by Epstein-Barr virus-immortalized human B cells. Blood 1994, 83:776-784 [PubMed] [Google Scholar]
- 18.Sgadari C, Angiolillo AL, Cherney B-, Pike SE, Farber JM, Koniaris LG, Vanguri P, Burd PR, Sheikh N, Gupta G, Teruya-Feldstein J, Tosato G: Interferon-inducible protein-10 identified as a mediator of tumor necrosis in vivo. Proc Natl Acad Sci USA 1996, 93:13791-13796 [DOI] [PMC free article] [PubMed] [Google Scholar]
- 19.Sgadari C, Farber JM, Angiolillo AL, Liao F, Teruya-Feldstein J, Burd PR, Yao L, Gupta G, Kanegane C, Tosato G: Mig, the monokine induced by interferon-γ, promotes tumor necrosis in vivo. Blood 1997, 89:2635-2643 [PubMed] [Google Scholar]
- 20.Ferry JA, Jacobson JO, Conti D, Delmonico F, Harris NL: Lymphoproliferative disorders and hematologic malignancies following organ transplantation. Mod Pathol 1989, 2:583-592 [PubMed] [Google Scholar]
- 21.Weissmann DJ, Ferry JA, Harris NL, Louis DN, Delmonico F, Spiro I: Posttransplantation lymphoproliferative disorders in solid organ recipients are predominantly aggressive tumors of host origin. Am J Clin Pathol 1995, 103:748-755 [DOI] [PubMed] [Google Scholar]
- 22.Harris NL, Ferry JA, Swerdlow SH: Posttransplant lymphoproliferative disorders: summary of Society for Hematopathology workshop. Semin Diagn Pathol 1997, 14:8-14 [PubMed] [Google Scholar]
- 23.Kingma DW, Weiss WB, Jaffe ES, Kumar S, Frekko F, Raffeld M: Epstein-Barr virus latent membrane protein-1 oncogene deletions: correlations with malignancy in Epstein-Barr virus-associated lymphoproliferative disorders and malignant lymphomas. Blood 1996, 88:242-251 [PubMed] [Google Scholar]
- 24.Teruya-Feldstein J, Jaffe ES, Burd PR, Kanegane H, Kingma DW, Wilson WH, Longo DL, Tosato G: The role of Mig, the monokine induced by interferon-γ, and IP-10, the interferon-γ-inducible protein-10, in tissue necrosis and vascular damage associated with Epstein-Barr virus-positive lymphoproliferative disease. Blood 1997, 90:4099-4105 [PubMed] [Google Scholar]
- 25.Segal GH, Jorgensen T, Scott M, Braylan RC: Optimal primer selection for clonality assessment by polymerase chain reaction analysis: II. Follicular lymphomas [see comments] Hum Pathol 1994, 25:1276-1282 [DOI] [PubMed] [Google Scholar]
- 26.Chan SH, Kobayashi M, Santoli D, Perussia B, Trinchieri G: Mechanisms of IFN-γ induction by natural killer cell stimulatory factor (NKSF/IL-12). Role of transcription and mRNA stability in the synergistic interaction between NKSF and IL-2. J Immunol 1992, 148:92-98 [PubMed] [Google Scholar]
- 27.Okamura H, Tsutsi H, Komatsu T, Yutsudo M, Hakura A, Tanimoto T, Torigoe K, Okura T, Nukada Y, Hattori K, Akita K, Namba M, Tanabe F, Konishi K, Fukuda S, Kurimoto M: Cloning of a new cytokine that induces IFN-γ production by T cells [see comments]. Nature 1995, 378:88-91 [DOI] [PubMed] [Google Scholar]
- 28.Ushio S, Namba M, Okura T, Hattori K, Nukada Y, Akita K, Tanabe F, Konishi K, Micallef M, Fujii M, Torigoe K, Tanimoto T, Fukuda S, Ikeda M, Okamura H, Kurimoto M: Cloning of the cDNA for human IFN-γ-inducing factor, expression in Escherichia coli, and studies on the biologic activities of the protein. J Immunol 1996, 156:4274-4279 [PubMed] [Google Scholar]
- 29.Moore KW, O’Garra A, de Waal Malefyt R, Vieira P, Mosmann TR: Interleukin-10. Annu Rev Immunol 1993, 11:165-190 [DOI] [PubMed] [Google Scholar]
- 30.Stuart AD, Stewart JP, Arrand JR, Mackett M: The Epstein-Barr virus encoded cytokine viral interleukin-10 enhances transformation of human B lymphocytes. Oncogene 1995, 11:1711-1719 [PubMed] [Google Scholar]
- 31.Beatty PR, Krams SM, Martinez OM: Involvement of IL-10 in the autonomous growth of EBV-transformed B cell lines. J Immunol 1997, 158:4045-4051 [PubMed] [Google Scholar]
- 32.Taga H, Taga K, Wang F, Chretien J, Tosato G: Human and viral interleukin-10 in acute Epstein-Barr virus-induced infectious mononucleosis. J Infect Dis 1995, 171:1347-1350 [DOI] [PubMed] [Google Scholar]
- 33.Birkeland SA, Bendtzen K: Interleukin-10 and Epstein-Barr virus-induced posttransplant lymphoproliferative disorder [letter]. Transplantation 1996, 61:1425-1426 [DOI] [PubMed] [Google Scholar]
- 34.Raymond E, Tricottet V, Samuel D, Reynes M, Bismuth H, Misset JL: Epstein-Barr virus-related localized hepatic lymphoproliferative disorders after liver transplantation. Cancer 1995, 76:1344-1351 [DOI] [PubMed] [Google Scholar]
- 35.Lucas KG, Small TN, Heller G, Dupont B, O’Reilly RJ: The development of cellular immunity to Epstein-Barr virus after allogeneic bone marrow transplantation. Blood 1996, 87:2594-2603 [PubMed] [Google Scholar]
- 36.Yoshimoto T, Okamura H, Tagawa YI, Iwakura Y, Nakanishi K: Interleukin 18 together with interleukin 12 inhibits IgE production by induction of interferon-γ production from activated B cells. Proc Natl Acad Sci USA 1997, 94:3948-3953 [DOI] [PMC free article] [PubMed] [Google Scholar]
- 37.Robinson D, Shibuya K, Mui A, Zonin F, Murphy E, Sana T, Hartley SB, Menon S, Kastelein R, Bazan F, O’Garra A: IGIF does not drive Th1 development but synergizes with IL-12 for interferon-γ production and activates IRAK and NFκB. Immunity 1997, 7:571-581 [DOI] [PubMed] [Google Scholar]
- 38.Micallef MJ, Ohtsuki T, Kohno K, Tanabe F, Ushio S, Namba M, Tanimoto T, Torigoe K, Fujii M, Ikeda M, Fukuda S, Kurimoto M: Interferon-γ-inducing factor enhances T helper 1 cytokine production by stimulated human T cells: synergism with interleukin-12 for interferon-γ production. Eur J Immunol 1996, 26:1647-1651 [DOI] [PubMed] [Google Scholar]
- 39.Micallef MJ, Yoshida K, Kawai S, Hanaya T, Kohno K, Arai S, Tanimoto T, Torigoe K, Fujii M, Ikeda M, Fukuda S, Kurimoto M: In vivo antitumor effects of murine interferon-γ-inducing factor/interleukin-18 in mice bearing syngeneic Meth A sarcoma malignant ascites. Cancer Immunol Immunother 1997, 43:361-367 [DOI] [PMC free article] [PubMed] [Google Scholar]
- 40.Coughlin CM, Salhany KE, Wysocka M, Aruga E, Kurzawa H, Chang AE, Hunter CA, Fox JC, Trinchieri G, Lee WMF: Interleukin-12 and interleukin-18 synergistically induce murine tumor regression which involves inhibition of angiogenesis. J Clin Invest 1998, 101:1441-1452 [DOI] [PMC free article] [PubMed] [Google Scholar]
- 41.Kawano T, Cui J, Koezuka Y, Toura I, Kaneko Y, Motoki K, Ueno H, Nakagawa R, Sato H, Kondo E, Koseki H, Taniguchi M: CD1d-restricted and TCR-mediated activation of valpha14 NKT cells by glycosylceramides. Science 1997, 278:1626-1629 [DOI] [PubMed] [Google Scholar]
- 42.Farber JM: Mig and IP-10: CXC chemokines that target lymphocytes. J Leukoc Biol 1997, 61:246-257 [PubMed] [Google Scholar]
- 43.Rathanaswami P, Hachicha M, Sadick M, Schall TJ, McColl SR: Expression of the cytokine RANTES in human rheumatoid synovial fibroblasts. Differential regulation of RANTES and interleukin-8 genes by inflammatory cytokines. J Biol Chem 1993, 268:5834-5839 [PubMed] [Google Scholar]
- 44.Shin HS, Drysdale BE, Shin ML, Noble PW, Fisher Sn, Paznekas WA: Definition of a lipopolysaccharide-responsive element in the 5′-flanking regions of MuRantes and crg-2. Mol Cell Biol 1994, 14:2914-2925 [DOI] [PMC free article] [PubMed] [Google Scholar]
- 45.Thomas LH, Friedland JS, Sharland M, Becker S: Respiratory syncytial virus-induced RANTES production from human bronchial epithelial cells is dependent on nuclear factor-kappa B nuclear binding and is inhibited by adenovirus-mediated expression of inhibitor of kappa B α. J Immunol 1998, 161:1007-1016 [PubMed] [Google Scholar]
- 46.Bacon KB, Premack BA, Gardner P, Schall TJ: Activation of dual T cell signaling pathways by the chemokine RANTES. Science 1995, 269:1727-1730 [DOI] [PubMed] [Google Scholar]
- 47.Ault KA, Antin JH, Ginsburg D, Orkin SH, Rappeport JM, Keohan ML, Martin P, Smith BR: Phenotype of recovering lymphoid cell populations after marrow transplantation. J Exp Med 1985, 161:1483-1502 [DOI] [PMC free article] [PubMed] [Google Scholar]
- 48.Keever CA, Small TN, Flomenberg N, Heller G, Pekle K, Black P, Pecora A, Gillio A, Kernan NA, O’Reilly RJ: Immune reconstitution following bone marrow transplantation: comparison of recipients of T-cell depleted marrow with recipients of conventional marrow grafts. Blood 1989, 73:1340-1350 [PubMed] [Google Scholar]
- 49.Keever CA, Welte K, Small T, Levick J, Sullivan M, Hauch M, Evans RL, O’Reilly RJ: Interleukin 2-activated killer cells in patients following transplants of soybean lectin-separated and E rosette-depleted bone marrow. Blood 1987, 70:1893-1903 [PubMed] [Google Scholar]