

Abstract
The role of oxidative damage in neurodegenerative disease was investigated in mice lacking cytoplasmic Cu/Zn superoxide dismutase (SOD), created by deletion of the SOD1 gene (SOD1−/−). SOD1−/− mice developed a chronic peripheral hindlimb axonopathy. Mild denervation of muscle was detected at 2 months, and behavioral and physiological motor deficits were present at 5–7 months of age. Ventral root axons were shrunken but were normal in number. The somatosensory system in SOD1−/− mice was mildly affected. SOD1−/− mice expressing Cu/Zn SOD only in brain and spinal cord were generated using transgenic mice expressing mouse SOD1 driven by the neuron-specific synapsin promoter. Neuron-specific expression of Cu/Zn SOD in SOD1−/− mice rescued motor neurons from the neuropathy. Therefore, Cu/Zn SOD is not required for normal motor neuron survival, but is necessary for the maintenance of normal neuromuscular junctions by hindlimb motor neurons.
Oxidative damage has been implicated in virtually all age-associated neurodegenerative diseases. 1 Increases in markers of oxidative damage have been reported in Alzheimer’s disease, 2-4 Huntington’s disease, 5 Parkinson’s disease, 6,7 and amyotrophic lateral sclerosis (ALS). 8 Additionally, about 10% of familial ALS (FALS) cases are associated with mutations in the SOD1 gene. 9 Transgenic mice that express an FALS mutant form of Cu/Zn SOD show a phenotype that is strikingly similar to human ALS. 10-14 The mutations in SOD1 associated with FALS result in a newly acquired or greatly enhanced toxic activity of the Cu/Zn SOD protein, as opposed to a loss of normal SOD activity. 10 In support of this hypothesis, recent papers have shown an increase in the ability of Cu/Zn SOD to react with peroxynitrite in mutant but not in the wild-type Cu/Zn SOD protein. 15,16 Another possible mechanism is that aggregates containing misfolded Cu/Zn SOD may mediate toxicity. 17 However, it remains unclear to what extent neuropathology may arise from a complete lack of Cu/Zn SOD activity.
SODs act as the first line of defense against oxidative damage by converting the superoxide free radical (O2•−) to hydrogen peroxide and O2. In mammals there are three forms of SOD: a cytoplasmic Cu/Zn SOD, a mitochondrial Mn SOD, and an extracellular (EC) SOD. 18,19 The importance of the SODs in an oxygen-rich environment is supported by their virtual ubiquity in aerobic organisms and by the phenotypes associated with mutants that lack various forms of SOD. Yeast, bacteria, and Drosophila lacking SOD all exhibit oxygen sensitivity. 19-23 Mice lacking Mn SOD die shortly after birth. 24,25 EC SOD-deficient mice show increased sensitivity to hyperoxic conditions. 26
To better understand the role of Cu/Zn SOD and oxidative damage in neurodegenerative processes, we made gene-targeted mice deficient in Cu/Zn SOD. 27 Previously we reported that SOD1−/− mice did not exhibit overt spontaneous abnormalities as young adults, although they showed increased vulnerability to facial motor axotomy 27 and to cerebral ischemia. 28 We also described the presence of subtle evidence for acute and chronic denervation of muscle. 27 Here we provide evidence for a spontaneous chronic peripheral neuropathy that develops in SOD1−/− mice with age, suggesting that Cu/Zn SOD is necessary under normal conditions for the maintenance of neuronal connections by some neurons.
Materials and Methods
Generation of Mice
Embryonic stem cells (129 strain) lacking SOD1, established by homologous recombination, were used to create homozygous SOD1−/− mice. 27 SOD1−/− and SOD1+/+ mice were maintained as outbred 129/CD-1 hybrids. The SOD1 transgene, consisting of a 4.5-kb SalI/SmaI rat synapsin I promoter fragment, a 127-bp SmaI/HindIII fragment harboring the SV40 small t intron, 29 and the 530-bp mouse SOD1 gene, 30 was introduced into and maintained in C57Bl/6J X SJL/J mice. This promoter effectively restricts expression of the transgene to neurons. 29,31 SOD1−/− mice were then generated that were either hemizygous or homozygous for the synapsin SOD1 transgene. Mice in physiological and morphological studies were anesthetized with Avertin (1.25% 2,2,2-tribromoethanol and 2.5% tert-amyl alcohol, 0.02 ml/g of body weight). All procedures were conducted in accordance with the National Institutes of Health’s Guide for the Care and Use of Laboratory Animals and were approved by the Cephalon institutional animal care and use committee.
Behavioral Testing
Rod running time was determined by training mice to cross an 80-cm long, 1.25-cm diameter steel bar covered by 1.9-cm O.D. rubber tubing, which was elevated 20 cm above the table. After traversing the rod, the mice descended a wire screen into their home cage. Mice were pretrained to cross a 60-cm interval along the rod without hesitation. The time to traverse this interval was then measured in three additional trials and averaged.
Stride length was measured by painting the animals’ hind feet with poster paint. They were then prompted to walk down a cardboard alley (6 cm × 80 cm) over a paper strip to record footprints. Stride length was defined as the distance between two successive ipsilateral hind foot falls. The average of 4 stride lengths was recorded for each animal. This test has been used to demonstrate early alterations in motor performance in FALS transgenic mice. 10
Thermal sensory function was assessed using an Omnitech Hot Plate Analgesiometer (AccuScan Instruments, Columbus, OH), set at 55°C. Animals were placed on the hot plate and confined in position using an inverted beaker. The time until an animal gave three foot shakes or licked its foot was recorded. The response latency was the mean of two such responses.
Peripheral Nerve Conduction Velocities and Amplitudes
Conduction velocities and amplitudes of the caudal, sural, and tibial nerves were recorded at 5–7 months of age. This age was chosen because behavioral deficits were not seen earlier, and we wished to minimize the risk of injuring the animals by the electrophysiological procedures, because the effects of any injury might be exacerbated in the SOD1−/− mice. Surface temperatures of the tail and hind foot were monitored and kept constant during the experiments at 31–32°C, and core temperature was kept at 37°C. Disposable needle (#30) electrodes were used for stimulation and recording. Stimulation consisted of 50-microsecond, constant current, rectangular pulses at an interpulse interval of 750 milliseconds, generated by a PG-4000 pulse generator (Neurodata Instrument Co., New York, NY) and fed to a Neurodata SIU-90 constant current stimulus isolation unit. Nerve and muscle potentials were recorded using an AM-Systems (Carlsborg, WA) model 1700 AC amplifier. In each case, the lowest stimulus amplitude that gave a maximal response was used. In the case of caudal and sural nerve stimulation, these responses were used for calculating maximal amplitude. Because activation of distal segments can occur with maximal stimulation, the stimulus amplitude was then decreased slowly until a stable latency occurred while the response was still above 50% of its original amplitude and showed no change in shape. This response was then recorded and used for latency determination. Ten waveforms were averaged for caudal and sural nerve responses, and five EMG responses were averaged in the case of tibial nerve stimulation. Conduction velocities were calculated as the conduction distance divided by the latency from stimulation to the onset of negativity in the compound action potential or EMG response. Amplitudes were calculated as the difference in potential from the latency onset to the maximum negativity (see Figure 1 ▶ ).
Figure 1.
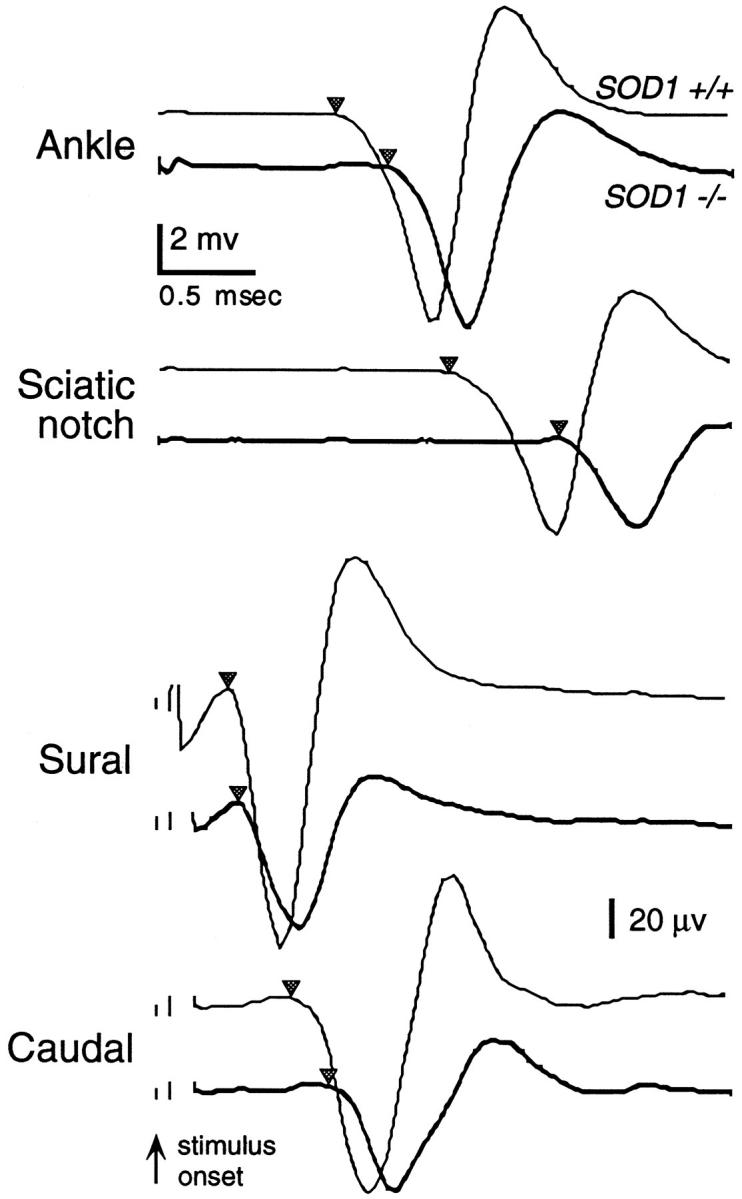
Individual waveforms from typical mice used for peripheral nerve conduction measurements showing average plantar muscle responses to stimulation of tibial nerve at the ankle and sciatic notch, sural nerve responses to stimulation of foot pad, and caudal nerve responses to proximal stimulation. Upper responses in each set are those for SOD1+/+ mice, lower responses for SOD1−/− mice. Inverted triangles indicate response onset latency relative to stimulus onset. Two-mV calibration for ankle and sciatic notch responses; 20-μV calibration for sural and caudal nerve responses.
The caudal (tail) nerve consists of both sensory and motor fibers, which contribute to the response. The reference recording electrode was placed 5 mm from the base of the tail and the active electrode 5 mm further distal. 32 The stimulating electrodes were placed with the cathode and anode 40 and 45 mm, respectively, distal to the active recording electrode.
Sural nerve responses were produced by stimulating the sensory endings in the footpad. No muscle response in the foot was produced by this stimulation, indicating that the recorded response was a relatively pure sensory nerve response. The cathodal (negative) stimulation electrode was placed in the center of the ventral hindlimb foot pad and the anode at the base of the fifth (outer) toe. The active recording electrode was placed adjacent to the sural nerve just proximal to the medial malleolus at the ankle, and the reference electrode in the belly of the gastrocnemius. The distance between active stimulating and recording electrodes was fixed at 13 mm.
The conduction velocity of the motor component of the tibial nerve was determined by placing cathodal stimulating electrodes at the sciatic notch (near the hip joint) and ankle (proximal to the medial malleolus), with the cathode over the lumbar vertebrae. 33 The active and reference recording electrodes were positioned in the ventral hindlimb foot pad and the fifth toe, respectively, to record myoelectric responses from the interosseous muscles of the foot. Conduction velocity was calculated as the distance between the sciatic notch and ankle electrodes divided by the corresponding myoelectric response latencies.
Muscle and Nerve Histopathology
Fresh muscle samples were frozen in isopentane at −60°C. Cryostat sections were cut at 10 μm and processed for succinic acid dehydrogenase or hematoxylin and eosin. 34 Gluteus maximus was prepared for silver-acetylcholinesterase staining according to the protocol of Gurney et al. 35
Mice were perfused transcardially with 0.1 Mol/L phosphate buffered saline (pH 7.4) followed by 4% paraformaldehyde and 2.5% glutaraldehyde in 0.1 Mol/L phosphate buffer or by 4% paraformaldehyde in 0.1 Mol/L phosphate buffer. Nerves and roots were further fixed in 1% osmium tetroxide in 0.1 Mol/L phosphate buffer for 1 hour and embedded in EMbed-812 Epon (EM Sciences, Fort Washington, PA). Semithin (1 μm) sections were stained with toluidine blue.
Axons in L3 dorsal and ventral roots were chosen randomly for sizing, and cross-sectional areas of axons were determined by tracing within the inner border of their myelin sheaths with a computer imaging system. From the area, the diameter of the equivalent circle was calculated for each fiber. 36
Western Blots
Frozen tissue samples from mice exsanguinated with Ringer’s solution were pulverized on dry ice and lysed by 3 rounds of freeze/thaw. Protein concentrations were determined using the bicinchoninic acid method (Pierce, Rockford, IL) and equal loads of protein (0.25 μg for all tissues except hindlimb muscle and 0.5 μg for hindlimb muscle) were fractionated, transferred, and probed as described previously. 37 Proteins were detected by enhanced chemiluminescence (Amersham, Arlington Heights, IL).
Statistics
Subject means were used for statistical analyses and determination of group means. Group errors were standard errors of the mean. All genotype comparisons were made using unpaired 2-tailed Student’s t-tests.
Results
Sensory and Motor Behavior
Locomotor function and balance were evaluated by measuring stride length and the time to traverse a narrow rod at 4, 6, and 14 months of age (Table 1) ▶ . There were no significant differences between SOD1−/− and wild-type (SOD1+/+) mice in stride length or rod running time at 4 months of age. At 6 months of age, SOD1−/− mice had significantly slower rod running times than SOD1+/+ mice, but no difference was seen in stride length. By 14 months, significant motor deficits were seen in both stride length and rod running time in the SOD1−/− mice. The percent change in the SOD1−/− versus the age-matched SOD1+/+ mice in stride length was similar across the age groups (5–12%). The percent change in rod running time increased as the mice aged from 20% at 4 months to 86% at 14 months.
Table 1.
Motor Performance
| SOD1+/+ | SOD1−/− | P value | |
|---|---|---|---|
| 4 months | (n = 7) | (n = 7) | |
| Rod running (seconds) | 2.28 ± 0.10 | 2.73 ± 0.12 | 0.13 |
| Stride length (mm) | 72.32 ± 1.70 | 63.64 ± 2.73 | 0.19 |
| 6 months | (n = 10) | (n = 10) | |
| Rod running (seconds) | 1.91 ± 0.08 | 2.67 ± 0.24 | 0.012 |
| Stride length (mm) | 73.38 ± 1.98 | 69.60 ± 1.91 | 0.19 |
| 14 months | (n = 10) | (n = 10) | |
| Rod running (seconds) | 2.74 ± 0.25 | 5.10 ± 0.92 | 0.038 |
| Stride length (mm) | 68.76 ± 1.72 | 61.78 ± 0.20 | 0.012 |
Somatosensory behavior was also evaluated in the SOD1−/− mice using the hot plate test. This test is well established in the literature and produces highly consistent values in repetitive testing. 38 The oldest animals available were used to maximize the likelihood of seeing a deficit. Nine SOD1−/− and 18 SOD1+/+ mice were tested at approximately 22 months of age. The SOD1−/− mice showed a slight but nonsignificant increase in latency (13.68 ± 2.05 seconds versus 11.45 ± 0.56 seconds).
Peripheral Nerve Conduction Velocities and Amplitudes
The results of evaluation of peripheral nerve conduction are shown in Figure 1 ▶ and Table 2 ▶ . The conduction velocity of the compound action potential in the sural nerve produced by stimulating sensory endings in the foot pad was slightly but not significantly reduced in the SOD1−/− mice. The caudal nerve, which contains both sensory and motor fibers, showed a small but significant reduction in conduction velocity in the SOD1−/− mice. In contrast, conduction velocity in the motor axons of the tibial nerve, measured via the difference in latency between responses evoked by stimulation at the ankle and sciatic notch, was significantly reduced by 23% in the SOD1−/− mice.
Table 2.
Nerve Conduction Velocities and Amplitudes at 5–7 Months of Age
| SOD1+/+ (n = 10) | SOD1−/− (n = 10) | P value | |
|---|---|---|---|
| Conduction velocity (m/second) | |||
| Sural nerve | 36.2 ± 1.5 | 32.8 ± 1.8 | 0.16 |
| Caudal nerve | 39.8 ± 1.5 | 35.5 ± 1.0 | 0.031 |
| Tibial nerve | 38.5 ± 1.5 | 29.8 ± 0.7 | 0.0001 |
| Conduction amplitude (μV) | |||
| Sural nerve | 121.8 ± 10.0 | 94.2 ± 11.9 | 0.093 |
| Caudal nerve | 119.5 ± 8.7 | 93.7 ± 12.4 | 0.106 |
| Plantar muscle response to ankle stimulation | |||
| Latency (milliseconds) | 1.87 ± 0.03 | 2.21 ± 0.02 | 0.0001 |
| Amplitude (mV) | 5.30 ± 0.59 | 4.31 ± 0.53 | 0.227 |
Reduction in nerve conduction velocity could arise from loss of large caliber axons. However, compound nerve amplitudes in the sural and caudal nerves were not significantly reduced in SOD1−/− mice, suggesting that the numbers of axons in the SOD1−/− mice were not greatly diminished.
The latency of the plantar muscle EMG response to stimulation of the tibial nerve at the ankle was significantly reduced in SOD1−/− mice. This latency includes the conduction time from the stimulus site to the nerve terminals (fixed at ∼13 mm) plus the synaptic delay. The latency in the SOD1−/− mice was 0.34 milliseconds greater than in the SOD1+/+ mice. Based on the tibial nerve conduction velocities of 29.8 m/second in the SOD1−/− mice and of 38.5 m/second in the SOD1+/+ mice, a difference of only 0.10 milliseconds in the conduction velocity was expected for this distance; thus the observed delay was 0.24 milliseconds (2.4×) longer than expected. Therefore, in addition to reduced axonal conduction, there also appeared to be either a specific reduction in conduction velocity of the terminal nerve branches, or an increased synaptic delay in SOD1−/− mice. The amplitude of the plantar muscle response was not significantly reduced in the SOD1−/− mice, suggesting that the plantar muscle innervation was intact.
Muscle and Nerve Pathology
SOD1−/− mice showed hindlimb muscle denervation detected as early as 2 months of age. The changes consisted of atrophic muscle fibers, indicative of acute denervation (Figure 2, A and B) ▶ , and fiber type grouping, consistent with previous denervation and reinnervation (Figure 2, C and D) ▶ . SOD1−/− mice at 2 months and some at 6 months of age showed few denervated muscle fibers and minimal fiber type grouping. Some SOD1−/− mice at 6 months and all older SOD1−/− mice showed more marked pathology. Affected muscles were those of the thigh (quadriceps femoris and hamstrings) and leg (gastrocnemius, plantaris, and flexor digitorum longus). No changes consistent with primary muscle pathology, such as disruptions of the myotubes or inclusions, were found in muscles of SOD1−/− mice. Flexor and extensor muscles of the forelimb were examined at 14 and 19 months of age and showed no evidence of current or previous denervation in the SOD1−/− mice (data not shown).
Figure 2.
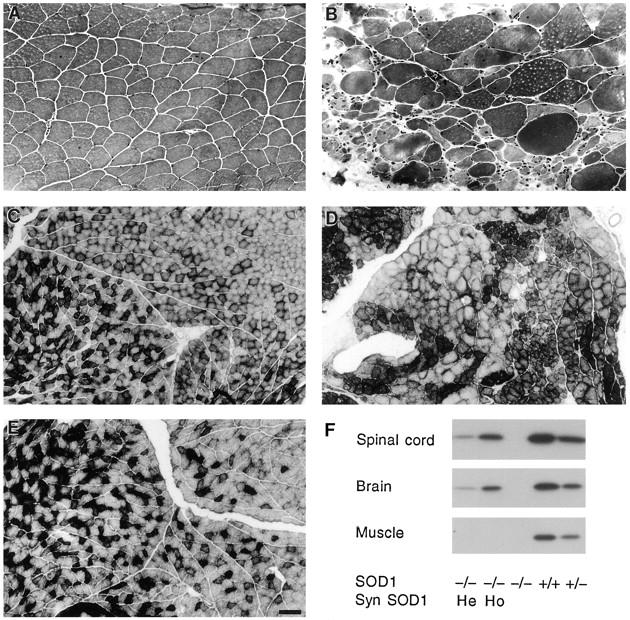
Hindlimb muscles showing denervation in SOD1−/− mice and Cu/Zn SOD protein levels. Medial gastrocnemius muscle from a 6-month-old SOD1+/+ mouse (A) showing normal muscle fibers, and from a SOD1−/− mouse (B) showing marked atrophy of muscle fibers consistent with denervation. Some muscle fibers in B are hypertrophied. Hematoxylin and eosin stain. Central gastrocnemius muscle from a 12-month-old SOD1+/+ mouse (C) showing the normal interspersion of type IIA and IIB fibers. Same muscle from a 12-month-old SOD1−/− mouse (D) showing fiber type grouping, consistent with chronic denervation and reinnervation and from a 12-month-old SOD1−/−, hemizygous synapsin SOD1 transgenic mouse (E) showing a normal pattern of muscle fibers. Succinic acid dehydrogenase histochemistry. Bars, 50 μm (A and B) and 125 μm (C-E). F: Cu/Zn SOD protein levels in brain, spinal cord, and hindlimb muscle in SOD1+/+, heterozygous (SOD1+/−), and SOD1−/− mice. SOD1−/− mice were either wild-type, hemizygous (He), or homozygous (Ho) for the synapsin (Syn) SOD1 transgene, which directed Cu/Zn SOD expression to brain and spinal cord but not to muscle.
Staining of axons and NMJs of the gluteus maximus muscle in the SOD1−/− mice showed abnormalities at 6–17 months of age. Although the intramuscular nerve bundle traversing the muscle appeared normal in the SOD1−/− mice, the individual terminal axons descending to the NMJs were abnormally tortuous (Figure 3) ▶ . The tortuous nature of the terminal axons in the SOD1−/− mice made it difficult to follow any one terminal from the nerve bundle to the NMJ.
Figure 3.
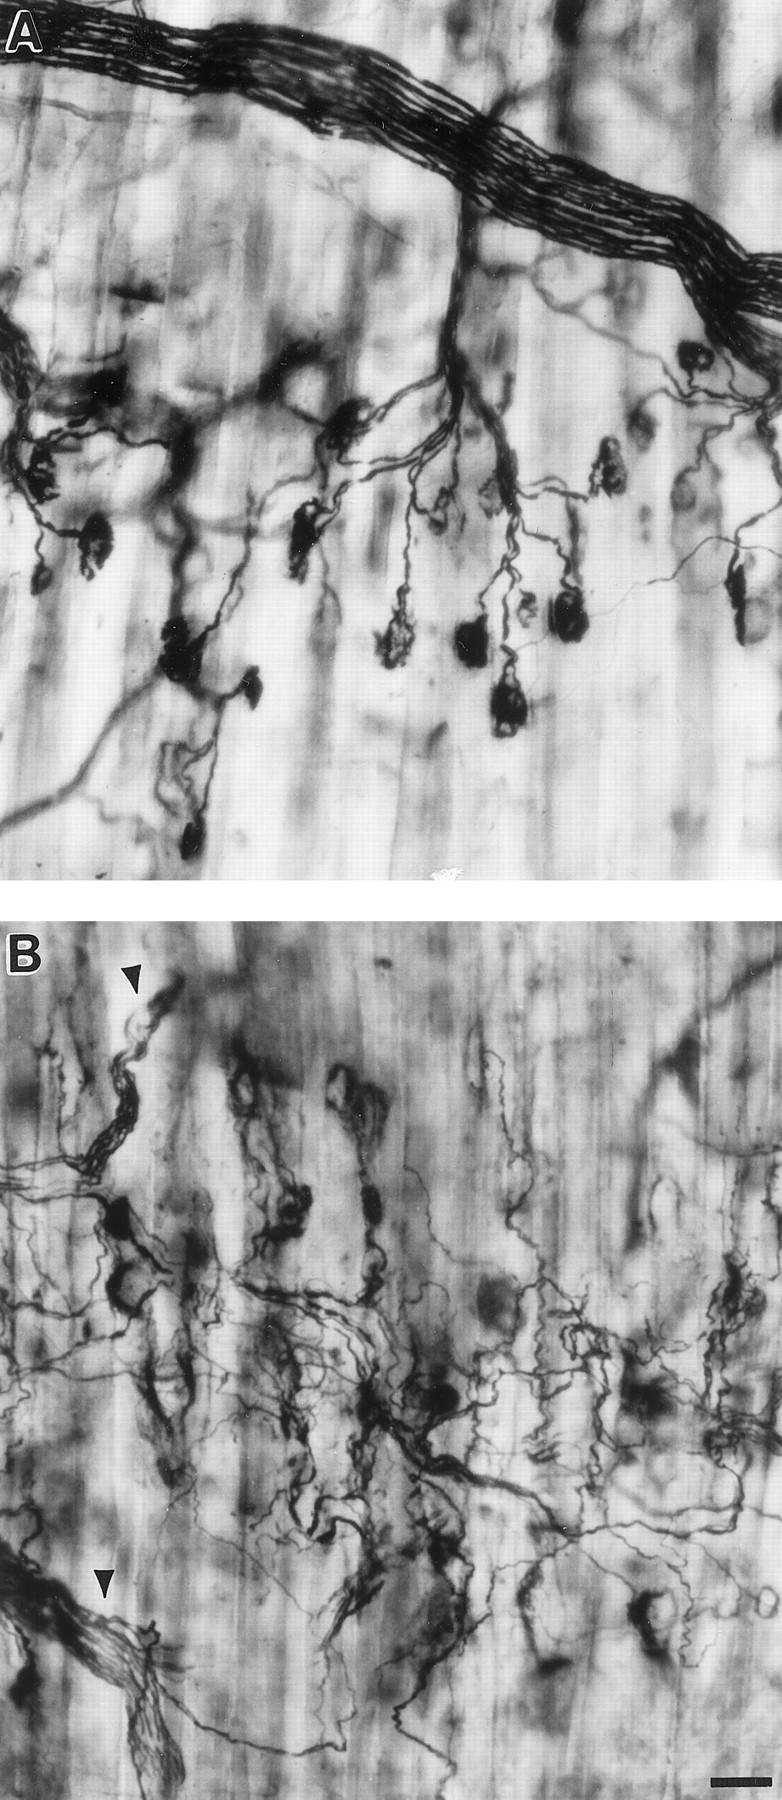
Pathology of NMJs and terminal axons in SOD1−/− mice. Silver-acetylcholinesterase staining of the gluteus maximus muscle from 9-month-old SOD1+/+ (A) and SOD1−/− (B) mice. In the SOD1+/+ mouse terminal axons take a direct course to NMJs, one per axon. In the SOD1−/− mouse, the nerve bundle appears normal (arrowheads) but the terminal axons are tortuous due to the process of denervation and reinnervation. Bar, 50 μm.
At 6 months of age the appearance of the lumbar ventral root (L3) and tibial nerve at the ankle was normal in the SOD1−/− mice (Figure 4, A and B) ▶ . However, by 17–19 months of age there were shrunken axons and a few very swollen, thinly myelinated axons in the ventral roots of L3 in some of the SOD1−/− mice (Figure 4, C ▶ and D). Degenerating axons, evident by the presence of macrophages containing myelin droplets, and remyelinating axons, evident by unusually thin myelin sheaths and the presence of Schwann cell nuclei, were also seen (Figure 4D) ▶ .
Figure 4.
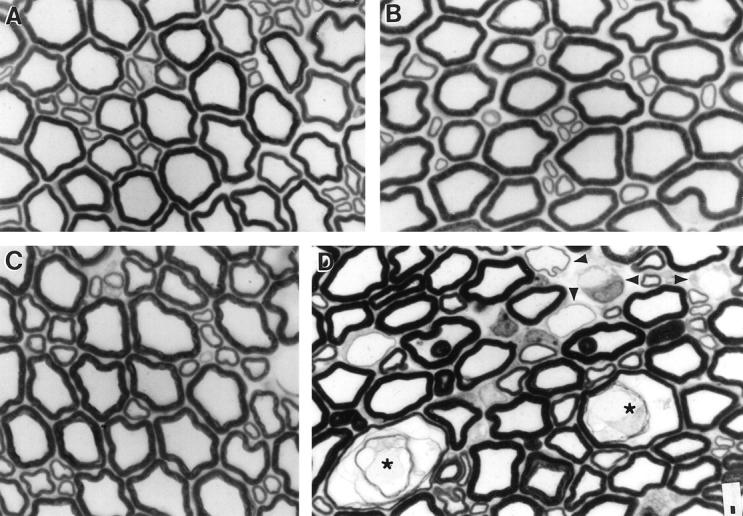
Pathology in L3 ventral roots. L3 ventral roots in 1-μm plastic sections stained with toluidine blue at 6 (A and B) and 17 (C and D) months of age. A and C: SOD1+/+ mice and B and D: SOD1−/− mice. Swollen (*) and regenerating axons (arrowheads) are seen in the 17-month-old mouse SOD1−/− mouse. Bar, 5 μm.
The numbers of myelinated axons in the ventral roots of L3 were not significantly different at 6 or 19 months between the SOD1−/− and SOD1+/+ mice (Table 3) ▶ . Despite the normal appearance of the axons in the ventral roots of L3 at 6 months, there was a quantifiable difference in axonal diameter consistent with the findings of reduced axonal conduction velocity and of muscle denervation (Table 4) ▶ . Overall, axons in the SOD1−/− mice were significantly smaller by 10.3%. Axonal shrinkage in the SOD1−/− mice was statistically significant for both the large and small axonal populations. At 19 months of age the mean diameter of all axons was not significantly different in the SOD1−/− mice (Table 4) ▶ . When axons greater than 12.5 μm diameter were excluded, axons were statistically smaller by 8.2% in the SOD1−/− mice. The mean for the SOD1−/− mice was skewed by a few exceedingly large axons, the largest of which measured 39 μm in diameter. Diameters of large and small axons separately were not statistically significantly different. However, eliminating the swollen axons (> 12.5 μm diameter) again resulted in a significant shrinkage of the large axons in the SOD1−/− mice of 9.4%.
Table 3.
Numbers of Myelinated Axons in L3 Roots
| SOD1+/+ | SOD1−/− | P value | |
|---|---|---|---|
| Ventral root | |||
| 6 months | 772 ± 65 (n = 5) | 803 ± 47 (n = 4) | 0.74 |
| 19 months | 855 ± 50 (n = 5) | 846 ± 54 (n = 5) | 0.90 |
| Dorsal root | |||
| 19 months | 2186 ± 87 (n = 5) | 2209 ± 113 (n = 4) | 0.87 |
Table 4.
Axon Diameters in L3 Ventral Roots
| SOD1+/+ | SOD1−/− | P value | |
|---|---|---|---|
| 6 months | (n = 5) | (n = 4) | |
| All axons | 5.35 ± 0.08 | 4.80 ± 0.08 | 0.002 |
| Large axons | 7.61 ± 0.16 | 6.66 ± 0.28 | 0.02 |
| Small axons | 2.50 ± 0.09 | 2.23 ± 0.02 | 0.05 |
| 19 months | (n = 5) | (n = 5) | |
| All axons | 5.29 ± 0.13 | 4.98 ± 0.13 | 0.17 |
| Axons ≤12.5 μm | 5.26 ± 0.16 | 4.83 ± 0.11 | 0.04 |
| Large axons | 7.31 ± 0.20 | 6.79 ± 0.15 | 0.07 |
| Large axons ≤12.5 μm | 7.26 ± 0.21 | 6.58 ± 0.05 | 0.03 |
| Small axons | 2.38 ± 0.07 | 2.18 ± 0.06 | 0.06 |
The separation between large and small axons was placed at about 4.5 μm. Thickness of myelin sheath also contributed to the discrimination for axons measuring about 4.5 μm. Axons with thick myelin sheaths were classified as large axons, those with thin sheaths as small axons. The cutoff for swollen axons was set at 12.5 μm because this was well above the maximum axonal size observed at 6 months of age and would not exclude mildly swollen axons, which occurred in both SOD1+/+ and SOD1−/− mice at 19 months of age.
Dorsal roots of L3 appeared normal in the SOD1−/− mice at 6 and 17 months of age. At 19 months of age both SOD1+/+ and SOD1−/− mice had a few axons that appeared swollen or degenerating. These changes in the dorsal roots were less severe than those in the ventral roots and less severe in the SOD1+/+ than in the SOD1−/− mice. Numbers of myelinated axons in L3 dorsal roots were not significantly different between the SOD1+/+ and SOD1−/− mice at 19 months of age (Table 3) ▶ . Diameters of myelinated axons in L3 dorsal root were slightly reduced at 19 months in the SOD1−/− mice due to a reduction in diameter of axons of all sizes. Average diameter was 3.06 ± 0.10 μm in the SOD1−/− mice and was 3.24 ± 0.11 μm in the SOD1+/+ mice. The 5.6% reduction in diameter in the SOD1−/− mice was statistically significant (P < 0.033). The magnitude of the size reduction, about 0.2 μm, was similar to that observed for the small axons of the ventral root.
Rescue of the Motor Neuron Axonopathy
To determine whether the dysfunction induced by lack of Cu/Zn SOD originated in the motor neuron itself or in the periphery, we looked for the observed muscle pathology in mice which were genetically engineered to express Cu/Zn SOD only in brain and spinal cord. This was accomplished by designing a transgene in which mouse SOD1 was under the control of the neuron-specific promoter rat synapsin I (Figure 5A) ▶ . Transgenic mice containing mouse SOD1 driven by the rat synapsin I promoter were crossed to generate SOD1−/− mice which were hemizygous or homozygous for the transgene and expressed Cu/Zn SOD in brain and spinal cord but not in skeletal muscle (Figure 2F) ▶ or other peripheral tissues (Figure 5B) ▶ . Quantification of Western blots for brain indicated that homozygous transgenic synapsin SOD1; SOD1−/− mice had levels of brain Cu/Zn SOD similar to those in SOD1+/− mice, ie, about 50% of wild-type levels (3.55 versus 3.45 optical density units, respectively, n = 2 per group). Consistent with the protein levels, hemizygous transgenic synapsin SOD1 mice were found by RNase protection assay to express transgene mRNA at about 25% of endogenous wild type levels (data not shown). Hemizygous and homozygous transgenic synapsin SOD1; SOD1−/− mice showed no evidence for fiber type grouping or fiber atrophy indicative of muscle denervation at 12 months of age (Figure 2E) ▶ .
Figure 5.

A: Schematic diagram of the neuron-specific rat synapsin I promoter-mouse SOD1 transgene. This is not drawn to scale and indicates the locations of known restriction sites. The cross-hatched box (left) represents the 4.5-kb rat synapsin promoter used to target SOD1 expression to neurons. The promoter is followed by a 127-bp segment of the SV40 small t intron used as a linker (striped box). Using polymerase chain reaction-based methods, the 9-bp Kozak translation initiation consensus sequence (black box) and a HindIII restriction site (H) were placed downstream of the linker. These are followed by the 5 exons (numbered open boxes) comprising the 530-bp mouse SOD1 cDNA (right). The ATG start codon in exon 1 is shown, as well as an Xho I (X) site that was added to the 3′-terminus of the cDNA. Restriction enzyme sites: Sa, Sal I; B, Bam HI; E, Eco RI; Sp, Sph I; Sm, Sma I; Bs, Bst NI. B: Cu/Zn SOD protein levels in peripheral tissues and brain in a SOD1+/− mouse (left lanes) and a hemizygous transgenic synapsin SOD1; SOD1−/− mouse (right lanes) for each tissue. Exposures of 20 seconds and 2 minutes are shown. All lanes were loaded with 0.25 μg of total protein. Tissues: Ad, adrenal gland; Ht, heart; Lu, lung; Ki, kidney; Pa, pancreas; Th, thymus; Sp, spleen; SI, small intestine (proximal); Sk, skin from ears; Li, liver; Bl, whole blood; St, stomach; Br, brain.
Discussion
Neuromuscular pathology was observed in SOD1−/− mice consisting of hindlimb muscle atrophy and fiber type grouping and peripheral nerve conduction deficits. These data also revealed a greater dysfunction of motor axons than of sensory axons. Behavioral tesing at 4, 6, and 14 months showed that the deficits were chronic. The rod running behavioral test suggested that the deficits were progressive with age while the stride length test did not. Neuromuscular deficits are usually indicative of either a neuropathy or motor neuron disease, such as ALS. Because mutations of Cu/Zn SOD have been implicated in FALS, 9 we compared the results in the SOD1−/− mice with those reported for transgenic mouse models of FALS. 10-14 SOD1−/− mice showed some signs of muscle weakness, but the weakness did not progress to paralysis, as occurs in the transgenic FALS mice. In SOD1−/− mice there was sparing of the forelimbs, whereas both hind- and forelimbs are involved in the transgenic FALS mice. SOD1−/− mice did not show a loss of axons in the ventral roots of the lumbar cord. These observations in the SOD1−/− mice are thus consistent with a chronic peripheral neuropathy, as opposed to a motor neuron disease.
We next characterized several aspects of the deficit. At 6 months of age there was no evidence of axonal or myelin damage in the L3 ventral root or in the tibial nerve, despite marked changes to hindlimb muscles and their intramuscular nerves. This observation suggested a primary etiology within the axons themselves, in particular at or near the NMJs. Specific increases in the distal latency of plantar muscle responses supported this contention.
Because inherited peripheral neuropathies of humans usually involve both motor and sensory axons, 39,40 we further examined the somatosensory system. In the SOD1−/− mice, changes in sensory behavior and physiology were not significant. However, morphological changes in the sensory system were significant, albeit not as robust as those in the motor system. The magnitude of the decrement in the conduction velocity of tibial motor axons was about 10 m/second and that of sural sensory axons about 4 m/second in the SOD1−/− mice. There were corresponding reductions in mean axonal diameter of about 0.5 μm in the ventral root at 6 months and about 0.2 μm in the dorsal root at 19 months in the SOD1−/− mice. There is a well established linear relationship between conduction velocity and diameter in myelinated axons, 41 and the magnitude of the change in conduction velocity and mean axonal diameter in the sensory nerves was consistent with the change in the motor nerves, ie, a 2-m/second decrement in conduction velocity for each 0.1-μm decrement in mean axonal diameter. The lesser effect on sensory axons compared with motor axons may be due to their smaller size. Small ventral root γ motor axons also showed less reduction (about 0.2–0.25 μm) in axonal diameter than large ventral root α motor axons. Greater shrinkage of larger sensory axons (3–4 μm diameter) occurred than of smaller sensory axons (1.25 μm diameter) (data not shown). Because we have no data on the distribution of sensory and motor axons in the mixed caudal nerve, we can say only that the intermediate reduction in conduction velocity in this nerve can be viewed as consistent with the foregoing conclusions.
Several mechanisms might explain how a lack of Cu/Zn SOD could cause a neuropathy, including 1) a direct effect on neurons, 2) a secondary effect on neurons following a change in the innervated tissue (eg, muscle), and 3) an indirect systemic effect. By replacing Cu/Zn SOD only in the brain and spinal cord, we have demonstrated that the presence of neuronal Cu/Zn SOD is sufficient to prevent the neuropathy and, therefore, the lack of Cu/Zn SOD in hindlimb motor neurons directly impairs their ability to maintain NMJs.
It is intriguing that although Cu/Zn SOD is present in virtually all mammalian cell types, motor neurons are particularly sensitive to alterations of this enzyme, whether it is a deficiency of Cu/Zn SOD (SOD1−/− mice) or a mutant form of the enzyme (transgenic mice bearing FALS mutant Cu/Zn SOD). The fact that alterations in Cu/Zn SOD produce pathology suggests that motor neurons are extremely sensitive to free radical-mediated pathogenesis. Yet there are distinct pathologies associated with increased levels of O2•− (SOD1−/− mice) and with increased levels of the free radicals that may stem from an interaction with peroxynitrite (FALS transgenic mice). 15,16 Despite especially high levels of SOD1 mRNA 42 and Cu/Zn SOD protein 43 in motor neurons compared with other types of neurons, motor neurons can apparently survive without Cu/Zn SOD and can maintain NMJs with far lower than normal levels of Cu/Zn SOD. It might have been predicted from the study on facial nerve axotomy in SOD1−/− mice 27 that motor neurons with disrupted NMJs would die. Motor neuron death was clearly not a sequela of hindlimb neuropathy in the SOD1−/− mice. Levels of Cu/Zn SOD were quite low (about 25% of normal) in the hemizygous transgenic synapsin SOD1, SOD1−/− mice, but were sufficient to prevent the neuropathy. Despite how well hindlimb motor neurons survived without Cu/Zn SOD, they still suffered a spontaneous chronic peripheral neuropathy. The fact that only hindlimb motor neurons underwent neuropathy in the SOD1−/− mice suggests that these neurons have a greater requirement for Cu/Zn SOD than the other motor neurons of the body. Because pathology was present in the hip as well as in the thigh and leg musculature, it is unlikely that the greater length of axons of the hindlimb motor neurons alone puts these neurons at greater risk in the SOD1−/− mice. Motor neurons innervating the hindlimb, except for those supplying the foot, are the largest in the body. 44 Perhaps cell body size and motor unit size, as well as axonal diameter and length, contribute to the susceptibility of these motor neurons in the SOD1−/− mouse. In conclusion, we have demonstrated that the absence of Cu/Zn SOD in neurons results in a chronic peripheral neuropathy that primarily involves the motor axons of the hindlimb.
Acknowledgments
We thank Edwin McCabe and Renee Simmons for dedicated and expert care of the animals, Mark Gurney, Barbara Herr, and Diane Lang for advice with technical procedures, and Jim Mahaffey for providing the mouse SOD1 cDNA clone.
Footnotes
Address reprint requests to Dorothy G. Flood, Cephalon, Inc., 145 Brandywine Parkway, West Chester, PA 19380. E-mail: dflood@cephalon.com.
References
- 1.Gutteridge JMC: Free radicals in disease processes: a compilation of cause and consequence. Free Rad Res Commun 1993, 19:141-158 [DOI] [PubMed] [Google Scholar]
- 2.Good PF, Werner P, Hsu A, Olanow CW, Perl DP: Evidence for neuronal oxidative damage in Alzheimer’s disease. Am J Pathol 1996, 149:21-28 [PMC free article] [PubMed] [Google Scholar]
- 3.Yan SD, Chen X, Fu J, Chen M, Zhu H, Roher A, Slattery T, Zhao L, Nagashima M, Morser J, Migheli A, Nawroth P, Stern D, Schmidt AM: RAGE and amyloid-β peptide neurotoxicity in Alzheimer’s disease. Nature 1996, 382:685-691 [DOI] [PubMed] [Google Scholar]
- 4.Yankner BA: Mechanisms of neuronal degeneration in Alzheimer’s disease. Neuron 1996, 16:921-932 [DOI] [PubMed] [Google Scholar]
- 5.Browne SE, Bowling AC, MacGarvey U, Beal MF: Oxidative DNA damage, and impaired mitochondrial metabolism in Huntington’s disease. Soc Neurosci Abstr 1995, 21:489 [Google Scholar]
- 6.Dexter DT, Sian J, Rose S, Hindmarsh JG, Mann VM, Cooper JM, Wells FR, Daniel SE, Lees AJ, Schapira AHV, Jenner P, Marsden CD: Indices of oxidative stress and mitochondrial function in individuals with incidental Lewy body disease. Ann Neurol 1994, 35:38-44 [DOI] [PubMed] [Google Scholar]
- 7.Yoritaka A, Hattori N, Uchida K, Tanaka M, Stadtman ER, Mizuno Y: Immunohistochemical detection of 4-hydroxynonenal protein adducts in Parkinson disease. Proc Natl Acad Sci USA 1996, 93:2696-2701 [DOI] [PMC free article] [PubMed] [Google Scholar]
- 8.Shaw PJ, Ince PG, Falkous G, Mantle D: Oxidative damage to protein in sporadic motor neuron disease spinal cord. Ann Neurol 1995, 38:691-695 [DOI] [PubMed] [Google Scholar]
- 9.Rosen DR, Siddique T, Patterson D, Figlewicz DA, Sapp P, Hentati A, Donaldson D, Goto J, O’Regan JP, Deng H-X, Rahmani Z, Krizus A, McKenna-Yasek D, Cayabyab A, Gaston SM, Berger R, Tanzi RE, Halperin JJ, Herzfeldt B: Van den Bergh R, Hung W-Y, Bird T, Deng G, Mulder DW, Smyth C, Laing NG, Soriano E, Pericak-Vance MA, Haines J, Rouleau GA, Gusella JS, Horvitz HR, Brown RH Jr: Mutations in Cu/Zn superoxide dismutase gene are associated with familial amyotrophic lateral sclerosis. Nature 1993, 362:59-62 [DOI] [PubMed] [Google Scholar]
- 10.Gurney ME, Pu H, Chiu AY, Dal Canto MC, Polchow CY, Alexander DD, Caliendo J, Hentati A, Kwon YW, Deng H-X, Chen W, Zhai P, Sufit RL, Siddique T: Motor neuron degeneration in mice that express a human Cu,Zn superoxide dismutase mutation. Science 1994, 264:1772-1775 [DOI] [PubMed] [Google Scholar]
- 11.Ripps ME, Huntley GW, Hof PR, Morrison JH, Gordon JW: Transgenic mice expressing an altered murine superoxide dismutase gene provide an animal model of amyotrophic lateral sclerosis. Proc Natl Acad Sci USA 1995, 92:689-693 [DOI] [PMC free article] [PubMed] [Google Scholar]
- 12.Wong PC, Pardo CA, Borchelt DR, Lee MK, Copeland NG, Jenkins NA, Sisodia SS, Cleveland DW, Price DL: An adverse property of a familial ALS-linked SOD1 mutation causes motor neuron disease characterized by vacuolar degeneration of mitochondria. Neuron 1995, 14:1105-1116 [DOI] [PubMed] [Google Scholar]
- 13.Wong PC, Borchelt DR: Motor neuron disease caused by mutations in superoxide dismutase 1. Curr Opin Neurol 1995, 8:294-301 [DOI] [PubMed] [Google Scholar]
- 14.Bruijn LI, Becher MW, Lee MK, Anderson KL, Jenkins NA, Copeland NG, Sisodia SS, Rothstein JD, Borchelt DR, Price DL, Cleveland DW: ALS-linked SOD1 mutant G85R mediates damage to astrocytes, and promotes rapidly progressive disease with SOD1-containing inclusions. Neuron 1997, 18:327-338 [DOI] [PubMed] [Google Scholar]
- 15.Bruijn LI, Beal MF, Becher MW, Schulz JB, Wong PC, Price DL, Cleveland DW: Elevated free nitrotyrosine levels, but not protein-bound nitrotyrosine or hydroxyl radicals, throughout amyotrophic lateral sclerosis (ALS)-like disease implicate tyrosine nitration as an aberrant in vivo property of one familial ALS-linked superoxide dismutase 1 mutant. Proc Natl Acad Sci USA 1997, 94:7606-7611 [DOI] [PMC free article] [PubMed] [Google Scholar]
- 16.Singh RJ, Karoui H, Gunther MR, Beckman JS, Mason RP, Kalyanaraman B: Reexamination of the mechanism of hydroxyl radical adducts formed from the reaction between familial amyotrophic lateral sclerosis-associated Cu,Zn superoxide dismutase mutants and H2O2. Proc Natl Acad Sci USA 1998, 95:6675-6680 [DOI] [PMC free article] [PubMed] [Google Scholar]
- 17.Bruijn LI, Houseweart MK, Kato S, Anderson KL, Anderson SD, Ohama E, Reaume AG, Scott RW, Cleveland DW: Aggregation and motor neuron toxicity of an ALS-linked SOD1 mutant independent from wild-type SOD1. Science 1998, 281:1851-1854 [DOI] [PubMed] [Google Scholar]
- 18.Fridovich I: Superoxide dismutases. Adv Enzymol Relat Areas Molec Biol 1986, 58:61-97 [DOI] [PubMed] [Google Scholar]
- 19.Beyer W, Imlay J, Fridovich I: Superoxide dismutases. Prog Nucl Acid Res Molec Biol 1991, 40:221-253 [DOI] [PubMed] [Google Scholar]
- 20.Bilinski T, Krawiec Z, Liczmanski A, Litwinska J: Is hydroxyl radical generated by the Fenton reaction in vivo? Biochem Biophys Res Commun 1985, 130:533-539 [DOI] [PubMed] [Google Scholar]
- 21.van Loon AP, Pesold-Hurt B, Schatz G: A yeast mutant lacking mitochondrial manganese-superoxide dismutase is hypersensitive to oxygen. Proc Natl Acad Sci USA 1986, 83:3820-3824 [DOI] [PMC free article] [PubMed] [Google Scholar]
- 22.Gralla EB, Kosman DJ: Molecular genetics of superoxide dismutases in yeasts and related fungi. Adv Genet 1992, 30:251-319 [DOI] [PubMed] [Google Scholar]
- 23.Phillips JP, Campbell SD, Michaud D, Charbonneau M, Hilliker AJ: Null mutation of copper/zinc superoxide dismutase in Drosophila confers hypersensitivity to paraquat and reduced longevity. Proc Natl Acad Sci USA 1989, 86:2761-2765 [DOI] [PMC free article] [PubMed] [Google Scholar]
- 24.Li Y, Huang T-T, Carlson EJ, Melov S, Ursell PC, Olson JL, Noble LJ, Yoshimura MP, Berger C, Chan PH, Wallace DC, Epstein CJ: Dilated cardiomyopathy and neonatal lethality in mutant mice lacking manganese superoxide dismutase. Nat Genet 1995, 11:376-381 [DOI] [PubMed] [Google Scholar]
- 25.Lebovitz RM, Zhang H, Vogel H, Cartwright J, Jr, Dionne L, Lu N, Huang S, Matzuk MM: Neurodegeneration, myocardial injury, and perinatal death in mitochondrial superoxide dismutase-deficient mice. Proc Natl Acad Sci USA 1996, 93:9782-9787 [DOI] [PMC free article] [PubMed] [Google Scholar]
- 26.Carlsson LM, Jonsson J, Edlund T, Marklund SL: Mice lacking extracellular superoxide dismutase are more sensitive to hyperoxia. Proc Natl Acad Sci USA 1995, 92:6264-6268 [DOI] [PMC free article] [PubMed] [Google Scholar]
- 27.Reaume AG, Elliott JL, Hoffman EK, Kowall NW, Ferrante RJ, Siwek DF, Wilcox HM, Flood DG, Beal MF, Brown RH, Jr, Scott RW, Snider WD: Motor neurons in Cu/Zn superoxide dismutase-deficient mice develop normally but exhibit enhanced cell death after axonal injury. Nat Genet 1996, 13:43-47 [DOI] [PubMed] [Google Scholar]
- 28.Kondo T, Reaume AG, Huang T-T, Carlson E, Murakami K, Chen SF, Hoffman EK, Scott RW, Epstein CJ, Chan PH: Reduction of CuZn-superoxide dismutase activity exacerbates neuronal cell injury and edema formation after transient focal cerebral ischemia. J Neurosci 1997, 17:4180-4189 [DOI] [PMC free article] [PubMed] [Google Scholar]
- 29.Howland DS, Savage MJ, Huntress FA, Wallace RE, Schwartz DA, Loh T, Melloni RH, Jr, DeGennaro LJ, Greenberg BD, Siman R, Swanson ME, Scott RW: Mutant and native human β-amyloid precursor proteins in transgenic mouse brain. Neurobiol Aging 1995, 16:685-699 [DOI] [PubMed] [Google Scholar]
- 30.Bewley GC: cDNA and deduced amino acid sequence of murine Cu-Zn superoxide dismutase. Nucleic Acids Res 1988, 16:2728. [DOI] [PMC free article] [PubMed] [Google Scholar]
- 31.Hoesche C, Sauerwald A, Veh RW, Krippl B, Kilimann MW: The 5′-flanking region of the rat synapsin I gene directs neuron-specific, and developmentally regulated reporter gene expression in transgenic mice. J Biol Chem 1993, 268:26494-26502 [PubMed] [Google Scholar]
- 32.Apfel SC, Arezzo JC, Brownlee M, Federoff H, Kessler JA: Nerve growth factor administration protects against experimental diabetic sensory neuropathy. Brain Res 1994, 634:7-12 [DOI] [PubMed] [Google Scholar]
- 33.Sharma AK, Thomas PK: Peripheral nerve structure and function in experimental diabetes. J Neurol Sci 1974, 23:1-15 [DOI] [PubMed] [Google Scholar]
- 34.Dubowitz V: Muscle Biopsy, A Practical Approach. 2nd Edition. London, Baillière Tindall, 1985, 720 pp
- 35.Gurney ME, Yamamoto H, Kwon Y: Induction of motor neuron sprouting in vivo by ciliary neurotrophic factor and basic fibroblast growth factor. J Neurosci 1992, 12:3241-3247 [DOI] [PMC free article] [PubMed] [Google Scholar]
- 36.Karnes J, Robb R, O’Brien PC, Lambert EH, Dyck PJ: Computerized image recognition for morphometry of nerve attribute of shape of sampled transverse sections of myelinated fibers which best estimates their average diameter. J Neurol Sci 1977, 34:43-51 [DOI] [PubMed] [Google Scholar]
- 37.Hoffman EK, Wilcox HM, Scott RW, Siman R: Proteasome inhibition enhances the stability of mouse Cu/Zn superoxide dismutase with mutations linked to familial amyotrophic lateral sclerosis. J Neurol Sci 1996, 139:15-20 [PubMed] [Google Scholar]
- 38.Carter RB: Differentiating analgesic and non-analgesic drug activities on rat hot plate: effect of behavioral endpoint. Pain 1991, 47:211-220 [DOI] [PubMed] [Google Scholar]
- 39.Bird SJ: Pure motor neuropathy. Curr Opin Neurol Neurosurg 1990, 3:704-707 [Google Scholar]
- 40.Dyck PJ, Chance P, Lebo R, Carney JA: Hereditary motor and sensory neuropathies. 3rd Edition. Dyck PJ Thomas PK Griffin JW Low PA Poduslo JF eds. Peripheral Neuropathy, Volume 2, 1993, :pp 1094-1136 WB Saunders Co, Philadelphia [Google Scholar]
- 41.Brinley FJ, Jr: Excitation and conduction in nerve fibers. 13th Edition. Mountcastle VB eds. Medical Physiology, Volume 1, 1974, :pp 34-76 C.V. Mosby Co, St. Louis [Google Scholar]
- 42.Bergeron K, Petrunka C, Weyer L: Copper/zinc superoxide dismutase expression in the human central nervous system: correlation with selective neuronal vulnerability. Am J Pathol 1996, 148:273-279 [PMC free article] [PubMed] [Google Scholar]
- 43.Pardo CA, Xu Z, Borchelt DR, Price DL, Sisodia SS, Cleveland DW: Superoxide dismutase is an abundant component in cell bodies, dendrites, and axons of motor neurons and in a subset of other neurons. Proc Natl Acad Sci USA 1995, 92:954-958 [DOI] [PMC free article] [PubMed] [Google Scholar]
- 44.McHanwell S, Biscoe TJ: The sizes of motoneurons supplying hindlimb muscles in the mouse. Proc R Soc Lond B 1981, 213:210-216 [DOI] [PubMed] [Google Scholar]