

Abstract
Instability in the repeat size of microsatellite sequences has been described in both hereditary nonpolyposis and sporadic colorectal cancers. Tumors expressing microsatellite instability are identified through the comparison of the repeat sizes at multiple microsatellite loci between tumor and matched normal tissue DNA. The use of a five-marker panel including two mononucleotide repeat microsatellites, BAT-25 and BAT-26, has recently been suggested for the clinical determination of tumor microsatellite instability. The BAT-25 and BAT-26 loci included in this panel have both demonstrated sensitivity to microsatellite instability and normal quasimonomorphic allelic patterns, which has simplified the distinction between normal and unstable alleles. However, in this study, we identified allelic variations in the size of the poly(A) tract at BAT-26 in 12.6% of 103 healthy African-Americans screened. In addition, 18.4% exhibited allelic size variations in the poly(T) tract at BAT-25. Finally, 2.9% showed variant alleles at both BAT-25 and BAT-26 loci. Screening a small population of Nigerians confirmed the polymorphic nature of both loci and the ethnic origin of alleles not identified in other populations studied thus far. Our results dispute the quasimonomorphic nature of both BAT-25 and BAT-26 in all populations and support the need for thorough population studies to define the different allelic profiles and frequencies at microsatellite loci.
Microsatellite instability (MSI), consisting of variations in the length of short, tandemly repeated sequences between tumor and normal DNA from the same individual, 1-3 has been observed in >90% of hereditary nonpolyposis colon cancer tumors (HNPCC), 4 13% of sporadic colorectal cancers, 4 and a varying proportion of extracolonic tumors. MSI is a consequence of defects in DNA repair pathways involving mutations in DNA mismatch repair genes including hMLH1, hMSH2, PMS1, PMS2, hMSH3, 4 and hMSH6. 5 The presence of MSI in tumors is associated with both unique mechanisms of carcinogenesis and clinical characteristics.
Tumor MSI is often determined by comparing the sizes of repeated sequences at multiple microsatellite loci between tumor and normal DNA from the same person. Using this system, the definition of MSI can sometimes be vague, due largely to varying opinions on the number of microsatellite loci to examine and the percentage of loci exhibiting instability needed for the classification of MSI. In 1998, The International Workshop on Microsatellite Instability and RER Phenotypes in Cancer Detection and Familial Predisposition published their endorsement of a five-microsatellite panel for the determination of MSI in tumors. 6 According to their recommendations, tumors may be characterized as having high-frequency MSI (MSI-H) if two or more of the five markers exhibit variations in microsatellite sequences or low-frequency MSI (MSI-L) if only one marker shows instability. 6 Furthermore, microsatellite-stable (MSS) tissue is defined by microsatellite sequences of normal length at all five loci. The recommended five-marker panel consists of three dinucleotide microsatellites and two mononucleotide microsatellites, BAT-25 and BAT-26.
The BAT-26 locus contains a 26-repeat adenine tract and is located within the fifth intron of the MSH2 gene, whereas the BAT-25 locus contains a 25-repeat thymine tract located within intron 16 of the c-kit oncogene. Both loci have been shown to be sensitive markers of MSI, which manifests as a shortening in the size of the respective mononucleotide repeat in tumor DNA. 7-11 However, in MSS tumor or normal tissue, BAT-25 and BAT-26 have been described as quasimonomorphic loci exhibiting little polymorphic variation in the size of the poly(T) or poly(A) tracts, respectively. 8,9,11 Because of the quasimonomorphic profile of both loci, BAT-25 and BAT-26 have proven very useful for the identification of MSI, because shortened, unstable alleles can easily be differentiated from alleles of normal size.
While conducting a retrospective genetic analysis of the involvement of MSI in endometrial adenocarcinomas, one of the most common extracolonic tumors associated with HNPCC, 12 we observed a sample that exhibited the same shift in repeat size at the BAT-26 allele in both tumor and matched normal tissue DNA. Because DNA from both tissues exhibited an allele of identical size, our findings seemed consistent with a polymorphic variant at the BAT-26 locus. Investigation into the ethnic background of this sample revealed its African-American origin, which led us to screen a population of 103 healthy African-Americans to determine the frequency of the BAT-26 polymorphism within this population. To investigate if mononucleotide polymorphisms were restricted to poly(A) tracts in the African-American population, the poly(T) tract at BAT-25 was also analyzed for size variation. Finally, a small population of Nigerians was analyzed at both microsatellite loci to confirm the ethnic origin of the polymorphisms.
Materials and Methods
DNA Isolation from Peripheral Blood
All procedures for the handling of subjects were performed in compliance with the ethical standards of Ohio State University. The African-American population DNA was obtained from healthy blood donors and the DNA was isolated from peripheral blood using standard extraction techniques. 13 The Nigerian population lymphocyte DNA was obtained from eight patients with sporadic colorectal cancer.
Microsatellite Analysis
Microsatellite sequences at BAT-25 and BAT-26 were amplified using previously reported primers. 11 DNA derived from leukocytes or tumor cells was amplified by polymerase chain reaction (PCR) in a 26-ul reaction mixture containing 200 μmol/L dNTPs, 1 U Taq polymerase (Perkin Elmer Biosystems, Foster City, CA), 40 ng of each primer, 2.0 mmol/L MgCl2, 2.5 μl 10× PCR buffer (670 mmol/L Tris, 100 mmol/L β-Mercaptoethanol, 166 mmol/L (NH4)2SO4, 67 μmol/L EDTA, 0.5 μg/ml bovine serum albumin, final pH adjusted to 8.8), and 0.15 μl [α-32P] ATP (10 μci/μl; Amersham, Life Sciences, Arlington Heights, IL). The PCR reaction itself involved an initial denaturation period of 3 minutes at 95°C, 30 cycles of 1 minute at 95°C, 2 minutes at 55°C, and 3 minutes at 72°C, and a final extension step of 8 minutes at 72°C. A volume of loading dye (95% formamide, 10 mmol/L EDTA, 0.1% bromophenol blue, and 0.1% xylene cyanol) equaling one-half the total reaction volume was then added to each reaction. Samples were denatured for 3 minutes at 95°C and kept on ice until loaded onto a 5% polyacrylamide +7M urea gel. Gels were run for 2000 volts for 2 hours at 55°C, transferred to blotting paper (VWR Scientific, Chicago, IL), dried, and exposed to Hyperfilm MP (USB-Amersham Life Science, Cleveland, OH) for 1 hour at room temperature. The mononucleotide repeat sizes of unusual alleles were measured in comparison to that of the most frequently occurring allele, which was scored as 0.
Results
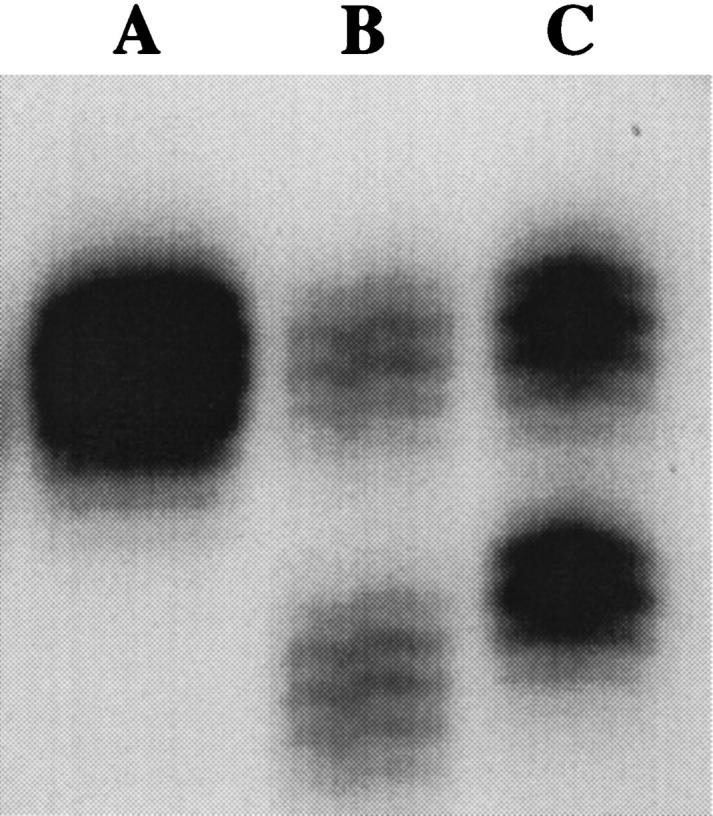
Lane A in Figure 1 ▶ depicts the allelic profile typically seen when the BAT-26 locus is amplified by PCR from MSS DNA. The normal allelic profile of BAT-26 was originally described in a population of 72 healthy individuals of French origin as quasimonomorphic, with one major allele of 26 adenosine repeats and normal size variation not exceeding two nucleotides. 8,9 This profile was further supported through the characterization of 509 Finns 15 and 54 Japanese-Hawaiians, 16 which yielded the same allelic profile and frequency. Consequently, when the BAT-26 locus in MSS DNA is amplified by PCR and the product resolved on a gel, the resulting banding pattern shows both alleles within the range of size variation characterized for normal tissue (Lane A). However, the BAT-26 locus has been shown to be sensitive to MSI. In 18 of 19 colorectal tumors and cell lines with MSI examined in one study, the BAT-26 locus exhibited a loss of adenine repeats ranging from 6 to 16 bp in one allele. 9 When this locus is amplified from tumor DNA exhibiting MSI, the resulting pattern shows one band corresponding to a BAT-26 allele of normal size, possibly due to residual normal tissue DNA, and a lower band demonstrating shortened BAT-26 alleles and microsatellite instability (Lane B).
Figure 1.

Results from the amplification of the BAT-26 locus in normal male lymphocyte DNA (Lane A), colorectal tumor DNA exhibiting MSI (Lane B), and lymphocyte DNA from five representative healthy African-Americans in three different PCR reactions (Lanes C-G). The banding pattern in Lane A shows the allelic profile of 26 adenine repeats previously described for BAT-26 in normal MSS DNA. Lane B (MSI-positive tumor) illustrates the characteristic banding pattern of MSI seen at BAT-26 in which one band corresponds to alleles with shortened mononucleotide repeats (lower band) compared to a second band demonstrating an allele of wild-type repeat length (upper band). Lane C and E depict the banding pattern seen in African-Americans with one allele of 26 repeats (upper bands) and one polymorphic 16-repeat allele (lower bands). Lanes F and G show the patterns seen in African-Americans with one 26 repeat allele (upper bands) and either a 22-repeat (Lane F) or a 4-repeat (Lane G) lower allele, respectively. Lane D shows the banding pattern from an African-American with both BAT-26 alleles within the previously described allelic profile.
While screening a series of endometrial adenocarcinomas, we identified reduced BAT-26 alleles of similar size in both the tumor and matched normal tissue DNA (data not shown). This allele was clearly not in the normal range of size variation described for this locus, but was similar in size to alleles characteristic of MSI. These findings suggested that the reduction in size of the BAT-26 allele observed in this sample was not due to MSI, but most likely a normal polymorphic variation at the BAT-26 locus. Further investigation revealed that the matched tissue samples were from an individual of African-American origin. This led us to screen lymphocyte derived DNA from 103 healthy African-American blood donors to determine the frequency of the polymorphism. Out of 103 blood donors screened, 13 samples (12.6%) were polymorphic at BAT-26 (Table 1) ▶ . All 13 samples displayed alleles of equal intensity, one of which was in the range of size associated with MSI. Eleven of the 13 polymorphic samples exhibited a common allele containing 16 adenine repeats (Figure 1 ▶ , Lanes C and E), while the other two samples showed BAT-26 poly(A) tracts of 22 or 4 repeats, respectively (Figure 1 ▶ , Lanes F and G). Sequence analysis confirmed that the variation in sizes observed in these samples was due to differences in the number of adenine repeats at BAT-26, not to variations in the intervening sequences between the primer sites and the poly(A) tract (data not shown).
Table 1.
BAT-25 and BAT-26 Allele Sizes and Frequencies in African-American Individuals
| Locus | Allele repeat size | Number of alleles (%) |
|---|---|---|
| BAT-26 | 26* | 193 (93.69) |
| 22 | 1 (0.49) | |
| 16 | 11 (5.33) | |
| 4 | 1 (0.49) | |
| Total 206 | ||
| BAT-25 | 25* | 187 (90.77) |
| 19 | 14 (6.80) | |
| 17 | 5 (2.43) | |
| Total 206 |
*Previously described range of allelic size variation.
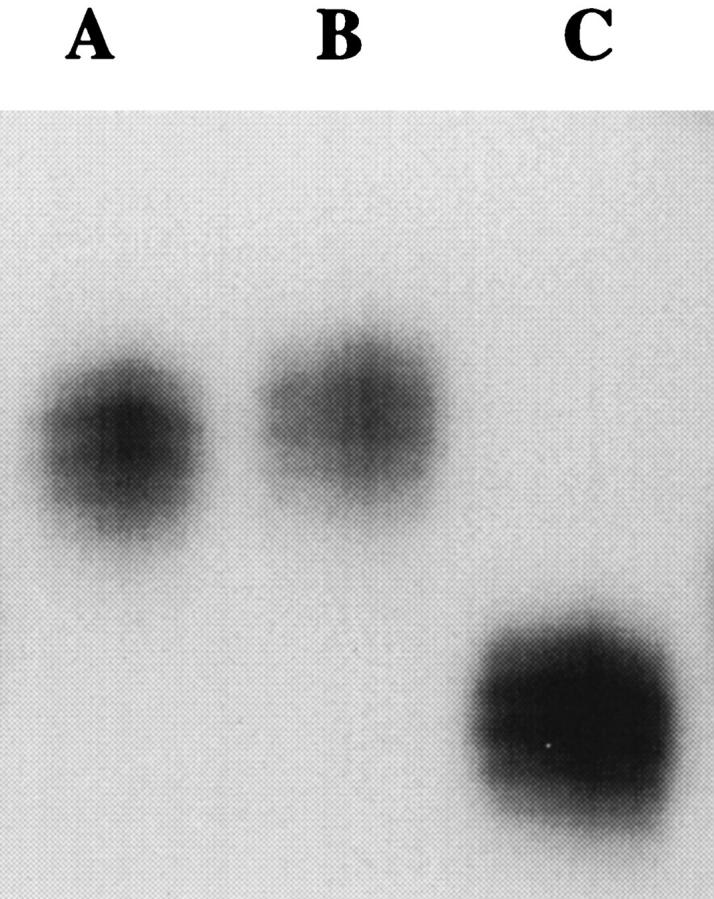
To examine the possibility of polymorphic variation in other mononucleotide repeat microsatellites within the African-American population, the BAT-25 locus was also analyzed. BAT-25 has also been described as a quasimonomorphic locus in normal DNA with one common allele of 25 repeats and normal size variation not exceeding 2 nucleotides. 9 Consequently when the BAT-25 locus is amplified from MSS DNA, the resulting banding pattern shows both alleles within the normal 1- to 2-bp range of variation described for this locus (Figure 2 ▶ , Lane A). In an analysis of nineteen tumors and cell lines with MSI, 100% exhibited shortening of the poly(T) tract at BAT-25 by 4 to 10 bp. 9 As observed at BAT-26, the amplification of the BAT-25 locus from DNA exhibiting MSI results in a two-band pattern with one band corresponding to the normal sized allele and a second demonstrating shortened, unstable alleles (Figure 2 ▶ , Lane B). Screening the same group of 103 healthy African-Americans revealed 19 samples (18.4%) that were polymorphic at BAT-25 (Table 1) ▶ . All polymorphic samples were heterozygous at BAT-25, possessing one allele within the normal range of repeat length and one of two common alleles of 17 or 19 repeats respectively (Table 1) ▶ . Additionally, three samples (2.9%) were found to be polymorphic at both loci with the 16-repeat allele at BAT-26 and either the 17-repeat allele (1 individual) or the 19-repeat allele (2 individuals) at BAT-25.
Figure 2.
Results from the amplification of the BAT-25 locus from normal male lymphocyte DNA (Lane A), colorectal tumor DNA exhibiting MSI (Lane B) , and lymphocyte DNA from one representative healthy African-American (Lane C). The banding pattern in Lane A depicts the allelic pattern of 25 thymine repeats previously described for BAT-25 in normal MSS DNA. Lane B (MSI-positive tumor) illustrates the characteristic banding pattern of MSI seen at BAT-25 with one band corresponding to alleles with shortened mononucleotide repeats (lower band) compared to a second band demonstrating an allele of wild-type repeat length (upper band). Lane C depicts the banding pattern seen in blood DNA from one representative African-American with one allele within the previously described range of size (upper band) and one polymorphic 17-repeat allele (lower band).
Finally, to confirm the origin of the observed BAT-25 and BAT-26 polymorphisms, a small population of eight Nigerians was screened for allele sizes at both BAT-25 and BAT-26. Analysis of lymphocyte DNA from this group revealed two individuals (25%) who were heterozygous at BAT-26 with allele sizes of 26 and 16 adenine repeats (data not shown). Additionally, one individual (12.5%) was found to be polymorphic at both BAT-25 alleles (Figure 3 ▶ , Lane C). Because this Nigerian sample possessed two alleles, both of which were well below the normal range of size variation described for the BAT-25 locus, the allelic frequencies for BAT-25 and BAT-26 were equivalent in this small sample size.
Figure 3.
Results from the amplification of BAT-25 from the lymphocyte DNA from three Nigerians. The banding patterns seen in Lanes A and B demonstrate the range of size previously characterized for the BAT-25 locus at both alleles. Lane C demonstrates the banding pattern seen in one sample from a Nigerian patient with two polymorphic BAT-25 alleles, both with reduced mononucleotide tracts.
Discussion
The use of mononucleotide repeat microsatellites such as BAT-25 and BAT-26 for MSI characterization have been shown to be advantageous over many di-, tri-, or tetranucleotide microsatellites due to the quasimonomorphic nature of both loci and their sensitivity to MSI. The allelic patterns of both BAT-25 and BAT-26 described thus far in European and Japanese-Hawaiian populations appear highly homogenous, with one major allele and small ranges of normal size variation for both loci. 8,9,15,16 However, both loci have demonstrated sensitivity to MSI, which manifests as the loss of a variable number of mononucleotide repeats resulting in alleles of shortened size in a majority of tumors analyzed for MSI. In a series of studies, the BAT-26 locus exhibited a reduction in the number of adenine repeats in 18 of 19 colorectal tumors, 9 100% of 27 cell lines, 11 and 41 of 42 colorectal tumors and cell lines. 8 BAT-25 has also demonstrated a reduction in the number of thymine repeats in a majority of colorectal tumors and cell lines examined. 10,11 Because of the small allelic profile and the stability in normal tissue seen at both loci, the distinction between normal and unstable alleles is relatively simple; any variation in size seen in tumor DNA could be attributed solely to the effects of MSI. This has led some investigators to suggest that MSI can be characterized using the BAT-26 locus without the need for matched normal tissue DNA for comparison. 8,9,17 Although this procedure does appear sound, because BAT-26 alleles are of almost constant size in the populations examined thus far, The International Workshop on Microsatellite Instability and RER Phenotypes in Cancer Detection and Familial Predisposition recommended that all studies using BAT-26 for MSI determination should continue using matched normal/tumor DNA pairs due to the limited knowledge of BAT-26 allelic profiles in different racial and ethnic populations. 6
The literature does contain some suggestive evidence of greater allelic variation at the BAT-26 locus. The analysis of 78 gliomas resulted in two samples, each of which exhibited one shortened BAT-26 allele of either 7 or 12 bases in both tumor and matched normal DNA. 17 Similarly, the examination of MSI in 31 thyroid cancers revealed one sample that exhibited a shortening of one BAT-26 allele by 7 bp but no size variation at two other mononucleotide repeat microsatellites. 17 Although the authors referred to these three samples as false positives, the failure to detect instability at other microsatellite loci and their presence in both tumor and normal DNA suggest the presence of a polymorphism at BAT-26. Additionally, Weber and Rodriguez-Bigas have reported to the MSH2 database (www.nfdht.nl/) a 10-bp deletion at BAT-26. Although no attempts were made to determine the frequencies or to identify the ethnic background of any of the above-mentioned alleles, these results do support the polymorphic nature of this locus. Finally, Perucho has recently described unpublished observations suggesting that 2 to 4% of the population, especially African-Americans, could carry shortened BAT-26 alleles. 18
This study has clearly demonstrated the presence of BAT-26 alleles in the size range characteristic of MSI from healthy African-American DNA. Of the African-Americans screened, 12.6% demonstrated alleles within this range and 11 of 13 individuals shared a common allele of 16 adenosine repeats. Additionally, 18.4% of African-Americans were polymorphic at BAT-25 and 2.9% were found to be polymorphic at both loci. Screening a small Nigerian population further supported the high frequency and African origin of these polymorphisms. Unfortunately, we were not able to demonstrate the stable inheritance of polymorphic alleles at either the BAT-25 or BAT-26 loci, because the one extended family we examined was not informative at either loci. However, the identification of alleles of common size at both BAT-25 and BAT-26 in the African-American population screened suggests that the transmission of alleles at both loci is stable and does not result in the progressive loss of mononucleotide repeats at either site over generations.
The presence of a common BAT-26 allele of 16 repeats in both populations examined could be explained by either a founder chromosome, suggesting a common origin, or by recombinogenic sequences such as Alu repeats resulting in independent recombination events. Because BAT-26 polymorphisms appear to be population-dependent and the most common variant 16-repeat allele has been documented in both indigenous African and African-American populations, there appears to be indirect evidence of a common origin of the16-repeat allele resulting from a single event in Africa. To support the suggested origin of this common BAT-26 allele, extensive haplotype analysis would need to be conducted to establish the existence of a founder chromosome. In any case, this study has shown a higher degree of polymorphism exists at both BAT-25 and BAT-26 in ethnic African populations compared to either the European or Asian populations that have been examined thus far. Because evolutionarily older populations have been shown to demonstrate more genetic diversity, these results further support the older age of the African population compared to either the European or Japanese-Hawaiian populations.
The identification of multiple alleles at both BAT-25 and BAT-26 clearly disputes the quasimonomorphic allelic profile of both loci in all populations. This study has demonstrated the presence of normal alleles at both BAT-25 and BAT-26 that are within the range of size associated with MSI and thus could be misinterpreted. If MSI analyses using BAT-25 and BAT-26 were conducted on tumor DNA without matched normal tissue, then approximately 28% of African-Americans would be polymorphic at one of the loci and therefore could be incorrectly classified as MSI-positive. Consequently, we recommend that matched normal tissue DNA be required for the comparison of test results for all samples showing microsatellite sequences suggestive of MSI. Most importantly, when new microsatellite sequences are elucidated, thorough population studies must be conducted to identify the allelic profiles and frequencies at these loci before they can be used appropriately for diagnostic testing.
Footnotes
Address reprint requests to Tom Prior, Ph.D., Ohio State University, Hamilton Hall 121, 1645 Neil Avenue, Columbus, OH 43201. E-mail: prior-1@medctr.osu.edu.
Supported by National Institutes of Health grants CA67941 (to A. d. l. C.) and CA 16058 (to Ohio State University Comprehensive Cancer Center).
References
- 1.Thibodeau SN, Bren G, Schaid D: Microsatellite instability in cancer of the proximal colon. Science 1993, 260:816-819 [DOI] [PubMed] [Google Scholar]
- 2.Aaltonen LA, Peltomaki P, Leach FS, Sistonen P, Pylkkanen L, Mecklin J-P, Jarvinen H, Powell SM, Jen J, Hamilton SR, Petersen GM, Kinzler KW, Vogelstein B, de la Chapelle A: Clues to the pathogenesis of familial colorectal cancer. Science 1993, 260:812-815 [DOI] [PubMed] [Google Scholar]
- 3.Ionov Y, Peinado MA, Malkhosyan S, Shibata D, Perucho M: Ubiquitous somatic mutations in simple repeated sequences reveal a new mechanism for colonic carcinogenesis. Nature 1993, 363:558-561 [DOI] [PubMed] [Google Scholar]
- 4.Kinzler KW, Vogelstein B: Lessons from hereditary colorectal cancer. Cell 1996, 87:159-170 [DOI] [PubMed] [Google Scholar]
- 5.Fishel R, Wilson T: MutS homologs in mammalian cells. Curr Opin Genet Dev 1997, 7:105-113 [DOI] [PubMed] [Google Scholar]
- 6.Boland CR, Thibodeau SN, Hamilton SR, Sidransky D, Eshleman JR, Burt RW, Meltzer SJ, Rodriguez-Bigas MA, Fodde R, Ranzani GN, Srivastava S: A National Cancer Institute workshop on microsatellite instability for cancer detection and familial predisposition: development of international criteria for the determination of microsatellite instability in colorectal cancer. Cancer Res 1998, 58:5248-5257 [PubMed] [Google Scholar]
- 7.Papadopoulos N, Nicolaides NC, Liu B, Parsons R, Lengauer C, Palombo F, D’Arrigo A, Markowitz S, Willson JKV, Kinzler KW, Jiricny J, Vogelstein B: Mutations of GTBP in genetically unstable cells. Science 1995, 268:1915-1917 [DOI] [PubMed] [Google Scholar]
- 8.Hoang J-M, Cottu PH, Benedicte T, Salmon RJ, Thomas G, Hamelin R: Bat-26, an indicator of the replication error phenotype in colorectal cancers and cell lines. Cancer Res 1997, 57:300-303 [PubMed] [Google Scholar]
- 9.Zhou X-P, Hoang J-M, Cottu P, Thomas G, Hamelin R: Allelic profiles of mononucleotide repeat microsatellites in control individuals and in colorectal tumors with and without replication errors. Oncogene 1997, 15:1713-1718 [DOI] [PubMed] [Google Scholar]
- 10.Dietmaier W, Wallinger S, Bocker T, Kullmann F, Fishel R, Ruschoff J: Diagnostic microsatellite instability: definition and correlation with mismatch repair protein expression. Cancer Res 1997, 57:4749-4756 [PubMed] [Google Scholar]
- 11.Parsons R, Myeroff LL, Liu B, Willson JKV, Markowitz SD, Kinzler KW, Vogelstein B: Microsatellite instability and mutations of the transforming growth factor B type II receptor gene in colorectal cancer. Cancer Res 1995, 55:5548-5550 [PubMed] [Google Scholar]
- 12.Lynch HT, Smyrk TC, Watson P, Lanspa SJ, Lynch JF, Lynch PM, Cavalieri RJ, Boland CR: Genetics, natural history, tumor spectrum, and pathology of hereditary nonpolyposis colorectal cancer: an updated review. Gastroenterology 1993, 104:1535-1549 [DOI] [PubMed] [Google Scholar]
- 13.Miller SA, Dykes DD, Polesky HF: A simple salting out procedure for extraction of DNA from human nucleated cells. Nucleic Acids Res 1988, 16:1215. [DOI] [PMC free article] [PubMed] [Google Scholar]
- 14.Chadwick RB, Conrad MP, McGinnis MD, Johnston-Dow LA, Spurgeon SL, Kronick MN: Heterozygote and mutation detection by direct automated fluorescent DNA sequencing using a mutant Tag DNA polymerase. Biotechniques 1996, 20:676-683 [DOI] [PubMed] [Google Scholar]
- 15.Aaltonen LA, Salovaara R, Kristo P, Canzian F, Hemminki A, Peltomaki P, Chadwick RB, Kaariainen H, Eskelinin M, Jarvinen H, Mecklin J-P, de la Chapelle A: Incidence of hereditary nonpolyposis colorectal cancer and the feasibility of molecular screening for the disease. N Engl J Med 1998, 338:1481-1487 [DOI] [PubMed] [Google Scholar]
- 16.Prior TW, Chadwick RB, Papp AC, Arcot AN, Isa AM, Pearl DK, Stemmermann G, Percesepe A, Loukola A, Aaltonen LA, de la Chapelle A: The I1307K polymorphism of the APC gene in colorectal cancer. Gastroenterology 1999, 116:1-7 [DOI] [PubMed] [Google Scholar]
- 17.Zhou X-P, Hoang J-M, Li Y-J, Seruca R, Careiro F, Sobrinho-Simoes M, Lothe RA, Gleeson CM, Russel SEH, Muzeau F, Flejou J-F, Hoang-Xuan K, Lidereau R, Thomas G, Hamelin R: Determination of the replication error phenotype in human tumors without the requirement for matching normal DNA by analysis of mononucleotide repeat microsatellites. Genes Chromosomes Cancer 1998, 21:101-107 [DOI] [PubMed] [Google Scholar]
- 18.Perucho M: Correspondence re: Boland et al, A national cancer institute workshop on microsatellite instability for cancer detection and familial predisposition: development of international criteria for the determination of microsatellite instability in colorectal cancer. Cancer Res 1999, 59:249-256 [PubMed] [Google Scholar]