Abstract
Id proteins antagonize basic helix-loop-helix proteins, inhibit differentiation, and enhance cell proliferation. In this study we compared the expression of Id-1, Id-2, and Id-3 in the normal pancreas, in pancreatic cancer, and in chronic pancreatitis (CP). Northern blot analysis demonstrated that all three Id mRNA species were expressed at high levels in pancreatic cancer samples by comparison with normal or CP samples. Pancreatic cancer cell lines frequently coexpressed all three Ids, exhibiting a good correlation between Id mRNA and protein levels, as determined by immunoblotting with highly specific anti-Id antibodies. Immunohistochemistry using these antibodies demonstrated the presence of faint Id-1 and Id-2 immunostaining in pancreatic ductal cells in the normal pancreas, whereas Id-3 immunoreactivity ranged from weak to strong. In the cancer tissues, many of the cancer cells exhibited abundant Id-1, Id-2, and Id-3 immunoreactivity. Scoring on the basis of percentage of positive cells and intensity of immunostaining indicated that Id-1 and Id-2 were increased significantly in the cancer cells by comparison with the respective controls. Mild to moderate Id immunoreactivity was also seen in the ductal cells in the CP-like areas adjacent to these cells and in the ductal cells of small and interlobular ducts in CP. In contrast, in dysplastic and atypical papillary ducts in CP, Id-1 and Id-2 immunoreactivity was as significantly elevated as in the cancer cells. These findings suggest that increased Id expression may be associated with enhanced proliferative potential of pancreatic cancer cells and of proliferating or dysplastic ductal cells in CP.
Basic helix-loop-helix (bHLH) proteins play an important role as transcription factors in cellular development, proliferation, and differentiation. 1,2 The basic domain of the bHLHs is required for binding to an E-box DNA sequence, thus promoting transcription of specific target genes. The HLH domain promotes dimer formation with various members of the bHLH protein family. 1,2 Homodimers of the class B family of bHLH proteins, including MyoD, NeuroD, and numerous other proteins, are known to activate tissue-specific genes. 3-5 These tissue-specific bHLHs typically form heterodimers with widely expressed class A bHLHs, which include proteins encoded by E2A, E2–2, HEB, and other genes (also termed E-proteins). 6-9 These heterodimers activate transcription of genes that are associated with differentiation.
Id genes encode a family of four HLH proteins that lack the basic DNA binding domain. 1,10 They act as dominant-negative HLH proteins by forming high affinity heterodimers with other bHLH proteins, thereby preventing them from binding to DNA and inhibiting transcription of differentiation-associated genes. 10-12 Id gene expression is down-regulated on differentiation in many cell types in vitro and in vivo. 13-18 In addition, Id proteins seem to be required for cell cycle progression through G1/S phase in certain cell types, and interaction between Id-2 and pRB is associated with enhanced proliferation in some cell lines in vitro. 19-23
Pancreatic cancer is the fifth leading cause of cancer death in the United States, with a mortality rate that virtually equals its incidence rate. 24 This malignancy is often associated with the overexpression of a variety of mitogenic growth factors and their receptors, and by oncogenic mutations of K-ras and inactivation of the p53 tumor suppressor gene. 25 We have recently reported that pancreatic cancers overexpress the HLH protein Id-2, and that enhanced expression of this protein is evident in the cytoplasm of the cancer cells within the pancreatic tumor mass. 26 It is not known, however, whether the expression of other Id proteins is altered in this malignancy, or whether their expression is altered in chronic pancreatitis (CP), an inflammatory disease that is characterized by dysplastic ducts, foci of proliferating ductal cells, acinar cell degeneration, and fibrosis. 27 We now report that there is a five- to sixfold increase in Id-1 and Id-2 mRNA levels and a twofold increase in Id-3 mRNA levels in pancreatic cancer by comparison with the normal pancreas. In contrast, overall Id mRNA levels are not increased in CP.
Patients and Methods
Normal human pancreatic tissue samples from 7 male and 5 female donors (median age 41.8 years, range 14–68 years), CP tissues from 13 males and 1 female (median age 42.1 years; range 30–56 years), and pancreatic cancer tissues from 10 male and 6 female donors (median age 62.6 years; range 53–83 years) were obtained through an organ donor program and from surgical specimens from patients with severe symptomatic chronic pancreatitis or pancreatic cancer. A partial duodenopancreatectomy (Whipple/pylorus-preserving Whipple; n = 13), a left resection of the pancreas (n = 2), or a total pancreatectomy (n = 1) were carried out in the pancreatic cancer patients. According to the TNM classification of the Union Internationale Contre le Cancer (UICC) 6 tumors were stage 1, 1 was stage 2, and 9 were stage 3 ductal cell adenocarcinoma. Freshly removed tissue samples were fixed in 10% formaldehyde solution for 12 to 24 hours and paraffin-embedded for histological analysis. In addition, tissue samples were frozen in liquid nitrogen immediately on surgical removal and maintained in −80°C until use for RNA extraction. All studies were approved by the Ethics Committee of the University of Bern, Bern, Switzerland, and by the Human Subjects Committee at the University of California, Irvine, California.
Northern Blot Analysis
Northern blot analysis was carried out as described previously. 26,28 Briefly, total RNA was extracted by the single step acid guanidinium thiocyanate phenol chloroform method. RNA was size-fractionated on 1.2% agarose/1.8 mol/L formaldehyde gels, electrotransferred onto nylon membranes, and cross-linked by UV irradiation. Blots were prehybridized and hybridized with cDNA probes and washed under high stringency conditions. The following cDNA probes were used: a 979-bp human Id-1 cDNA probe, a 440-bp human Id-2 cDNA probe, and a 450-bp human Id-3 cDNA probe, covering the entire coding regions of Id-1, Id-2, and Id-3, respectively. A BamHI 190-bp fragment of mouse 7S cDNA that hybridizes with human cytoplasmic RNA was used to confirm equal RNA loading and transfer. Blots were then exposed at −80°C to Kodak BioMax-MS films and the resulting autoradiographs were scanned to quantify the intensity of the radiographic bands. 26,28 For each sample the ratio of Id mRNA expression to 7S expression was calculated. To compare the relative increase in expression of the respective Id mRNA species in the cancer and CP samples, the same normal samples were used for normal/cancer and normal/CP membranes. The median score for Id-1, Id-2, and Id-3 mRNA levels in these normal samples was set to 100. Statistical analysis was performed with SigmaStat software (Jandel Scientific, San Raphael, CA). The rank sum test was used, and P < 0.05 was taken as the level of significance.
Cell Culture and Western Blot Analysis
PANC-1, MIA-PaCa-2, ASPC-1, and CAPAN-1 human pancreatic cell lines were obtained from ATCC (Manassas, VA). COLO-357 human pancreatic cells were a gift from Dr. R. S. Metzger (Durham, NC). Cells were routinely grown in DMEM (COLO-357, MIA-PaCa-2, PANC-1) or RPMI (ASPC-1, CAPAN-1) supplemented with 10% fetal bovine serum, 100 U/ml penicillin, and 100 μg/ml streptomycin. For immunoblot analysis, exponentially growing cells (60–70% confluent) were solubilized in lysis buffer containing 50 mmol/L Tris-HCl, pH 7.4, 150 mmol/L NaCl, 1 mmol/L EDTA, 1 μg/ml pepstatin A, 1 mmol/L phenylmethylsulfonyl fluoride (PMSF), and 1% Triton X-100. Proteins were subjected to sodium dodecyl sulfate polyacrylamide gel electrophoresis (SDS-PAGE), transferred to Immobilon P membranes, and incubated for 90 minutes with the indicated antibodies and for 60 minutes with secondary antibodies against rabbit IgG. Visualization was performed by enhanced chemiluminescence.
Immunohistochemistry
Specific rabbit anti-human Id-1 (C-20), Id-2 (C-20), and Id-3 (C-20; all from Santa Cruz Biotechnology, Santa Cruz, CA) polyclonal antibodies were used for immunhistochemistry. These affinity-purified rabbit polyclonal antibodies specifically react with Id-1, Id-2, and Id-3, respectively, of human origin, as determined by Western blotting. Paraffin-embedded sections (4 μm) were subjected to immunostaining using the streptavidin-peroxidase technique. Where indicated, immunostaining for all three Id proteins was performed on serial sections. Endogenous peroxidase activity was blocked by incubation for 30 minutes with 0.3% hydrogen peroxide in methanol. Tissue sections were incubated for 15 minutes (23°C) with 10% normal goat serum and then incubated for 16 hours at 4°C with the indicated antibodies in PBS containing 1% bovine serum albumin. Bound antibodies were detected with biotinylated goat anti-rabbit IgG secondary antibodies and streptavidin-peroxidase complex, using diaminobenzidine tetrahydrochloride as the substrate. Sections were counterstained with Mayer’s hematoxylin. Preabsorption with Id-1-, Id-2-, or Id-3-specific blocking peptides completely abolished immunoreactivity of the respective primary antibody. The immunohistochemical results were semiquantitatively analyzed as described previously. 29,30 The percentage of positive cancer cells was stratified into four groups: 0, no cancer cells exhibiting immunoreactivity; 1, <33% of the cancer cells exhibiting immunoreactivity; 2, 33 to 67% of the cancer cells exhibiting immunoreactivity; 3 >67% of the cancer cells exhibiting immunoreactivity. The intensity of the immunohistochemical signal was also stratified into four groups: 0, no immunoreactivity; 1, weak immunoreactivity; 2, moderate immunoreactivity; 3, strong immunoreactivity. Finally, the sum of the results of the cell score and the intensity score was calculated. Statistical analysis was performed with SigmaStat software. The rank sum test was used, and P < 0.05 was taken as the level of significance.
Results
Northern blot analysis of total RNA isolated from 12 normal pancreatic tissues and 16 pancreatic cancers revealed the presence of the 1.2-kb Id-1 transcript and the 1.6-kb Id2 mRNA transcript in 11 of the 12 normal pancreatic samples, and the 1.3-kb Id-3 mRNA transcript in all normal pancreatic samples (Figure 1A, 2) ▶ ▶ . In the cancer tissues, Id-1 mRNA levels were elevated in 8 of 16 samples, Id-2 mRNA levels were elevated in 9 of these samples, and Id-3 mRNA levels were elevated in 6 of these samples (Figure 1A, 2) ▶ ▶ . Concomitant overexpression of all three Id species was observed in 6 of the cancer samples (38%). In contrast, none of the Id mRNA species were overexpressed in CP by comparison with normal controls (Figure 1B, 2) ▶ ▶ . Densitometric analysis of all of the autoradiograms indicated that there was a 6.5-fold increase (P < 0.01) in Id-1 mRNA levels, a fivefold increase (P < 0.01) in Id-2 mRNA levels, and a twofold increase (P = 0.027) in Id-3 mRNA levels in the pancreatic cancer samples in comparison to normal controls (Figure 2) ▶ . In contrast, there was no statistically significant difference in the expression levels of Id-1, Id-2, and Id-3, in CP tissues in comparison to the corresponding levels in the normal pancreas (Figure 2) ▶ .
Figure 1.
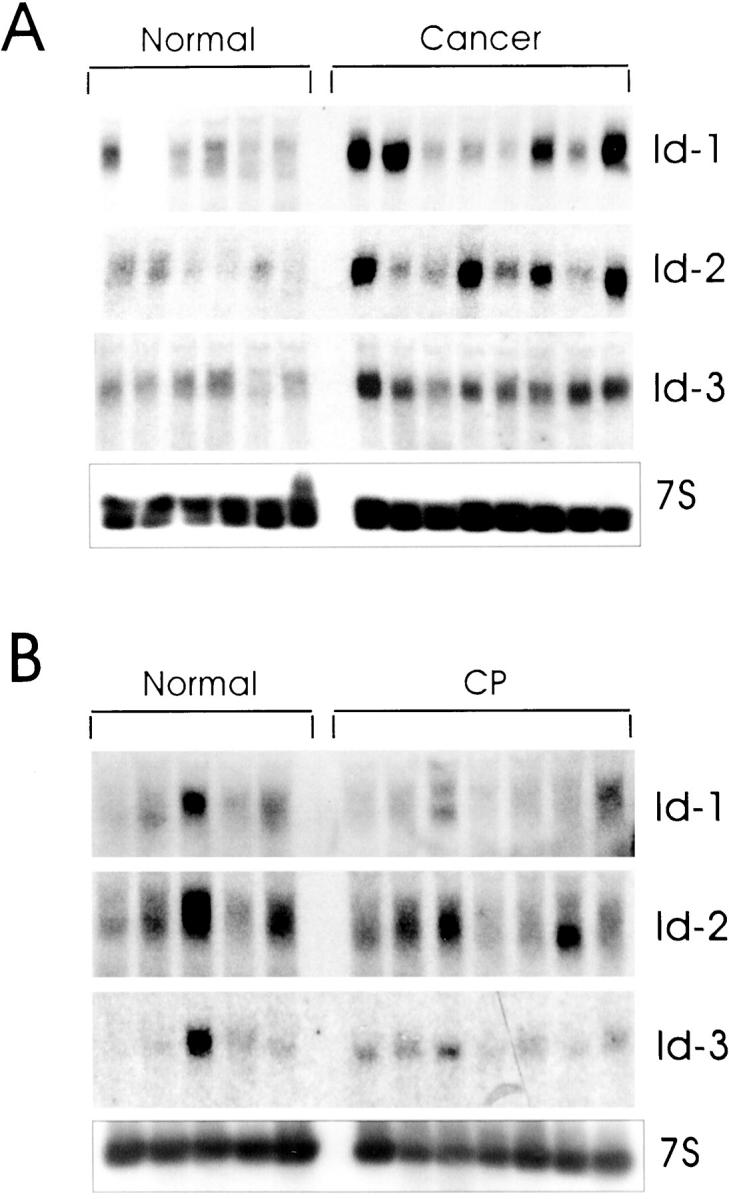
mRNA expression of Id-1, Id-2, and Id-3 in pancreatic cancer and chronic pancreatitis. Total RNA (20 μg/lane) from six normal, eight cancerous, and seven chronic pancreatitis tissue samples were subjected to Northern blot analysis using 32P-labeled cDNA probes (500,000 cpm/ml) specific for Id-1, Id-2, and Id-3, respectively. A 7S cDNA probe (50,000 cpm/ml) was used as a loading and transfer control. Exposure times of the normal/cancer blots were 1 day for all Id probes, and 2 days for the normal/CP blots. Exposure time was 4 hours for mouse 7S cDNA. By comparison with the normal samples, Id-1 and Id-3 mRNA levels were elevated in 8 and 9 cancer samples, respectively, whereas Id-2 was elevated in 6 cancer samples.
Figure 2.
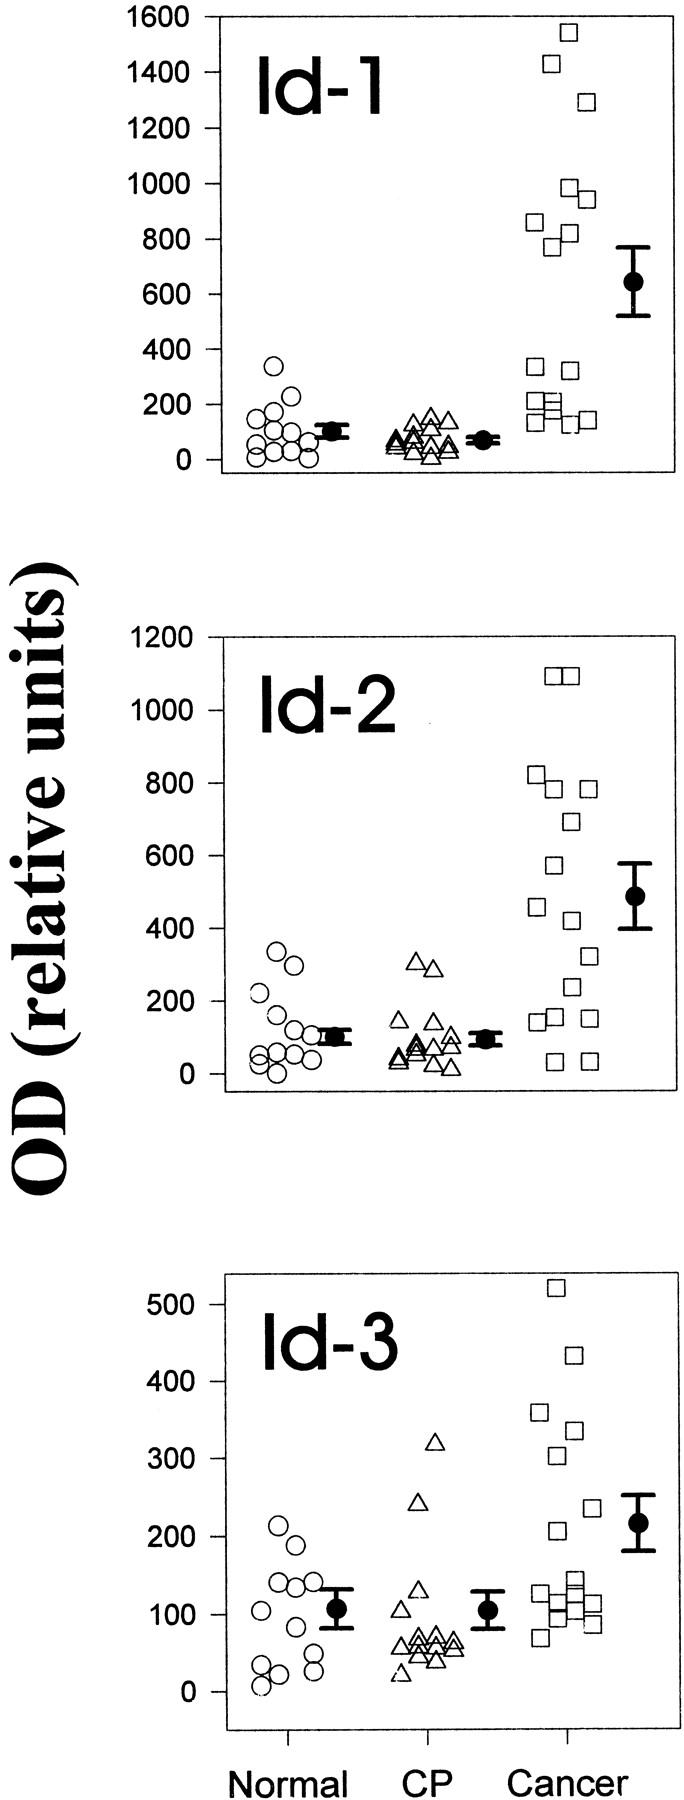
Densitometric analysis of Northern blots. Autoradiographs of Northern blots from 12 normal, 14 CP, and 16 pancreatic cancers were analyzed by densitometry. mRNA levels were determined by calculating the ratio of the optical density for the respective Id mRNA species in relation to the optical density of mouse 7S cDNA. To compare the relative increase in expression of the respective Id mRNA species in the cancer and CP samples, the same normal samples were used for normal/cancer and normal/CP membranes. Normal pancreatic tissues are indicated by circles, CP tissues by triangles, and cancer tissues by squares. Data are expressed as median scores ± SD. By comparison with the normal samples, only the cancer samples exhibited significant increases: 6.5-fold (P < 0.01) for Id-1, fivefold (P < 0.01) for Id-2, and twofold (P = 0.027) for Id-3.
Next, we assessed the expression of the three Id genes in 5 human pancreatic cancer cell lines by Northern and Western blot analyses. Id-1 mRNA was present at varying levels in all 5 cell lines (Figure 3) ▶ . ASPC-1, CAPAN-1, MIA-PaCa-2, and PANC-1 expressed moderate to high levels of Id-1 mRNA, whereas COLO-357 cells expressed relatively low levels of this mRNA moiety. Western blotting with a highly specific anti-Id-1 antibody confirmed the presence of the approximately 14-kd Id-1 protein in the 4 cell lines that expressed high levels of Id-1 mRNA (Figure 3) ▶ . Furthermore, the three cell lines with the highest Id-1 mRNA expression (CAPAN-1, MIA-PaCa-2, and PANC-1) also exhibited the highest Id-1 protein expression. Variable levels of the 1.6-kb Id-2 mRNA transcript were present in all 5 cell lines. In addition, a minor band of approximately 1.2 kb was visible in COLO-357 and MIA-PaCa-2 cells. Immunoblot analysis with a highly specific anti-Id-2 antibody revealed two bands of approximately 16 and 18 kd at relatively high levels in all of the cell lines with exception of PANC-1 cells, in which the 16-kd band was relatively faint (Figure 3) ▶ . With the exception of MIA-PaCa-2 cells, there was a good correlation between Id-2 mRNA and protein levels (Figure 3) ▶ . Id-3 mRNA was present at high levels in MIA-PaCa-2 cells, at moderate levels in COLO-357 cells, and at low levels in PANC-1 cells. Id-3 mRNA was not detectable in ASPC-1 and CAPAN-1 cells (Figure 3) ▶ . Immunoblot analysis with a highly specific anti-Id-3 antibody revealed an approximately 14-kd band that was most abundant in MIA-PaCa-2 cells, and was also readily apparent in COLO-357 and PANC-1 cells. In contrast, only a faint Id-3 band was seen in ASPC-1 and CAPAN-1 cells. Thus, with the exception of PANC-1 cells, there was a good correlation between Id-3 mRNA and protein levels.
Figure 3.
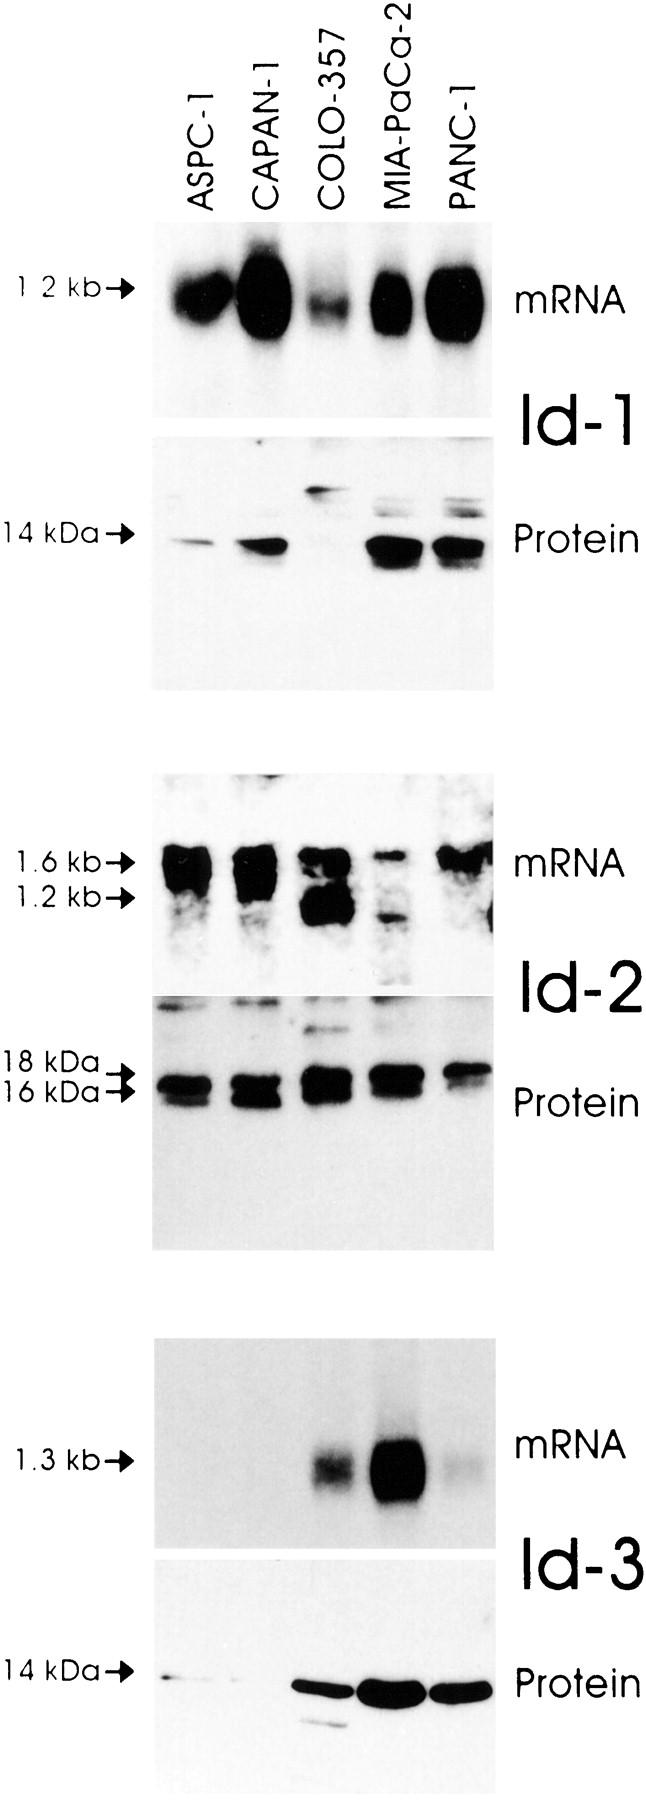
Id mRNA and protein expression in pancreatic cancer cell lines. Upper panels: Total RNA (20 μg/lane) from 5 pancreatic cancer cell lines were subjected to Northern blot analysis using 32P-labeled cDNA probes (500,000 cpm/ml) specific for Id-1, Id-2, and Id-3, respectively. Exposure times were 1 day for all Id probes. Lower panels: Immunoblotting. Cell lysates (30 μg/lane) were subjected to SDS-PAGE. Membranes were probed with specific Id-1, Id-2, and Id-3 antibodies. Visualization was performed by enhanced chemiluminescence.
To determine the localization of Id-1, Id-2, and Id-3, immunostaining was carried out using the same highly specific anti-Id antibodies. In the pancreatic cancers, moderate to strong Id-1 immunoreactivity was present in the cancer cells in 9 of 10 randomly selected cancer samples. An example of moderate Id-1 immunoreactivity is shown in Figure 4A ▶ , and of strong immunoreactivity in Figure 4C ▶ (left panel). In contrast, in the normal pancreas, faint Id-1 immunoreactivity was present only in the ductal cells of pancreatic ducts (Figure 4B ▶ , arrowheads). Preabsorption with the Id-1-specific blocking peptide completely abolished the Id-1 immunoreactivity (Figure 4C ▶ , right panel). The cancer cells also exhibited strong Id-2 (Figure 4, D and F ▶ , left panel) and moderate to strong Id-3 immunoreactivity. An example of moderate Id-3 immunoreactivity is shown in Figure 4G ▶ , and of strong immunoreactivity in Figure 4I ▶ (left panel). In contrast, only faint Id-2 immunoreactivity was present in the ductal cells in the normal pancreas (Figure 4E) ▶ , whereas Id-3 immunoreactivity in these cells was more variable and ranged from moderate to occasionally strong (Figure 4H) ▶ . Islet cells and acinar cells were always devoid of Id immunoreactivity. Preabsorption of the respective antibody with the blocking peptides specific for Id-2 (Figure 4F ▶ , right panel) and Id-3 (Figure 4I ▶ , right panel) completely abolished immunoreactivity. Analysis of serial pancreatic cancer sections revealed that there was often colocalization of the three Id proteins. An example of serial sections from a pancreatic cancer tissue is shown in Figure 4, A, D, and G ▶ .
Figure 4.
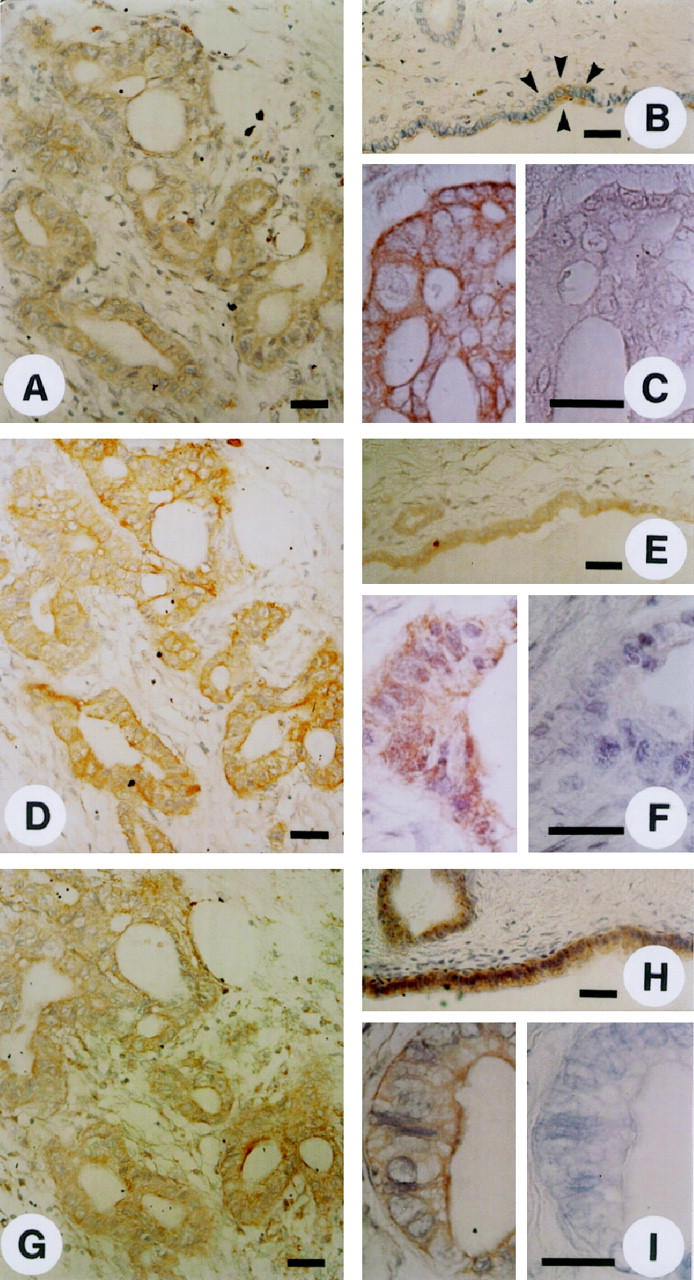
Normal and cancerous pancreatic tissues were subjected to immunostaining using highly specific anti-Id-1 (A-C), anti-Id-2 (D-F), and anti-Id-3 (G-I) antibodies as described in the Methods section. Moderate to strong Id-1 immunoreactivity was present in the cytoplasm of duct-like cancer cells (A and C, left panel). In the normal pancreas there was weak Id-1 immunoreactivity in the ductal cells (B). Preabsorption with the Id-1-specific blocking peptide abolished the Id-1 immunoreactivity (C, right panel). Strong Id-2 immunoreactivity was observed in the cytoplasm of the cancer cells that exhibited duct-like structures (D and F, left panel), whereas in the normal pancreas, there was only weak Id-2 immunoreactivity in the ductal cells (E). Preabsorption with the Id-2-specific blocking peptide abolished the Id-2 immunoreactivity (F, right panel). Moderate to strong Id-3 immunoreactivity was present in the duct-like cancer cells (G and I, left panel). Moderate to strong Id-3 immunoreactivity was also present in the ductal cells of normal pancreatic tissue samples (H). Id-3 immunoreactivity was completely abolished by preabsorption with the Id-3 specific blocking peptide (I, right panel) . A, D, and G constitute serial sections of a pancreatic cancer sample, revealing coexpression of the three Id proteins. Scale bars, 25 μm.
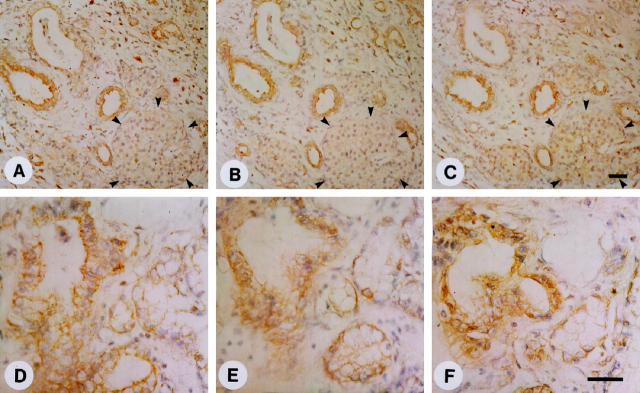
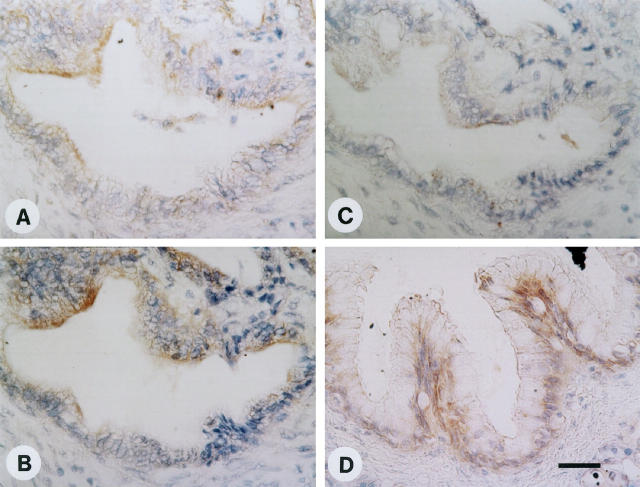
Id-1, Id-2, and Id-3 immunoreactivity was also present at moderate levels in the cytoplasm of ductal cells within CP-like areas adjacent to the cancer cells (Figure 5, A–C) ▶ . As in the normal pancreas, islet cells (outlined by arrowheads) did not exhibit Id immunoreactivity. In 4 of 9 CP samples, there were foci of ductal cell dysplasia of relatively large interlobular ducts, all of which exhibited moderate to strong Id-1, Id-2, and Id-3 immunoreactivity (Figure 5, D–F) ▶ . Five of 9 CP samples also contained foci of large ducts exhibiting atypical papillary epithelium. Serial section analysis of one of those CP samples revealed mild to moderate Id-1 and Id-2 immunoreactivity and weak Id-3 immunoreactivity in the cells of these atypical papillary ducts (Figure 6, A–C) ▶ . In contrast, in some of these CP samples, moderate to strong Id-3 immunoreactivity was also observed (Figure 6D) ▶ . However, most of the ductal cells forming the typical ductular structures of CP, such as large interlobular ducts and small proliferating ducts, exhibited generally only weak to occasionally moderate Id immunoreactivity (data not shown).
Figure 5.
Immunohistochemistry of pancreatic cancer and dysplastic ducts in CP tissues. In the pancreatic cancer tissues (A-C) there was moderate to strong Id-1 (A), Id-2 (B), and Id-3 (C) immunoreactivity in the ductal cells in the areas adjacent to the cancer cells that exhibited CP-like alterations. Islet cells did not exhibit Id immunoreactivity (outlined by solid arrowheads). In the CP samples, moderate to strong Id-1 (D), Id-2 (E), and Id-3 (F) immunoreactivity was present in the cytoplasm of epithelial cells forming large dysplastic ducts. Scale bar, 25 μm.
Figure 6.
Immunohistochemistry of atypical papillary epithelium in CP tissues. Serial section analysis of some CP samples revealed the presence of large duct-like structures with atypical papillary epithelium. Mild to moderate Id-1 (A) and Id-2 (B) immunoreactivity and weak Id-3 (C) immunoreactivity was present in the cytoplasm of the cells forming these large ducts with papillary structures. Some CP samples also exhibited moderate Id-3 immunoreactivity in these cells (D). Scale bar, 25 μm.
The immunohistochemical data for Id-1, Id-2, and Id-3 are summarized in Table 1 ▶ . In the case of Id-1 and Id-2, the cancer cells as well as the dysplastic and atypical papillary ducts in CP exhibited a significantly higher score than the ductal cells in the normal pancreas. In contrast, due to the marked variability in Id-3 immunostaining in the normal pancreas, the differences between normal and cancer cells and normal and dysplastic cells did not achieve statistical significance.
Table 1.
Histological Scoring
| Id-1 | Id-2 | Id-3 | ||
|---|---|---|---|---|
| Normal (n = 6) | Ductal cells | 2.0 ± 0.4 | 2.3 ± 0.2 | 2.5 ± 0.9 |
| Cancer (n = 10) | Cancer cells | 4.5* ± 0.5 | 5.2§ ± 0.3 | 4.5 ± 0.6 |
| CP (n = 9) | Typical CP lesions (n = 9) | 2.7 ± 0.5 | 3.1 ± 0.6 | 3.4 ± 0.7 |
| Dysplastic ducts (n = 4) | 5.3† ± 0.2 | 5.8‡ ± 0.2 | 5.3 ± 0.4 | |
| Atypical papillary ducts (n = 5) | 4.4‡ ± 0.2 | 5.2‡ ± 0.2 | 5.0 ± 0.4 |
Scoring of the histological specimens was performed as described in the Patients and Methods section. Values are the means ± SD of the number of samples indicated in parenthesis. P values are based on comparisons with the respective controls in the normal samples.
*, P < 0.02; †P < 0.01; ‡P = 0.004; §P = 0.001.
Discussion
Id proteins constitute a family of HLH transcription factors that are important regulators of cellular differentiation and proliferation. 1,2 To date, four members of the human Id family have been identified. 1,10-12 Their expression is enhanced during cellular proliferation and in response to mitogenic stimuli, 19,31 and overexpression of Id genes inhibits differentiation and/or enhances proliferation in several different cell types. 15,32-34 The forced expression of Id-1 in mouse small intestinal epithelium results in adenoma formation in these animals. 35 The growth-promoting effects of Id genes are thought to occur through several mechanisms. For example, Id-2 can bind to members of the pRB tumor suppressor family, thus blocking their growth-suppressing activity, 20,21 and Id-1 and Id-2 can antagonize the bHLH-mediated activation of known inhibitors of cell cycle progression such as the cyclin-dependent kinase inhibitor p21. 23
In the present study, we determined by Northern blot analysis that a significant percentage of human pancreatic cancers expressed increased Id-1, Id-2, and Id-3 mRNA levels. Increased expression was most evident for Id-1 (6.5-fold) and Id-2 (fivefold). In contrast, Id-3 mRNA levels were only twofold increased in the cancer samples, partly because this mRNA was present at relatively high levels in the normal pancreas. Immunhistochemical analysis confirmed the presence of Id-1, Id-2, and Id-3 in the cancer cells within the tumor mass, whereas in the normal pancreas faint Id-1 and Id-2 immunoreactivity and moderate to occasionally strong Id-3 immunoreactivity was present in some ductal cells. Pancreatic acinar and islet cells in the normal pancreas were devoid of Id-1, Id-2, and Id-3 immunoreactivity. In the cancer samples, all three Id proteins often colocalized in the cancer cells. Coexpression of all three Id genes was also observed in cultured pancreatic cancer cell lines, which often exhibited a close correlation between Id mRNA and protein expression. However, in MIA-PaCa-2 there was a divergence of Id-2 mRNA and protein levels, and in PANC-1 cells, Id-3 mRNA levels did not correlate well with Id-3 protein expression. These observations suggest that in these cells, the half-life of either Id mRNA or Id protein may be altered by comparison with the other cell lines. Interestingly, Id-2 immunoblotting revealed two closely spaced bands of approximately 16 and 18 kd in 4 of 5 cell lines. In view of the fact that two possible initiation codons have been reported for the Id-2 gene, 36 our observation raises the possibility that the two Id-2-immunoreactive bands may represent separate translation products of the Id-2 gene.
Pancreatic cancers often harbor p53 tumor suppressor gene mutations 37 and exhibit alterations in apoptosis pathways. Thus, these cancers often exhibit increased expression of anti-apoptotic proteins such as Bcl-2 38 and abnormal resistance to Fas-ligand-mediated apoptosis. 39 It has been shown recently that forced constitutive expression of Id genes together with the expression of anti-apoptotic genes such as Bcl-2 or BclXL can result in malignant transformation of human fibroblasts, 11 raising the possibility that the enhanced Id expression in pancreatic cancers together with increased expression of anti-apoptotic genes may contribute to the malignant potential of pancreatic cancer cells in vivo.
In the CP tissues there was no significant increase in Id-1, Id-2, and Id-3 mRNA levels in comparison to the normal pancreas. Immunohistochemical analysis of pancreatic cancer samples revealed colocalization of weak to moderate Id-1, Id-2, and Id-3 immunoreactivity in proliferating ductal cells in the CP-like regions adjacent to the cancer cells, indicating that Id expression was not restricted to the cancer cells. Similarly, analysis of CP samples indicated weak Id-1, Id-2, and Id-3 immunoreactivity in the cells of small proliferating ducts and large ducts without dysplastic changes. In general, there was a correlation between weak immunoreactivity and low Id mRNA levels. However, in samples that harbored large ducts with papillary structures there was moderate Id immunoreactivity, and in the cells forming dysplastic ducts there was moderate to strong Id immunoreactivity. In these CP samples, Id mRNA levels were relatively higher than in the CP samples that were devoid of these histological changes. Overall, however, increased Id expression, most notably of Id-1 and Id-2, distinguished a subgroup of pancreatic cancers from CP (Table 1) ▶ .
Epidemiological studies have shown that the risk of developing pancreatic cancer is increased up to 16-fold in patients with pre-existing CP in comparison to the general population. 40 The mechanisms that contribute to neoplastic transformation in CP are not known. Although there is no established tumor progression model for pancreatic cancer, such as the adenoma-carcinoma sequence of colorectal carcinoma, 41 it is generally accepted that K-ras and p16 mutations occur relatively early in pancreatic carcinogenesis, whereas p53 mutations occur late in this process. 37,41-43 Increased Id expression may contribute to malignant transformation of cultured cell lines in vitro 11 and has been linked to cell invasion in a murine mammary epithelial cell line. 44 In view of the current findings that Id-1, Id-2, and Id-3 are overexpressed in pancreatic cancer and in dysplastic/metaplastic ducts in CP, these observations raise the possibility that elevated levels of Id-1, Id-2, and, to a lesser extent, Id-3 may represent relatively early markers of pancreatic malignant transformation and may contribute to the pathobiology of pancreatic cancer.
Footnotes
Address reprint requests to Dr. Murray Korc, Division of Endocrinology, Diabetes and Metabolism, Medical Sciences I, C240, University of California, Irvine, CA 92697. E-mail: mkorc@uci.edu.
Contract grant sponsor: National Cancer Institute. Contract grant number: U. S. Public Health Service grant CA-40162.
References
- 1.Jan YN, Jan LY: HLH proteins, fly neurogenesis, and vertebrate myogenesis. Cell 1993, 75:827-830 [DOI] [PubMed] [Google Scholar]
- 2.Olson EN, Klein WH: bHLH factors in muscle development: dead lines and commitments, what to leave in and what to leave out. Genes Dev 1994, 8:1-8 [DOI] [PubMed] [Google Scholar]
- 3.Begley CG, Aplan PD, Denning SM, Haynes BF, Waldmann TA, Kirsch IR: The gene SCL is expressed during early hematopoiesis and encodes a differentiation-related DNA-binding motif. Proc Natl Acad Sci USA 1989, 86:10128-10132 [DOI] [PMC free article] [PubMed] [Google Scholar]
- 4.Johnson JE, Birren SJ, Anderson DJ: Two rat homologues of Drosophila achaete-scute specifically expressed in neuronal precursors. Nature 1990, 346:858-861 [DOI] [PubMed] [Google Scholar]
- 5.Weintraub H: The MyoD family and myogenesis: redundancy, networks, and thresholds. Cell 1993, 75:1241-1244 [DOI] [PubMed] [Google Scholar]
- 6.Hu JS, Olson EN, Kingston RE: HEB, a helix-loop-helix protein related to E2A, and ITF2 that can modulate the DNA-binding ability of myogenic regulatory factors. Mol Cell Biol 1992, 12:1031-1042 [DOI] [PMC free article] [PubMed] [Google Scholar]
- 7.Langlands K, Yin X, Anand G, Prochownik EV: Differential interactions of Id proteins with basic-helix-loop-helix transcription factors. J Biol Chem 1997, 272:19785-19793 [DOI] [PubMed] [Google Scholar]
- 8.Murre C, Bain G, van Dijk MA, Engel I, Furnari BA, Massari ME, Matthews JR, Quong MW, Rivera RR, Stuiver MH: Structure and function of helix-loop-helix proteins. Biochim Biophys Acta 1994, 1218:129-135 [DOI] [PubMed] [Google Scholar]
- 9.Murre C, McCaw PS, Vaessin H, Caudy M, Jan LY, Jan YN, Cabrera CV, Buskin JN, Hauschka SD, Lassar AB, Baltimore D: Interactions between heterologous helix-loop-helix proteins generate complexes that bind specifically to a common DNA sequence. Cell 1989, 58:537-544 [DOI] [PubMed] [Google Scholar]
- 10.Benezra R, Davis RL, Lockshon D, Turner DL, Weintraub H: The protein Id: a negative regulator of helix-loop-helix DNA binding proteins. Cell 1990, 61:49-59 [DOI] [PubMed] [Google Scholar]
- 11.Norton JD, Atherton GT: Coupling of cell growth control and apoptosis functions of Id proteins. Mol Cell Biol 1998, 18:2371-2381 [DOI] [PMC free article] [PubMed] [Google Scholar]
- 12.Norton JD, Deed RW, Craggs G, Sablitzky F: Id helix-loop-helix proteins in cell growth and differentiation. Trends Cell Biol 1998, 8:58-65 [PubMed] [Google Scholar]
- 13.Christy BA, Sanders LK, Lau LF, Copeland NG, Jenkins NA, Nathans D: An Id-related helix-loop-helix protein encoded by a growth factor-inducible gene. Proc Natl Acad Sci USA 1991, 88:1815-1819 [DOI] [PMC free article] [PubMed] [Google Scholar]
- 14.Kawaguchi N, DeLuca HF, Noda M: Id gene expression and its suppression by 1,25-dihydroxyvitamin D3 in rat osteoblastic osteosarcoma cells. Proc Natl Acad Sci USA 1992, 89:4569-4572 [DOI] [PMC free article] [PubMed] [Google Scholar]
- 15.Kreider BL, Benezra R, Rovera G, Kadesch T: Inhibition of myeloid differentiation by the helix-loop-helix protein Id. Science 1992, 255:1700-1702 [DOI] [PubMed] [Google Scholar]
- 16.Le Jossic C, Ilyin GP, Loyer P, Glaise D, Cariou S, Guguen-Guillouzo C: Expression of helix-loop-helix factor Id-1 is dependent on the hepatocyte proliferation and differentiation status in rat liver and in primary culture. Cancer Res 1994, 54:6065-6068 [PubMed] [Google Scholar]
- 17.Sun XH, Copeland NG, Jenkins NA, Baltimore D: Id proteins Id1 and Id2 selectively inhibit DNA binding by one class of helix-loop-helix proteins. Mol Cell Biol 1991, 11:5603-5611 [DOI] [PMC free article] [PubMed] [Google Scholar]
- 18.Wilson RB, Kiledjian M, Shen CP, Benezra R, Zwollo P, Dymecki SM, Desiderio SV, Kadesch T: Repression of immunoglobulin enhancers by the helix-loop-helix protein Id: implications for B-lymphoid-cell development. Mol Cell Biol 1991, 11:6185-6191 [DOI] [PMC free article] [PubMed] [Google Scholar]
- 19.Hara E, Yamaguchi T, Nojima H, Ide T, Campisi J, Okayama H, Oda K: Id-related genes encoding helix-loop-helix proteins are required for G1 progression and are repressed in senescent human fibroblasts. J Biol Chem 1994, 269:2139-2145 [PubMed] [Google Scholar]
- 20.Iavarone A, Garg P, Lasorella A, Hsu J, Israel MA: The helix-loop-helix protein Id-2 enhances cell proliferation and binds to the retinoblastoma protein. Genes Dev 1994, 8:1270-1284 [DOI] [PubMed] [Google Scholar]
- 21.Lasorella A, Iavarone A, Israel MA: Id2 specifically alters regulation of the cell cycle by tumor suppressor proteins. Mol Cell Biol 1996, 16:2570-2578 [DOI] [PMC free article] [PubMed] [Google Scholar]
- 22.Peverali FA, Ramqvist T, Saffrich R, Pepperkok R, Barone MV, Philipson L: Regulation of G1 progression by E2A and Id helix-loop-helix proteins. EMBO J 1994, 13:4291-4301 [DOI] [PMC free article] [PubMed] [Google Scholar]
- 23.Prabhu S, Ignatova A, Park ST, Sun XH: Regulation of the expression of cyclin-dependent kinase inhibitor p21 by E2A and Id proteins. Mol Cell Biol 1997, 17:5888-5896 [DOI] [PMC free article] [PubMed] [Google Scholar]
- 24.Warshaw AL, Fernandez-del Castillo C: Pancreatic carcinoma. N Engl J Med 1992, 326:455-465 [DOI] [PubMed] [Google Scholar]
- 25.Korc M: Role of growth factors in pancreatic cancer. Surg Oncol Clin North Am 1998, 7:25-41 [PubMed] [Google Scholar]
- 26.Kleeff J, Ishiwata T, Friess H, Büchler MW, Israel MA, Korc M: The helix-loop-helix protein Id2 is overexpressed in human pancreatic cancer. Cancer Res 1998, 58:3769-3772 [PubMed] [Google Scholar]
- 27.Oertel JE, Heffes CS, Oertel YC: Pancreas. Sternberg SS eds. Diagnostic Surgical Pathology. 1989, :pp 1057-1093 Raven Press, New York [Google Scholar]
- 28.Korc M, Chandrasekar B, Yamanaka Y, Friess H, Büchler MW, Beger HG: Overexpression of the epidermal growth factor receptor in human pancreatic cancer is associated with concomitant increase in the levels of epidermal growth factor and transforming growth factor α. J Clin Invest 1992, 90:1352-1360 [DOI] [PMC free article] [PubMed] [Google Scholar]
- 29.Saeki T, Stromberg K, Qi CF, Gullick WJ, Tahara E, Normanno N, Ciardiello F, Kenney N, Johmson GR, Salomon DS: Differential immunohistochemical detection of amphiregulin and cripto in human normal colon and colorectal tumors. Cancer Res 1992, 52:3467-3473 [PubMed] [Google Scholar]
- 30.Cantero D, Friess H, Deflorin J, Zimmermann A, Bründler MA, Riesle E, Korc M, Büchler MW: Enhanced expression of urokinase plasminogen activator and its receptor in pancreatic carcinoma. Br J Cancer 1997, 75:388-395 [DOI] [PMC free article] [PubMed] [Google Scholar]
- 31.Desprez PY, Hara E, Bissell MJ, Campisi J: Suppression of mammary epithelial cell differentiation by the helix-loop-helix protein Id-1. Mol Cell Biol 1995, 15:3398-3404 [DOI] [PMC free article] [PubMed] [Google Scholar]
- 32.Shoji W, Yamamoto T, Obinata M: The helix-loop-helix protein Id inhibits differentiation of murine erythroleukemia cells. J Biol Chem 1994, 269:5078-5084 [PubMed] [Google Scholar]
- 33.Cross JC, Flannery ML, Blanar MA, Steingrimsson E, Jenkins NA, Copeland NG, Rutter WJ, Werb Z: Hxt encodes a basic helix-loop-helix transcription factor that regulates trophoblast cell development. Development 1995, 121:2513-2523 [DOI] [PubMed] [Google Scholar]
- 34.Sun XH: Constitutive expression of the Id1 gene impairs mouse B cell development. Cell 1994, 79:893-900 [DOI] [PubMed] [Google Scholar]
- 35.Wice BM, Gordon JI: Forced expression of Id-1 in the adult mouse small intestinal epithelium is associated with development of adenomas. J Biol Chem 1998, 273:25310-25319 [DOI] [PubMed] [Google Scholar]
- 36.Barone MV, Pepperkok R, Peverali FA, Philipson L: Id proteins control growth induction in mammalian cells. Proc Natl Acad Sci USA 1994, 91:4985-4988 [DOI] [PMC free article] [PubMed] [Google Scholar]
- 37.Barton CM, Staddon SL, Hughes CM, Hall PA, O’Sullivan C, Kloppel G, Theis B, Russell RC, Neoptolmos J, Williamson RCN, Lane DP, Lemoine NR: Abnormalities of the p53 tumour suppressor gene in human pancreatic cancer. Br J Cancer 1991, 64:1076-1082 [DOI] [PMC free article] [PubMed] [Google Scholar]
- 38.Ohshio G, Suwa H, Imamura T, Yamaki K, Tanaka T, Hashimoto Y, Imamura M: An immunohistochemical study of bcl-2 and p53 protein expression in pancreatic carcinomas. Scand J Gastroenterol 1998, 33:535-539 [DOI] [PubMed] [Google Scholar]
- 39.Ungefroren H, Voss M, Jansen M, Roeder C, Henne-Bruns D, Kremer B, Kalthoff H: Human pancreatic adenocarcinomas express Fas and Fas ligand yet are resistant to Fas-mediated apoptosis. Cancer Res 1998, 58:1741-1749 [PubMed] [Google Scholar]
- 40.Niederau C, Niederau MC, Heintges T, Lüthen R: Epidemiology: relation between chronic pancreaitis and pancreatic carcinoma. Beger HG Büchler MW Schoenberg MH eds. Cancer of the Pancreas. 1996, :pp 6-9 Universitätsverlag Ulm GmbH, Ulm, Germany [Google Scholar]
- 41.Moskaluk CA, Kern SE: Molecular genetics of pancreatic carcinoma. Reber HA eds. Pancreatic Cancer: Pathogenesis, Diagnosis, and Treatment. 1998, :pp 3-20 Humana Press, Totowa, NJ [Google Scholar]
- 42.Moskaluk CA, Hruban RH, Kern SE: p16 and K-ras gene mutations in the intraductal precursors of human pancreatic adenocarcinoma. Cancer Res 1997, 57:2140-2143 [PubMed] [Google Scholar]
- 43.Tada M, Ohashi M, Shiratori Y, Okudaira T, Komatsu Y, Kawabe T, Yoshida H, Machinami R, Kishi K, Omata M: Analysis of K-ras gene mutation in hyperplastic duct cells of the pancreas without pancreatic disease. Gastroenterology 1996, 110:227-231 [DOI] [PubMed] [Google Scholar]
- 44.Desprez PY, Lin CQ, Thomasset N, Sympson CJ, Bissell MJ, Campisi J: A novel pathway for mammary epithelial cell invasion induced by the helix-loop-helix protein Id-1. Mol Cell Biol 1998, 18:4577-4588 [DOI] [PMC free article] [PubMed] [Google Scholar]


