

Abstract
The molecular pathogenesis as well as histogenesis of endocrine pancreatic tumors (EPTs) is not well understood, and the clinical behavior of EPTs is difficult to predict using current morphological criteria. Thus, more accurate markers of risk and better understanding of tumor initiation and progression are needed to allow a precise classification of EPTs. We have studied 44 benign and malignant EPTs by comparative genomic hybridization to correlate the overall number of genetic alterations with clinical and histopathological parameters and to identify chromosomal regions which might harbor genes involved in EPT pathogenesis and progression. Aberrations were found in 36 EPTs, and chromosomal losses (mean, 5.3) were slightly more frequent than gains (mean, 4.6). The most frequent losses involved Y (45% of male EPTs), 6q (39%), 11q (36%), 3p, 3q, 11p (each 30%), 6p (27%), and 10q and Xq (each 25%), whereas most common gains included 7q (43%), 17q (41%), 5q and 14q (each 32%), 7p, 9q, 17p, 20q (each 27%), and 12q and Xp (each 25%). A correlation was found between the total number of genetic changes per tumor and both tumor size and disease stage. In particular, losses of 3p and 6 and gains of 14q and Xq were found to be associated with metastatic disease. Furthermore, characteristic patterns of genetic changes were found in the various EPT subtypes, eg, 6q loss in malignant insulinomas, indicating that these groups might evolve along genetically different pathways. The highlighted genetic aberrations, including the newly found involvement of 6q losses and sex chromosome alterations, should stimulate the further analysis of these chromosomal regions, which may lead to the discovery of novel genes important in the tumorigenesis and evolution of EPTs.
Endocrine pancreatic tumors (EPTs) are neoplasms with a prevalence of approximately 1/100,000. Sixty to 85% of EPTs belong to the group of functioning tumors, in that they are producing hormones such as insulin, gastrin, glucagon, or vasoactive intestinal polypeptide (VIP), which may lead to clinically distinct syndromes. The remaining tumors are nonfunctioning, in that they express no hormones that lead to a clinical syndrome. 1 Because the histopathological characteristics of EPTs do not provide useful information with respect to prognosis, more distinctive markers that can predict the clinical course of EPTs are urgently required. However, the molecular mechanisms underlying the tumorigenesis of EPTs are poorly understood. A small percentage of EPTs is associated with inherited syndromes such as the multiple endocrine neoplasia type 1 (MEN1) and von Hippel-Lindau (VHL) syndrome. 2,3 The vast majority of EPTs, however, occur sporadically, and only a subset harbor somatic MEN1 mutations. 4,5 VHL mutations and alterations of the K-ras, N-ras, and TP53 genes appear not to be relevant in the pathogenesis of EPTs. 6-9 Furthermore, contradictory data exist with respect to the involvement of other putative chromosomal regions in EPT tumorigenesis, such as 9p21 (p16 gene) and 17q12-q21 (c-erbB-2 gene). 8-11 To identify chromosomal alterations which may be important for EPT initiation and progression, we have applied comparative genomic hybridization (CGH), which allows the screening of tumor samples for DNA sequence losses (>10 Mb) and gains along all chromosome arms without need of culturing tumor cells in vitro for chromosome karyotyping. 12 Forty-four sporadic human EPTs were examined for genetic changes in relation to clinical disease stage, tumor size, and hormonal subtype. A subset of these CGH data was confirmed by interphase cytogenetics and molecular allelotyping. Our results show marked genetic differences with respect to these parameters and pinpoint several new loci that are candidates for harboring genes with a role in EPT pathogenesis.
Materials and Methods
Tumor Material and Patient Data
EPTs and 5 metastases of 44 patients (22 male, mean age 53.0 ± 16.0 years, and 22 female, mean age 51.3 ± 15.8 years) were selected from the files of the Departments of Pathology of the Universities of Zürich and Basel, Switzerland. The samples included 28 frozen and 16 formalin-fixed, paraffin-embedded EPTs, which were all sporadic and not associated with the inherited MEN1 or VHL syndromes. The tumors were classified according to the most recent classification 13 and consisted of 9 nonfunctioning (8 malignant, 1 benign) and 35 functioning EPTs, including 17 insulinomas (11 benign, 6 malignant), 7 gastrinomas, 7 VIPomas, and 4 glucagonomas (all malignant). Eighteen of the patients had localized disease, defined by the absence of extrapancreatic spread of the tumor, whereas 22 patients had advanced disease, with tumor spread into the surrounding soft tissue, lymph nodes, or liver. In four patients no data were available concerning the disease stage.
Tumor DNA Isolation
Genomic DNA from frozen tumors was isolated using the D-5000 Puregene DNA Isolation Kit (Gentra Systems, Minneapolis, MN). DNA from paraffin-embedded tumor samples was extracted as previously described using proteinase K digestion and phenol/chloroform extraction. 5,14,15 Only tumors with >70% tumor cell content were included in this study. DNA from normal pancreatic tissue was also isolated for microsatellite loss of heterozygosity (LOH) analysis.
CGH and Digital Image Analysis
CGH was performed as described. 15 Briefly, 1 μg tumor DNA was labeled with Spectrum Green-dUTPs (Vysis, Downers Grove, IL) by nick translation (BioNick kit, Life Technologies, Basel, Switzerland). Spectrum Red-labeled normal reference DNA (Vysis) was used for cohybridization. The hybridization mixture consisted of 200 ng Spectrum Green-labeled tumor DNA, 200 ng Spectrum Red-labeled normal reference DNA, and 10 to 20 μg of human Cot-1 DNA (Life Technologies) dissolved in 10 μl of hybridization buffer (50% formamide, 2× SSC, pH 7.0). Hybridization was carried out for 3 days at 37°C to normal human metaphase spreads (Vysis). Slides were washed at 45°C three times for 10 minutes in 50% formamide/2× SSC followed by two times for 5 minutes in 2× SSC. The chromosomes were counterstained with 4,6-diamidino-2-phenylindole for identification. Digital images were collected from six to seven metaphases using a Photometrics cooled CCD camera (Microimager 1400; Xillix Technologies, Vancouver, BC) attached to a Zeiss Axioskop microscope and a Sun workstation. The software program QUIPS (Vysis) was used to calculate average green-to-red ratio profiles for each chromosome. At least four observations per autosome and two observations per sex chromosome were included in each analysis. In 22 of the 44 tumor cases two CGH analyses per tumor were carried out to confirm the reproducibility of the detected chromosomal abnormalities by CGH. In 8 cases, where no genomic imbalances could be detected by CGH, additional DNA was isolated from another part of the same tumor, leading to essentially the same CGH results.
Controls and Threshold Definition
Positive, negative, and sex-mismatched controls were applied as previously described. 15 Gains and losses of DNA sequences were defined as chromosomal regions where both the mean green-to-red fluorescence ratio and its SD were above 1.20 and below 0.80, respectively. Overrepresentations were considered amplifications when the fluorescence ratio values in a subregion of a chromosomal arm exceeded 1.5. In negative control hybridizations, the mean green-to-red ratio occasionally exceeded the fixed 1.2 cutoff level at the following chromosomal regions: 1p32-pter, 16p, 19, and 22. Gains of these known G-C-rich regions were, therefore, excluded from all analyses.
Statistics
Contingency table analysis was used to analyze the relationship between genomic alterations and disease stage, tumor size, and hormonal subtype. Student’s t-test and analysis of variance were applied to compare the number of genomic alterations between the different EPT hormonal subtypes.
Confirmation of CGH Data
Ten EPTs, five of which showed losses of chromosome 3 DNA by CGH, were analyzed for allelic deletion of chromosome 3p loci using polymorphic microsatellite markers D3S1110 (3p25.1-p25.3), D3S1029 (3p21.2-p21.3) and D3S1076 (3p21.1) (Research Genetics, Huntsville, AL). Touch preparations of these EPTs were subjected to fluorescence in situ hybridization (FISH) using a chromosome 3 centromere probe (p α3.5) in combination with a P1 probe mapping to the 3p25 region (kindly provided by Dr. J. Gray, Resource of Molecular Cytogenetics, University of California, San Francisco, CA). Both methods were performed according to recently described protocols 5,14 and the results were compared with each other and with the CGH data. In addition, paraffin-embedded tissue sections (5 μm) of eight EPTs of male patients showing gains of chromosome X (4/8), gain of chromosome Y (1/8), and loss of chromosome Y (5/8) by CGH, were used for independent in situ hybridization analysis with chromosome X (pBAMX5) and Y (DYZ3) centromere probes, as previously described. 16
Results
CGH Findings in Association with Disease Stage and Tumor Size
Figure 1A ▶ summarizes all DNA sequence copy number changes detected by CGH in the 44 EPTs, and representative CGH data are shown in Figure 2A ▶ . Genetic aberrations were found in 36 of 44 EPTs (82%), and the overall number of chromosome arm aberrations per tumor ranged from 0 to 36 (mean, 9.9). Chromosomal losses (range, 0–17; mean, 5.3) were slightly more frequent than gains (range 0–19; mean, 4.6), and no evident amplifications could be detected in the EPTs (Table 1) ▶ .
Figure 1.

Summary of all DNA copy number changes detected by CGH in all 44 EPTs (A), 9 nonfunctioning EPTs (B), and 35 functioning EPTs (C). The vertical lines on the right of the chromosome ideograms indicate gains of the corresponding chromosomal regions; those on the left indicate losses. Gains on 1p, 16p, 19, and 22 were not analyzed.
Figure 2.
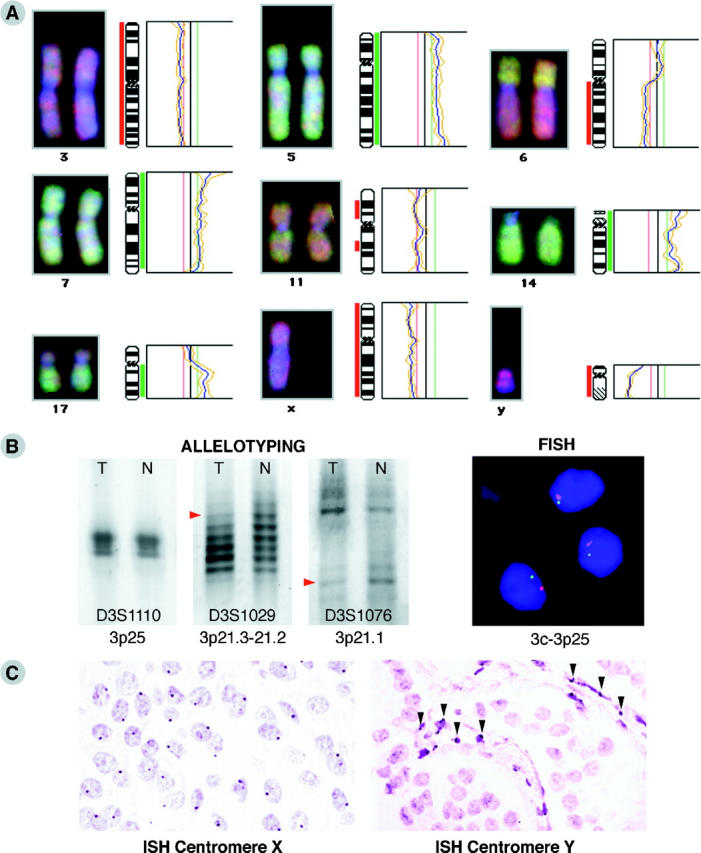
A: Representative CGH results in EPTs. Individual examples of fluorescent ratio profiles (right) and digital images (left) of chromosomes with recurrent gains and losses. The red vertical bar on the left side of a chromosome ideogram (middle) indicates the region of loss and the green vertical bar on the right side of an ideogram indicates the region of gain. B: Example of microsatellite and FISH LOH analysis of a nonfunctioning EPT shows allelic loss for 2 of 3 markers (D3S1029 and D3S1076, red arrowheads; D3S1110 is not informative) on chromosome arm 3p (left) and monosomy for both the centromere 3 (red spots) and 3p25-specific probe (green spots) in DAPI-stained tumor nuclei (right). C: Example of in situ hybridization analysis on paraffin sections of a male VIPoma sample, showing the expected one copy of the X centromere per nucleus in the major cell population (left) and a loss of the chromosome Y centromere sequence in the tumor cells, whereas the stroma cells in between (arrowheads) are still positive for this DNA sequence (right).
Table 1.
Genomic Changes per Case in Sporadic EPTs
| Tumor | n | Aberrations per tumor | |||||
|---|---|---|---|---|---|---|---|
| All changes | P value* | Gains | P value | Losses | P value | ||
| All EPTs | 44 | 9.9 ± 9.9 | 4.6 ± 4.9 | 5.3 ± 5.3 | |||
| EPTs− metastases | 22 | 6.9 ± 9.7 | 0.0382 | 3.4 ± 4.7 | NS | 3.4 ± 5.2 | 0.0182 |
| EPTs + metastases | 18 | 13.2 ± 8.7 | 5.9 ± 4.4 | 7.3 ± 4.6 | |||
| EPTs <2 cm | 12 | 3.8 ± 4.5 | 0.0075 | 1.6 ± 1.9 | 0.0061 | 2.3 ± 2.9 | 0.0137 |
| EPTs >2 cm | 22 | 13 ± 10.6 | 6.2 ± 5.2 | 6.9 ± 5.7 | |||
| Nonfunctioning EPTs | 9 | 21.3 ± 13.3 | 0.0001 | 10.3 ± 6.6 | 0.0001 | 11 ± 6.9 | 0.0001 |
| Functioning EPTs | 35 | 7 ± 6.3 | 3.2 ± 3.1 | 3.8 ± 3.6 | |||
| Insulinoma benign | 11 | 2.5 ± 3.9 | 0.0001 | 1.4 ± 2.0 | 0.0001 | 1.1 ± 2.4 | 0.0001 |
| Insulinoma malignant | 6 | 15.8 ± 4.0 | 7.2 ± 2.4 | 8.7 ± 2.0 | |||
| Insulinoma all | 17 | 7.2 ± 7.6 | 3.4 ± 3.5 | 3.8 ± 4.4 | |||
| Gastrinoma | 7 | 5.4 ± 4.3 | 0.0238† | 2.1 ± 1.9 | 0.0122† | 3.3 ± 2.9 | NS† |
| VIPoma | 7 | 4.9 ± 3.6 | 0.0097‡ | 2 ± 2.5 | 0.0263† | 2.9 ± 1.7 | 0.0141‡ |
| Glucagonoma | 4 | 12.8 ± 4.3 | 6 ± 2.2 | 6.8 ± 2.6 |
*Analysis of variance.
†P values for glucagonoma versus gastrinoma.
‡P values for glucagonoma versus VIPoma.
NS, not significant.
Chromosomal regions that were most often lost (>20% of cases) included 3pq, 6pq, 8q, 10q, and 11pq, with the highest frequency of losses on chromosome 6q (39%) and 11q (36%; Figure 1A ▶ and Table 2A ▶ ). In addition, there were frequent losses of Xp in 20% and of Xq in 25% of patients. Chromosome X losses were more frequent in female than in male patients, ie, Xp loss was seen in seven (32%) and Xq loss in ten (45%) female patients, whereas Xp loss was detected in only two (9%) and Xq loss in one (5%) male patient. Chromosome Y loss was detected in 10 of 22 (45%) males. Increased DNA sequence copy number (>20% of cases) most often involved chromosomes 5pq, 7pq, 9q, 12q, 14q, 17pq, and 20q with the highest frequency of gains on chromosomes 7q (43%) and 17q (41%) (Figure 1A ▶ and Table 2A ▶ ). Gains of chromosomes Xp (25%) and Xq (23%) were more frequently observed in male than in female patients, ie, Xp gain was seen in ten (45%) and Xq gain in seven (32%) male patients, whereas gain of Xp was detected only in two (9%) and Xq gain in three (14%) female patients.
Table 2.
Most Frequent (>20%) Genomic Changes in EPTs
| A Locus | All EPTs n = 44 | EPT − meta n = 22 | EPT + meta n = 18 | P value† | EPT < 2 cm n = 12 | EPT > 2 cm n = 22 | P value | B EPT/NF n = 9 | EPT/F n = 35 | P value | Ins ben n = 11 | Ins mal n = 6 | P value | |
|---|---|---|---|---|---|---|---|---|---|---|---|---|---|---|
| Losses | ||||||||||||||
| 3p | 13 (30)* | 2 (9) | 10 (56) | 0.0014 | 1 (8) | 9 (41) | 0.0464 | 6 (67) | 7 (20) | 0.0062 | 0 (0) | 2 (33) | 0.0415 | |
| 3q | 13 (30) | 4 (18) | 8 (44) | NS | 0 (0) | 10 (45) | 0.0054 | 5 (56) | 8 (23) | NS | 0 (0) | 3 (50) | 0.0098 | |
| 6p | 12 (27) | 3 (14) | 8 (44) | 0.0299 | 1 (8) | 8 (36) | NS | 5 (56) | 7 (20) | 0.0327 | 0 (0) | 3 (50) | 0.0098 | |
| 6q | 17 (39) | 5 (23) | 11 (61) | 0.0137 | 2 (17) | 12 (55) | 0.032 | 6 (67) | 11 (31) | NS | 0 (0) | 6 (100) | 0.0001 | |
| 8q | 10 (23) | 5 (23) | 4 (22) | NS | 1 (8) | 7 (32) | NS | 6 (67) | 4 (11) | 0.0004 | 1 (9) | 1 (17) | NS | |
| 10q | 11 (25) | 3 (14) | 6 (33) | NS | 0 (0) | 9 (41) | 0.0098 | 7 (78) | 4 (11) | 0.0001 | 0 (0) | 2 (33) | 0.0415 | |
| 11p | 13 (30) | 5 (23) | 7 (39) | NS | 1 (8) | 9 (41) | 0.0464 | 7 (78) | 6 (17) | 0.0004 | 1 (9) | 2 (33) | NS | |
| 11q | 16 (36) | 6 (27) | 8 (44) | NS | 1 (8) | 11 (50) | 0.0151 | 7 (78) | 9 (26) | 0.0038 | 1 (9) | 2 (33) | NS | |
| Xq | 11 (25) | 5 (23) | 6 (33) | NS | 4 (33) | 4 (18) | NS | 2 (22) | 9 (26) | NS | 2 (18) | 2 (33) | NS | |
| Y | 10 (23) | 2 (9) | 6 (33) | NS | 1 (8) | 6 (27) | NS | 2 (22) | 8 (23) | NS | 0 (0) | 4 (67) | 0.002 | |
| Gains | ||||||||||||||
| 5p | 10 (23) | 6 (27) | 3 (17) | NS | 1 (8) | 7 (32) | NS | 6 (67) | 4 (11) | 0.0004 | 2 (18) | 1 (17) | NS | |
| 5q | 14 (32) | 7 (32) | 6 (33) | NS | 2 (17) | 9 (41) | NS | 6 (67) | 8 (23) | 0.0118 | 3 (27) | 3 (50) | NS | |
| 7p | 12 (27) | 7 (32) | 4 (22) | NS | 2 (17) | 6 (27) | NS | 5 (56) | 7 (20) | 0.0327 | 1 (9) | 2 (33) | NS | |
| 7q | 19 (43) | 8 (36) | 10 (56) | NS | 3 (25) | 11 (50) | NS | 7 (78) | 12 (34) | NS | 1 (9) | 4 (67) | 0.0128 | |
| 9q | 12 (27) | 3 (14) | 7 (39) | NS | 3 (25) | 6 (27) | NS | 3 (33) | 9 (26) | NS | 2 (18) | 4 (67) | 0.0456 | |
| 12q | 11 (25) | 4 (18) | 6 (33) | NS | 0 (0) | 8 (36) | 0.0169 | 6 (67) | 5 (14) | 0.0012 | 0 (0) | 4 (67) | 0.002 | |
| 14q | 13 (32) | 3 (14) | 10 (56) | 0.0049 | 1 (8) | 10 (45) | 0.027 | 7 (78) | 7 (20) | 0.0009 | 0 (0) | 4 (67) | 0.002 | |
| 17p | 12 (27) | 4 (18) | 6 (33) | NS | 1 (8) | 9 (41) | 0.0464 | 4 (44) | 8 (23) | NS | 0 (0) | 3 (50) | 0.0098 | |
| 17q | 18 (41) | 7 (32) | 9 (50) | NS | 1 (8) | 13 (59) | 0.0041 | 7 (78) | 11 (31) | 0.0117 | 0 (0) | 4 (67) | 0.002 | |
| 20q | 12 (27) | 4 (18) | 7 (39) | NS | 2 (17) | 8 (36) | NS | 5 (56) | 7 (20) | 0.0327 | 1 (9) | 2 (33) | NS | |
| Xp | 11 (25) | 3 (14) | 7 (39) | NS | 1 (8) | 8 (36) | NS | 4 (44) | 7 (20) | NS | 1 (9) | 4 (67) | 0.0128 | |
| Xq | 10 (23) | 1 (5) | 8 (44) | 0.0026 | 0 (0) | 7 (32) | 0.0283 | 5 (56) | 5 (14) | 0.0084 | 0 (0) | 3 (50) | 0.01 |
*The first number in each pair is the number of tumor samples showing the loss or gain; the second number (in parentheses) is the percentage showing the loss or gain.
†Contingency table analysis.
EPT, endocrine pancreatic tumor; meta, metastasis; NF, nonfunctioning; F, functioning; Ins, insulinoma; ben, benign; mal, malignant; NS, not significant.
EPTs from patients with localized disease showed significantly less genomic changes and chromosomal losses than EPTs from patients with advanced disease (Table 1) ▶ . In particular, losses of 3p and 6pq as well as gains of 14q and Xq proved to be associated with an advanced stage of disease (P ≤ 0.0299; Table 2 ▶ ). In addition, we found clear differences in chromosome aberrations in relation to tumor size. EPTs with a diameter <2 cm showed fewer genomic changes than those >2 cm (P ≤ 0.0137; Table 1 ▶ ). Except for losses of Xq, all genomic changes found in >20% of EPTs were more frequently found in the larger tumors, 11 of which were significantly more frequent.
Significant Genetic Differences in EPT Subtypes
Marked differences in chromosomal aberrations were detected in the different EPT subtypes (Tables 1 and 2) ▶ ▶ . In general, the nonfunctioning EPTs exhibited more aberrations per tumor (mean, 21.3) than the functioning ones (mean, 7; P = 0.0001). This difference did not reach statistical significance comparing glucagonomas (mean, 12.8) with the nonfunctioning EPTs (Table 1) ▶ . Strikingly, significant differences in CGH results were observed between benign and malignant insulinomas (mean, 2.5 vs. 15.8, respectively; P = 0.0001; Table 1 ▶ ). In addition, every hormonal subtype of the functioning EPTs (insulinoma, gastinoma, VIPoma, glucagonoma) showed a tendency towards a different mean number of CGH aberrations per tumor when compared with each other, although these differences only reached statistical significance when comparing glucagonomas with gastrinomas and VIPomas (P ≤ 0.0238; Table 1 ▶ ).
Figure 1B ▶ depicts the chromosomal imbalances in the 9 investigated nonfunctioning EPTs. Gains and losses of many chromosomes were detected, mostly involving entire chromosomes or chromosomal arms. Table 2B ▶ demonstrates that 14 of 22 chromosomal loci proved to be more involved in these tumors than in the functioning ones (P < 0.0454) with losses of 10q and 11pq and gains of 7q, 14q, and 17q occurring in 7 out of 9 tumors. In contrast, the functioning EPTs seem to harbor fewer and more regional genomic aberrations (Figure 1C) ▶ with losses of 6q (common region of involvement [CRI]: 6q21–22), 11q (CRI: 11q13–22), Xq (in females: 9/18 = 50%; CRI: Xq22–23) and Y (in males: 8/17 = 47%) as well as gains of 7q (CRI: 7q11.2-q32), 9q (CRI: 9q34), 17q (CRI: 17q11.2–21) and Xp (in males: 7/17 = 41%; CRI: Xp11.3–11.4) in >25% of tumors. Interestingly, the most frequently occurring aberrations were different in the functioning EPT subtypes, ie, benign insulinomas 5q+ (3/11); malignant insulinomas 6q− (6/6), Xp+ and Y− (4/4 males) and Xq− (2/2 females); gastrinomas 3p− and 9q+ (3/7); VIPomas 11q−, Xq−, and Y− (each 3/7); and glucagonomas 7q+ (4/4; Table 2B ▶ ).
Confirmation of CGH Data
To validate the obtained CGH results, ten EPTs were additionally examined by microsatellite and FISH analysis for chromosome 3p alterations. Both techniques confirmed allelic loss of the entire chromosome 3 in three EPTs, including a monosomy for the centromere in the tumor nuclei (Figure 2B) ▶ . In the five tumors without chromosome 3 imbalances, also no LOH was observed. FISH analysis demonstrated in one of these five EPTs, however, a tetrasomy for both the centromere and 3p25 locus in the major population of cells, and this tumor turned out to be aneuploid. In the two EPTs with only regional 3q losses detected by CGH, no losses of the centromere and 3p markers were found by microsatellite and FISH analysis, except for the microsatellite marker at 3p25, which showed LOH in both cases. This locus has been postulated to harbor a novel EPT tumor suppressor gene (TSG). 6,17 Thus, microsatellite and FISH analysis confirmed the CGH data and, moreover, detected tetrasomy for chromosome 3 in one EPT and a microsatellite LOH of 3p25 in two tumors. This LOH was not detected with CGH, probably due to the small size of the chromosomal region lost (<10 Mb).
In addition, in situ hybridization with centromere X- and Y-specific probes was applied to paraffin sections. It confirmed the CGH data of sex chromosome imbalances in eight EPTs of male patients. Four cases with gains of chromosome X in the CGH displayed a disomy for the centromere X in 50 to 70% of tumor nuclei, whereas the other tumors with no imbalances in the CGH displayed one copy of the centromere in the majority of nuclei by in situ hybridization. In five EPTs where CGH revealed chromosome Y losses, no signals for centromere Y could be detected by in situ hybridization, whereas the stromal cells showed the expected number of one copy per nucleus in most cells (Figure 2C) ▶ . The three additional tumors harboring a gain of Y in one EPT and no imbalance of Y in two EPTs also exhibited the expected number of centromere copies (two and one, respectively) in the in situ hybridization.
Discussion
We have performed a comprehensive genome-wide survey of DNA sequence copy number changes in human sporadic EPTs with the goals of correlating the overall number of genetic alterations with clinical and histopathological parameters and identifying new locations of TSGs and oncogenes potentially involved in tumor pathogenesis. The powerful technique of CGH permitted the analysis of DNA extracted from frozen as well as formalin-fixed, paraffin-embedded tumor material. A wide spectrum of genetic aberrations was detected in the EPTs, and a correlation was found between the number of genomic changes per tumor and both disease stage and tumor size. Moreover, marked genetic differences were observed between the various EPT subtypes. The most commonly encountered genetic aberrations were losses on chromosomes 3pq, 6pq, 10q, 11pq, Xq, and Y, and gains on chromosomes 5q, 7pq, 9q, 12q, 17pq, 20q, and Xp. Hence, these chromosomal regions are likely to be important for tumorigenesis or progression of EPTs.
Our CGH data show that EPTs from patients with advanced disease harbored significantly higher numbers of genetic aberrations than tumors from patients with localized disease (mean, 13.2 vs. 6.9, respectively; P = 0.0382). This indicates that EPT progression might be driven by an accumulation of genetic changes, as is known of other types of human carcinomas. 18-20 We found losses of 3p and 6pq and gains of 14q and Xq in association with an advanced disease stage, implying that these chromosomal regions may contain genes playing a role in tumor progression. Indeed, in previous studies 6,17 and the present one, allelic losses at 3p25 were found to be associated with clinically malignant EPTs, which might point to the location of a TSG. Furthermore, losses of 6q (see below) as well as gains of 14q and Xq have been reported to be involved in the progression of various other cancers. 18-20
Another interesting result of our study is that more genetic alterations were found in EPTs >2 cm than in EPTs <2 cm (mean, 13 vs. 3.8, respectively; P = 0.0075). These findings suggest that genetic instability begins to emerge in the smaller tumors, and that with increasing tumor size further genomic changes accumulate, resulting in malignant transformation. Genetic instability would also explain the significantly higher number of genetic changes per tumor observed in nonfunctioning compared to functioning EPTs (21.3 vs. 7, respectively; P = 0.0001), because patients with nonfunctioning EPTs usually exhibit larger tumors than those with functioning EPTs (mean, 6.1 vs. 3.5 cm, respectively, in this study). 1
We noticed that functioning EPTs usually exhibit a more diverse pattern of chromosomal imbalances (by CGH) than nonfunctioning EPTs, often involving smaller, regional chromosomal alterations. Interestingly, a strong tendency towards differences in the total number of genomic changes per tumor and the pattern of aberrations was observed by comparing the various functioning EPT subtypes. For example, glucagonomas exhibited many genetic aberrations per tumor (mean, 12.8) with 7q gain detected in all of them, whereas gastrinomas and VIPomas showed fewer aberrations per tumor (mean, 5.4 and 4.9, respectively) and a different pattern of chromosomal changes. These findings strongly indicate that functioning EPT subtypes may evolve along different genetic pathways. Most interestingly, statistically significant differences were detected between benign and malignant insulinomas (mean, 2.5 vs. 15.8, respectively; P = 0.0001) consisting in 6q losses combined with Xp gain and Y loss (males), or Xq loss (females) in all 6 malignant tumors, and 5q gains most frequently detected in the benign samples (3 of 11). Thus, loss of 6q and the overall number of aberrations per tumor may help to define the malignant potential of insulinomas. For example, one clinically benign insulinoma of 1 cm in diameter harbored 13 different genetic aberrations, and it is tempting to speculate that it represents a potentially malignant insulinoma that was detected in an early stage of disease. Taken together, these data strengthen the need for additional CGH studies on larger series of functioning EPT subtypes, including small, benign ones, to further assess the important cytogenetic changes by subtype that play a role in tumor initiation and progression.
The most prominent sites of DNA losses detected in our study were on chromosomes 3, 6, and 11. LOH at 11q13 is a well-known finding in EPTs, since this locus harbors the MEN1 gene. 2 Although approximately 50% of sporadic EPTs show allelic deletions of the MEN1 gene, the mutation rate was 2 to 3 times lower in frequency, pointing to the existence of yet another TSG more telomeric of the MEN1 gene. 5,21,22 Consistent with this hypothesis, we found losses of 11q in 36% of EPTs, with the smallest CRI at 11q13-q22. In addition, we found losses of 11p (CRI: 11p13-p14) in 30% of cases, which is in accordance with other data 10 and might point to the Wilms’ tumor gene WT1 on 11p13 as a potential candidate TSG. Allelic losses at 3p25 have been found associated with clinically malignant disease in EPTs 6,17 and the present CGH analysis disclosed a statistically significant correlation between chromosome 3p losses and advanced disease. However, 10 of the 13 tumors had actually lost their entire chromosome 3, indicating monosomy, which was confirmed by FISH. Because, in addition, three malignant EPTs had losses of DNA only on 3q (CRI: 3q22-3q26) and 3q26 has been described to contain a putative TSG in osteosarcomas and exocrine pancreatic tumor cells, 23,24 our data might point to yet another TSG on chromosome 3 that plays a role in EPT tumor progression. The most prominent underrepresentation, however, was that of chromosome 6q in 39% of EPTs. Frequent allelic loss of 6q has been reported in many human cancers, 18,25,26 and 6q is among the syntenic regions in man that correspond to a murine chromosome 9 locus, which is commonly deleted in pancreatic insulinomas developing in a transgenic mouse model. 27 We found a CRI at 6q21–22, a region that overlaps with commonly deleted regions described in parathyroid adenomas, malignant melanoma and B cell non-Hodgkin’s lymphoma, 18,25,26 and which is known to suppress tumorigenicity of breast tumor cell lines. 28 Because we observed 6q losses in all 6 malignant insulinomas and the majority of the other malignant EPTs, it is likely that this chromosomal region harbors a critical TSG that may be involved in tumor progression. In our series of 44 EPTs, only occasional chromosomal losses at 9p21, 16p13, 17p13, 18q21, and 22q12 were observed, in contrast to LOH analyses. 9-11 Although this can be due to the limited resolution of the CGH method, 29 there also are evident contradictions among the published LOH data, so that additional studies are required to assess the importance of these loci in EPT pathogenesis.
The most prominent gains detected by CGH were located on chromosomes 5, 7, and 17, with the q arms most frequently involved (32, 43, and 41%, respectively). Overrepresentations of chromosome 5 are also observed in other cancers, including adrenocortical 30 and gastrointestinal endocrine tumors. 21 Because the latter study reported frequent associations of gains of chromosome 5 and 7 and, to a lesser extent, 12, and our CGH data could demonstrate 5q gains already present in three benign insulinomas, the search for a possible oncogene on chromosome 5q in EPTs seems to be justified. Two regions on 7q were mostly involved, ie, 7q11.2-q22 and 7q31.3-q32, which may harbor putative oncogenes, eg, MET at 7q31. Gains of chromosome 17q might point to amplification of the c-erbB-2 proto-oncogene at 17q12-q21, which was suggested to be involved in the pathogenesis of gastrinomas. 8 We examined 11 EPTs with 17q gains for c-erbB-2 expression by immunohistochemistry, and could only identify one gastrinoma with positive staining (data not shown). This suggests that c-erbB-2 gene amplification does not seem to have much functional significance in EPTs. Gains of 17q22-qter are also common in other solid neoplasms, 19,31 but the molecular consequences of this aberration remain unknown.
We detected a high percentage of sex chromosome alterations in all EPT subtypes. Losses of chromosome X were found mainly in female patients, with Xp22-pter and Xq22-q23 as the smallest regions that may harbor potential TSGs. The pseudoautosomal regions on chromosome Xp have especially been implicated as possibly containing several candidate TSGs, such as the steroid sulfatase, X-linked blood group, zinc-finger protein (X-linked), Kallman syndrome, ribosomal protein S4 (X-linked) and X inactive specific transcript genes (http://www.ncbi.nlm.nih.gov/; molecular and literature database). 32 This might explain the frequent occurrence (45%) of chromosome Y losses in male EPTs, which lead to the uncovering of a mutant allele of a gene in the PAR region of the remaining X chromosome. In addition, all four male patients with a malignant insulinoma showed an association of Y loss with Xp gain (CRI: Xp11.3-p11.4), pointing to the involvement of an activated oncogene, eg, ARAF1, in the malignant transformation of insulinomas.
In summary, our data show that frequent chromosomal imbalances exist in EPTs and that the various EPT subtypes differ in their pattern of genetic aberrations. Furthermore, the number of genomic changes per tumor increases with tumor size and disease stage. Our study has identified hitherto unrecognized chromosomal regions, eg, 3q, 5q, 6q, and the X chromosome, as candidates for a more detailed analysis with respect to genes involved in EPT tumor development.
Acknowledgments
We thank M. Mihatsch, G. Sauter, and M. Kasper of the University of Basel for providing tissue samples and for helpful discussions, and N. Wey for photographic and computer-assisted reproductions.
Footnotes
Address reprint requests to Ernst J. M. Speel, Ph.D., Department of Pathology, University of Zürich, Schmelzbergstrasse 12, CH-8091 Zürich, Switzerland. E-mail: ernst-jan.speel@pty.usz.ch.
Supported by Swiss Cancer League Grant SKL-649-2-1998, Swiss National Science Foundation Grant 31–53625.98, and Hartmann Müller Foundation Grant 717.
References
- 1.Klöppel G, In ’t Veld PA, Komminoth P, Heitz PU: The endocrine pancreas. Kovacs K Asa SL eds. Functional Endocrine Pathology. 1998, :pp 415-487 Blackwell Scientific Publications, Oxford [Google Scholar]
- 2.Chandrasekharappa SC, Guru SC, Manickam P, Olufemi S-E, Collins FS, Emmert-Buck MR, Debelenko LV, Zhuang Z, Lubensky IA, Liotta LA, Crabtree JS, Wang Y, Roe BA, Weisemann J, Boguski MS, Agarwal SK, Kester MB, Kim YS, Heppner C, Dong Q, Spiegel AM, Burns AL, Marx S: Positional cloning of the gene for multiple endocrine neoplasia-type 1. Science 1997, 276:404-407 [DOI] [PubMed] [Google Scholar]
- 3.Latif F, Tory K, Gnarra J, Yao M, Duh FM, Orcutt ML, Stackhouse T, Kuzmin I, Modi W, Geil L: Identification of the von Hippel-Lindau disease tumor suppressor gene. Science 1993, 260:1317-1320 [DOI] [PubMed] [Google Scholar]
- 4.Zhuang Z, Vortmeyer AO, Pack S, Huang S, Pham TA, Wang C, Park W-S, Agarwal SK, Debelenko LV, Kester M, Guru SC, Manickam P, Olufemi S-E, Yu F, Heppner C, Crabtree JS, Skarulis MC, Venzon DJ, Emmert-Buck MR, Spiegel AM, Chandrasekharappa SC, Collins FS, Burns AL, Marx SJ, Jensen RT, Liotta LA, Lubensky IA: Somatic mutations of the MEN 1 tumor suppressor gene in sporadic gastrinomas and insulinomas. Cancer Res 1997, 57:4682-4686 [PubMed] [Google Scholar]
- 5.Görtz B, Roth J, Krähenmann A, De Krijger RR, Muletta-Feurer S, Rütimann K, Saremaslani P, Speel EJM, Heitz PU, Komminoth P: Mutations and allelic deletions of the MEN 1 gene are associated with a subset of sporadic endocrine pancreatic and neuroendocrine tumors and not restricted to foregut neoplasms. Am J Pathol 1999, 154:429-436 [DOI] [PMC free article] [PubMed] [Google Scholar]
- 6.Chung DC, Smith AP, Louis DN, Graeme-Cook F, Warshaw AL, Arnold A: A novel pancreatic endocrine tumor suppressor gene locus on chromosome 3p with clinical prognostic implications. J Clin Invest 1997, 100:404-410 [DOI] [PMC free article] [PubMed] [Google Scholar]
- 7.Yashiro T, Fulton N, Hara H, Yasuda K, Montag A, Yashiro N, Straus F, Ito K, Aiyoshi Y, Kaplan EL: Comparison of mutations of ras oncogene in human pancreatic exocrine and endocrine tumors. Surgery 1993, 114:758-764 [PubMed] [Google Scholar]
- 8.Evers BM, Rady PL, Sandoval K, Arany I, Tyring SK, Sanchez RL, Nealon WH, Townsend CM, Thompson JC: Gastrinomas demonstrate amplification of the HER-2/neu proto-oncogene. Ann Surg 1994, 219:596-604 [DOI] [PMC free article] [PubMed] [Google Scholar]
- 9.Beghelli S, Pelosi G, Zamboni G, Falconi M, Iacono C, Bordi C, Scarpa A: Pancreatic endocrine tumours: evidence for a tumour suppressor pathogenesis and for a tumour suppressor gene on chromosome 17p. J Pathol 1998, 186:41-50 [DOI] [PubMed] [Google Scholar]
- 10.Chung DC, Brown SB, Graeme-Cook F, Tillotson LG, Warshaw AL, Jensen RT, Arnold A: Localization of putative tumor suppressor loci by genome-wide allelotyping in human pancreatic endocrine tumors. Cancer Res 1998, 58:3706-3711 [PubMed] [Google Scholar]
- 11.Muscarella P, Melvin WS, Fisher WE, Foor J, Ellison EC, Herman JG, Schirmer WJ, Hitchcock CL, DeYoung BR, Weghorst CM: Genetic alterations in gastrinomas and nonfunctioning pancreatic neuroendocrine tumors: an analysis of p16/MTS1 tumor suppressor gene inactivation. Cancer Res 1998, 58:237-240 [PubMed] [Google Scholar]
- 12.Kallioniemi A, Kallioniemi O-P, Sudar D, Rutovitz D, Gray JW, Waldman F, Pinkel D: Comparative genomic hybridization for molecular cytogenetic analysis of solid tumors. Science 1992, 258:818-821 [DOI] [PubMed] [Google Scholar]
- 13.Klöppel G: Classification of neuroendocrine tumors. Verh Dtsch Ges Pathol 1997, 81:111-117 [PubMed] [Google Scholar]
- 14.Görtz B, Roth J, Speel EJM, Krähenmann A, De Krijger RR, Matias-Guiu X, Muletta-Feurer S, Rütimann K, Saremaslani P, Heitz PU, Komminoth P: MEN 1 gene mutation analysis of sporadic adrenocortical lesions. Int J Cancer 1999, 80:373-379 [DOI] [PubMed] [Google Scholar]
- 15.Richter J, Jiang F, Görög J-P, Sartorius G, Egenter C, Gasser TC, Moch H, Mihatsch MJ, Sauter G: Marked genetic differences between stage pTa and stage pT1 papillary bladder cancer detected by comparative genomic hybridization. Cancer Res 1997, 57:2860-2864 [PubMed] [Google Scholar]
- 16.Hopman AHN, Van Hooren E, Van de Kaa CA, Vooijs GP, Ramaekers FCS: Detection of numerical chromosome aberrations using in situ hybridization in paraffin sections of routinely processed bladder cancers. Mod Pathol 1991, 4:503-513 [PubMed] [Google Scholar]
- 17.Barghorn A, Rütimann K, Saremaslani P, Muletta S, Speel EJM, Roth J, Heitz PU, Komminoth P: Loss of heterozygosity von 3p25 in sporadischen neuroendokrinen Pankreastumoren: ein Malignitätsmarker? Schweiz Med Wochenschr 1998, 128:1870 [Google Scholar]
- 18.Millikin D, Meese E, Vogelstein B, Witkowski C, Trent J: Loss of heterozygosity for loci on the arm of chromosome 6 in human malignant melanoma. Cancer Res 1991, 51:5449-5453 [PubMed] [Google Scholar]
- 19.Knuutila S, Björkqvist A-M, Autio K, Tarkkanen M, Wolf M, Monni O, Szymanska J, Larramendy ML, Tapper J, Pere H, El-Rifai W, Hemmer S, Wasenius V-M, Vidgren V, Zhu Y: DNA copy number amplifications in human neoplasms. Am J Pathol 1998, 152:1107-1123 [PMC free article] [PubMed] [Google Scholar]
- 20.Kuukasjärvi T, Karhu R, Tanner M, Kähkönen M, Schäffer A, Nupponen N, Pennanen S, Kallioniemi A, Kallioniemi O, Isola J: Genetic heterogeneity and clonal evolution underlying development of asynchronous metastasis in human breast cancer. Cancer Res 1997, 57:1597-1604 [PubMed] [Google Scholar]
- 21.Terris B, Meddeb M, Marchio A, Danglot G, Fléjou J-F, Belghiti J, Ruszniewski P, Bernheim A: Comparative genomic hybridization analysis of sporadic neuroendocrine tumors of the digestive system. Genes Chromosomes Cancer 1998, 22:50-56 [DOI] [PubMed] [Google Scholar]
- 22.Chakrabarti R, Srivatsan ES, Wood TF, Eubanks PJ, Ebrahimi SA, Gatti RA, Passaro E J, Sawicki MP: Deletion mapping of endocrine tumors localizes a second tumor suppressor gene on chromosome band 11q13. Genes Chromosomes Cancer 1998, 22:130-137 [DOI] [PubMed] [Google Scholar]
- 23.Kruzelock RP, Murphy EC, Strong LC, Taylor SL, Hansen MF: Localization of a novel tumor suppressor locus on human chromosome 3q important in osteosarcoma tumorigenesis. Cancer Res 1997, 57:106-109 [PubMed] [Google Scholar]
- 24.Ozaki K, Nagata M, Suzuki M, Fujiwara T, Miyoshi Y, Ishikawa O, Ohigashi H, Imaoka S, Takahashi E, Nakamura Y: Isolation and characterization of a novel human pancreas-specific gene, pancpin, that is down-regulated in pancreatic cancer cells. Genes Chromosomes Cancer 1998, 22:179-185 [PubMed] [Google Scholar]
- 25.Gaidano G, Hauptschein RS, Parsa NZ, Offit K, Rao PH, Lenoir G, Knowles DM, Chaganti RSK, Dalla-Favera R: Deletions involving two distinct regions of 6q in B-cell non-Hodgkin lymphoma. Blood 1992, 80:1781-1787 [PubMed] [Google Scholar]
- 26.Tahara H, Smith AP, Gaz RD, Cryns VL, Arnold A: Genomic localization of novel candidate tumor suppressor gene loci in human parathyroid adenomas. Cancer Res 1996, 56:599-605 [PubMed] [Google Scholar]
- 27.Dietrich W, Radany E, Smith J, Bishop J, Hanahan D, Lander E: Genome-wide search for loss of heterozygosity in transgenic mouse tumors reveals candidate tumor suppressor genes on chromosomes 9 and 16. Proc Natl Acad Sci USA 1994, 91:9451-9455 [DOI] [PMC free article] [PubMed] [Google Scholar]
- 28.Negrini M, Sabbioni S, Possati L, Rattan S, Corallini A, Barbanti-Brodano G, Groce CM: Suppression of tumorigenicity of breast cancer cells by microcell-mediated chromosome transfer: studies on chromosome 6 and 11. Cancer Res 1994, 54:1331-1336 [PubMed] [Google Scholar]
- 29.Bentz M, Plesch A, Stilgenbauer S, Döhner H, Lichter P: Minimal sizes of deletions detected by comparative genomic hybridization. Genes Chromosomes Cancer 1998, 21:172-175 [PubMed] [Google Scholar]
- 30.Kjellman M, Kallioniemi O-P, Karhu R, Höög A, Farnebo L-O, Auer G, Larsson C, Bäckdahl M: Genetic aberrations in adrenocortical tumors detected using comparative genomic hybridization correlate with tumor size and malignancy. Cancer Res 1996, 56:4219-4223 [PubMed] [Google Scholar]
- 31.Mahlamäki EH, Höglund M, Gorunova L, Karhu R, Dawiskiba S, Andrén-Sandberg A, Kallioniemi O-P, Johansson B: Comparative genomic hybridization reveals frequent gains of 20q, 8q, 11q, 12p, and 17q, and losses of 18q, 9p, and 15q in pancreatic cancer. Genes Chromosomes Cancer 1997, 20:383-391 [DOI] [PubMed] [Google Scholar]
- 32.Jiang F, Richter J, Schraml P, Bubendorf L, Gasser T, Sauter G, Mihatsch MJ, Moch H: Chromosomal imbalances in papillary renal cell carcinoma. Genetic differences between histological subtypes. Am J Pathol 1998, 153:1467-1473 [DOI] [PMC free article] [PubMed] [Google Scholar]